Detection Of Primary User Emulation Attack (PUEA) In Cognitive Radio Networks Using One-Class Classification
Abstract
Opportunistic usage of spectrum owned by licensed (or primary) users is the cornerstone on which the Cognitive Radio technology is built. Unlicensed (or secondary) users that thus use the spectrum rely opportunistically on spectrum sensing to determine the presence of primary user signal. In such a context, an attacker may mimic the behavior of a primary user (PU) to deceive the secondary users (SUs) into believing that a PU signal is present whereas it is not. Such an attack is known as the Primary User Emulation Attack (PUEA). A malicious user may launch a PUEA with the intention of grabbing the vacant bands for its own transmission. Another reason may be to simply disrupt the functioning of the Cognitive Radio Network (CRN). This work investigates the use of one-class classification for detecting PUEA in an infrastructure-based CRN. We opine that sensing data collected at the fusion center mainly for Collaborative Spectrum Sensing (CSS) can be exploited to characterize a PU signal. The PU signal features thus learned can aid in distinguishing a PU signal from a PU signal emulation. In particular, we investigate the use of one-class classification techniques, viz., Isolation Forest, Support Vector Machines (SVM), Minimum Covariance Determinant(MCD) and Local Outlier Factor(LOF) for detection of PUEA attacks. Simulation results support the validity of using one-class classification for detection of PUEA.
keywords:
Primary User Emulation Attacks (PUEA), one-class classification, outlier detection, cognitive radio network security.1 Introduction
The last few decades have witnessed the mushrooming of wireless technologies and services which has led to crowding the ISM bands, which will eventually lead to ‘radio traffic jam’. Ironically, studies have shown that whereas some bands are overcrowded, some others, and a lot of the licensed bands in particular, lie fallow most of the time and in most areas. This has led to the emergence of cognitive radio technology. The basic idea of this technology is to make opportunistic use of these fallow bands without causing harmful interference to licensed users, which own these bands. These licensed users are also known as primary users (PUs). Thus in CRNs, unlicensed or secondary users (SUs) look out for unused licensed spectrum bands with the help of spectrum sensing. One important underlying principle upon which opportunistic usage in CRN works is that SUs must not cause harmful interference to PUs. This implies two things. First, only when an SU detects that a band is unused, then only, it can use the band for its transmission. Second, when an SU is transmitting in an unused band and the PU starts its transmission, the SU must vacant the band immediately.
Unfortunately, such a requirement opens the door for attacks such as the as the Primary user emulation (PUE) attack. This attack happens when an attacker (which could be an SU acting maliciously) emulates a PU signal. Consequently, if other honest SUs happen to be using the associated channel, they will evacuate from the channel. On the other hand, if they happen to be waiting for this channel to be free, they will not be able to use it as they would mistakenly sense that PU signal is present. An inside attacker, viz., a malicious SU, may launch a PUEA for grabbing the channel selfishly for itself. On the other hand, an outside attacker may do so for causing a DoS (Denial of Service) attack. Hence, the PUEA greatly limits the spectrum access opportunity of SUs.
Whereas there are several PUEA mitigation techniques in the literature, unlike them, this work proposes the use of one-class classification for the same. The basic motivation behind this work is: ‘The sensing data collected at the fusion center (FC) forms a rich audit data-set for understanding the features of a PU Transmission. One-class classification is a perfect fit, as it can use this imbalanced data-set for training a model. The trained model can be used for detecting any PU-like transmission which do not fit into this class of ‘PU transmissions.’
The contributions of this paper can be summarized as follows:
-
1.
One-class classification is used for detecting PUEA. Four classification algorithms are investigated, viz., Isolation Forest, Support Vector Machine, MCD and LOF.
-
2.
Audit data of the sensing reports collected at the FC are processed to characterize the behaviour of a PU transmission, thereby generating the training data-set.
-
3.
Simulation results support the validity of using one-class classification for PUEA detection.
The rest of this paper is structured as follows. Section 2 reviews related existing works, which is followed by the system model in section 3. Then, we explain the development of the proposed scheme in section 4. In section 5, we present the results and performance analysis which is followed by the conclusions in section 6.
2 Related Work
Research on detecting PUE attacks is an ongoing activity. A lot of work in this area has been reported in the literature [1] - [17]. In [1], an analytical model and a practical mechanism to detect PUEA in CRNs (a.k.a. dynamic spectrum access networks) are presented. In a similar work [2], an analytical approach using Fenton’s approximation and Markov inequality to obtain a lower bound on the probability of a successful PUEA is presented, in which a fading wireless environment is considered. In [3], we find a survey on security threats and related protection techniques for Software Defined Radio (SDR) and Cognitive Radio (CR) technologies. Estimation techniques (e.g., maximum likelihood estimation) and the learning methods (e.g., mean-field approach) can also be used for mitigating PUEA, wherein individual spectrum decision is obtained by characterizing the received power at good secondary user through a flexible log-normal sum approximation method [4].
An example of a technique based on localization is presented in [5], in which a transmitter verification scheme, called LocDef (localization-based defense) is given which verifies whether a given signal is that of an incumbent transmitter by estimating its location and observing its signal characteristics. The scheme presented in [6] uses the activity pattern of a signal through spectrum sensing, such as the ON and OFF periods of the signal. Then, the observed signal activity pattern is reconstructed through a reconstruction model. The reconstruction error is used to distinguish a signal activity pattern of a PU from a signal activity pattern of a PUEA attacker. A comparatively involved scheme [7] uses cryptographic signatures and wireless link signatures (derived from physical radio channel characteristics) to enable primary user detection in the presence of PUEA attackers. In [8], a framework for security and resilience is applied to spectrum sensing functionality to ensure that it is robust even in the event of failures and PUEA.
In [9], the authors develop a distributed spectrum decision protocol in which SUs make individual spectrum decisions and then exchange individual sensing results with their one-hop neighbors to increase resilience to PUEA. In [10], a mechanism for detection and prevention of PUEA is presented, which employs Time-Distance with signal Strength Evaluation (TDSE) and Extreme Machine Learning (EML) algorithm. Whereas our work also uses machine learning, it relies only on the audit data of sensing reports received at the FC. However, in [10], the authors use time duration of traversal, RSS from the oncoming transmitter and the ideal time of the PU. A novel algorithm for detecting non-intelligent primary user emulation attack is presented in [11]. Neyman-Pearson composite hypothesis test (NPCHT) and Wald’s sequential probability ratio test (WSPRT) are employed in [12] to detect PUEA. In [13], the authors describe the special characteristics of cognitive radio and CRN and present an analysis the potential security threats that arise due to these characteristics. A method to detect the PUE attack of mobile PUs by exploiting the correlations between RF signals and acoustic information with the aim of verifying the existence of wireless microphones is found in [14]. In [15], a spectrum decision protocol resilient to PUEA in dynamic spectrum access networks is proposed. Device-specific features have been employed to propose a passive, non-parametric classification method to determine the number of PUs that are transmitting in the spectrum. In [17], an algorithm for the detection of PUEA and jamming attacks in CRN is proposed, which is founded on the sparse coding of the compressed received signal over a channel-dependent dictionary.
Our work is motivated by the above tools and techniques. However, none of them have used one-class classification which we perceive is a suitable technique for detecting PUEA. Moreover, just by analyzing the sensing reports received at the FC, a PU transmission can be characterised and the derived features are used to drive the classification model. To the best of our knowledge, our work is the first one which employs sensed data at the FC to train one-class classification models for detecting PUEA. Representative algorithms such as Isolation Forest (IF), SVM, MCD and LOF are employed in our work.
3 System Model
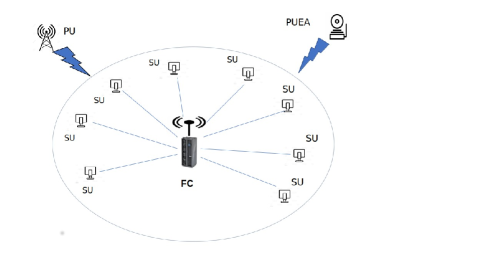
We assume a CRN consisting of SUs, wherein all the SUs collaborate to sense the presence of a PU. We assume that the PU and the SUs are stationary, and the PU is away from the SU. No two SUs have the same location. The system model is illustrated in Fig. 1.
For simplicity, we consider a single-channel system. Each SU takes the help of an energy detector for sensing the channel locally [4] and sends its sensing report to the FC. Here, we assume a continuous reporting CRN and so, each SU sends the energy level (in dB) of the received signal to the FC. The FC uses some fusion rule to make the final decision about whether the PU is present or not. However, how the decision is made is not the focus of our study. Rather, it focuses on exploiting these sensing reports (raw energy levels) received at the FC for mitigating PUEA.
Time for each SU is divided into fixed-size slots and these slots are synchronized. Each slot is again subdivided into two sub-slots: i) sensing, and ii) data transmission, wherein the first sub-slot is for sensing and the second one for data transmission. In each sensing sub-slot, an SU senses the channel and sends the sensing report to the FC. Thus, in this sub-slot, the FC receives the reports (energy values), from the SUs.
The relationship between the transmit signal power and the received signal power is modelled with the help of the path loss model and the log-normal shadowing of a communication channel as in [4]. Assuming the path loss exponent, , the received signal energy is proportional to r, where is the distance between the transmitter and the receiver. Additionally, is also proportional to a shadowing random variable G. Here, G=, where and follows a normal distribution, ). Thus, when a transmitter employs energy to transmit signals, then the received signal energy, at the receiver end is given by [4]:
| (1) |
At the FC, these received energy values are processed to create the data-set, which is described later. The built data-set is used for one-class classification with the goal of mitigating PUEA. As seen in Fig. 1, a PUEA can be launched by an outsider with the aim of disrupting the functioning of the CRN. Alternatively, it can also be launched by an insider, i.e., one among the SUs.
4 PUEA Detection as a One-Class Classification Problem
This section describes how we employ one-class classification for detecting PUEA attack in a CRN. First we describe how the detection problem can be transformed into a one-class classification problem. Second, we present how data-sets are formed and can be used for analysis. Third, we explain in brief the classification algorithms, viz., Isolation Forest, SVM, MCD and LOF that have been used in our work.
4.1 One-Class Classification
In classification, it may happen that the training set is such that all or most of the examples in the set are from one class (say, the positive class), and none or very little from the negative class. Such a classification is called one-class classification. After the model is trained using such a data-set, a new example which is fed to the trained model would be classified into either the positive class of the negative class. When the training set consists of only examples from one class, an input example which does not get classified into this class is also called an outlier. Hence, one-class classification techniques are also known as outlier detection techniques.
4.2 Motivation
Any transmission which imitates a PU transmission falls under the gambit of PUEA. Since the only requirement of this attack is that normal SUs should unwittingly sense it as a PU signal, there could be several ways this attack is carried out. For instance, an attacker could position itself as close as possible to a PU station and launch an attack. Alternatively, it could emulate the PU signal (e.g., PU’s transmission power). Thus, it is a challenging task to profile a PUEA behaviour. On the other hand, profiling of a PU behaviour is easier comparatively, since a PU does not change its form over long periods of time. For instance, most of the PU stations are stationary stations (e.g., a TV tower) which do not generally change its transmission characteristics over long periods of time. In conclusion, the idea is to build a training data-set that consists of only PU signal examples. Consequently, one-class classification is a perfect fit for detecting PUEA.
4.3 Building the Data-set
At each slot, when the FC receives the sensing reports (energy levels) from the SUs, it collects them and calculates the mean, variance, median, upper quartile and lower quartile of the values and creates a training example. Thus, each training example consists of five input features: mean, variance, median, upper quartile, lower quartile. We include output feature (i.e., label) as ‘1’ (positive class) when PU is present. On the other hand, if the example is from a PUEA, it would be labelled ‘-1’ (negative class). So, if we collect data from slots to create the data-set, there would be examples. in which PU is present, there will be examples.
4.4 Classification Algorithms
The data gathered at the FC for a good PU is processed so as to train a classifier. Subsequently, we can employ the trained classifier to predict whether the signal is from a PU or an attacker. We use four classifiers, viz., Isolation Forest, Support Vector Machine (SVM), Minimum Covariance Determinant (MCD) and Local Outlier Factor (LOF).
4.4.1 Isolation Forest
Isolation Forest [18] is a tree-based anomaly detection algorithm. Anomalies are isolated with the help of tree structures. The trees are created in such a way that isolated examples tend to have a relatively short depth in the trees as compared to normal examples which are less isolated, and thereby exhibit a greater depth in the trees.
4.4.2 Support Vector Machine (SVM)
Initially, the SVM algorithm was developed for binary classification. However, it can be employed for one-class classification [19]. For SVM to behave as a one-class classification technique, the algorithm works by capturing the density of the majority class. Then, examples on the extremes of the density function are classified as outliers. The SVM thus modified is known as One-Class SVM.
4.4.3 Minimum Covariance Determinant (MCD)
MCD [20] algorithm works by creating a a hypersphere (ellipsoid) in such a way that it covers the normal data (examples). Hence, any example that is not covered by this shape is detected as an outlier. MCD is an efficient implementation of this technique for multivariate data.
4.4.4 Local Outlier Factor(LOF)
Another approach [21] to detect outliers is to identify those examples that are far from the other examples, which form larger groups in the feature space. This approach works by determining the LOF degree of each example with the help of nearest neighbors concept. This technique is known to be more reliable for less number of features as compared to when the number of features is high.


5 Results and Discussion
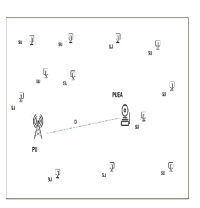
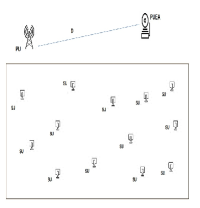
This section presents the simulation results. We consider a CRN consisting of 40 SUs and 10,000 sensing slots. We assume that the SUs occupy some region of sq. units. Then, we randomly generate the locations of the SUs in this region. Next, we choose a location each for the PU and the attacker. Depending on how their locations are chosen, we consider two scenarios: (i) when the PU and the attacker are within the same region as the SUs as depicted in Fig. 2(a), and (ii) when the PU and the attacker are outside the SUs’ region (refer Fig. 2(b)). In both the figures, denotes the distance between the PU and the attacker.
The model described in Section 3 is used to create the data-set. We assume the same paramater values used in [4]. Thus, we let and when PU is transmitting. Whereas, when the attacker is transmitting, the channel parameter is = 4, 8, or 12.
Using the above model, the energy levels received from the PU at the SUs are generated for each slot. Then, they are processed to generate the examples, each example consisting of input features, viz., the mean, variance, median, upper quartile and lower quartile of for each slot. Here, we assume that a common control channel is used to send the energy levels from the SUs to the FC and that there is no channel error. Hence, the data-set is created at the FC. Since 10,000 slots are considered, the size of the training data-set is 10,000.
Similarly, for testing purpose, the energy levels that are received at the SUs from the attacker are artificially generated using the same model. Due to lack of availability of real-world data-set w.r.t. PUEA, we build an artificial data-set as explained above.
We say that a true positive has occurred if a malicious PUE attack is detected as malicious, whereas a false positive has occurred if a geniune PU is incorrectly detected as an attacker. Similarly, we say that a true negative has occurred if a good PU is detected as a genuine PU, whereas a false negative has occured if an attacker is identified as a genuine PU.
Let TP, TN, FP, FN and N denote the count of true positives, true negatives, false positives, false negatives and the total number of examples. Note that . The performance parameters considered are: i) : It gives a measure of how many cases are correctly identified. It is defined by term, . It is most useful when all the classes are equally important. ii) : It gives a measure of how many out of all the predicted positive cases are correctly identified as positive cases. It is defined by term, . Thus, this value will be high when FP is less. iii) : It gives a measure of how many out of all the actual positive cases are correctly identified as positive cases. It is defined by term, . Thus, this value will be high when FN is less. iv) : It is the harmonic mean of Precision and Recall. Thus, this value will be high when the count of incorrectly classified cases is less. The values of these metrics shown in the following result graphs are in terms of percentage.
The simulation results are divided into two parts based on the location of the PU and the attacker w.r.t. the region where the SUs lie. We consider two scenarios as shown in Fig. 2. This helps us to determine whether such factors have any impact on the detection system.
5.1 PU Inside SU Region
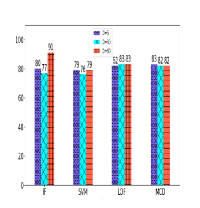
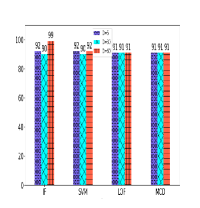
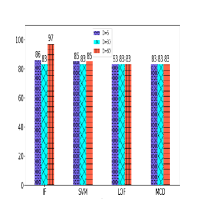
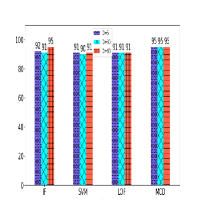
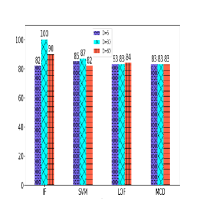
In the scenario when the PU and the attackers are within the region where the SUs lie (refer Fig. 2(a)), we compare the results for varying distances between the PU and the attacker. Moreover, we vary the percentage of PUEA examples in the test set and determine the results. It may be noted here that the training set consists of only examples associated with the PU signal (i.e., 10,000 examples) as explained in section 4.3. However, with regard to the test set, we initially form it using the training set (consisting of 10,000 examples) and PUEA examples whose count is of the size of the training set. Thus, the test set consists of 11,000 examples. Next, we increase the percentage of the PUEA examples in the test set from to . The accuracy shown by different algorithms for varying values of ‘D’ are shown in Fig. 3. The label ‘D=5’ indicates the plot when the distance between the PU and the attacker is 5 units. Similar labels in the rest of the graphs have similar meanings. In Fig. 3(a), we find that LOF and MCD outperform the other algorithms with an accuracy of . We find that the accuracy drops a little when the percentage of PUEA examples is (refer Fig. 3(b)) as compared to when it is (refer Fig. 3(a)). This is due to the increase in the number of unseen examples which are not in the training set. We also find that there is no perceivable difference between the results when the values of are varied.
| k | IF | SVM | MCD | LOF |
|---|---|---|---|---|
| acc.(%) | acc.(%) | acc.(%) | acc.(%) | |
| 2 | 84 | 84 | 90 | 90 |
| 5 | 83 | 84 | 90 | 90 |
| 10 | 84 | 84 | 90 | 90 |
| 20 | 84 | 85 | 90 | 90 |
| k | IF | SVM | MCD | LOF |
|---|---|---|---|---|
| acc.(%) | acc.(%) | acc.(%) | acc.(%) | |
| 2 | 77 | 79 | 83 | 82 |
| 5 | 77 | 79 | 82 | 82 |
| 10 | 77 | 79 | 82 | 82 |
| 20 | 76 | 78 | 82 | 82 |
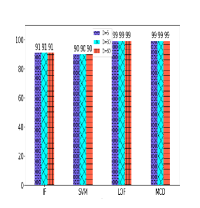
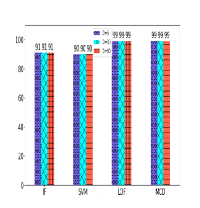
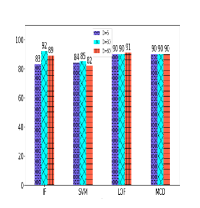
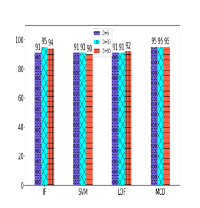
When the data-sets are imbalanced as in our study, accuracy may not be a good parameter to measure performance. One important metric is precision. Fig. 4 illustrates the corresponding precision values for the same scenarios. Precision is recorded to be above when the percentage of PUEA data in the test set is (refer Fig. 4(a)) whereas it is above when the corresponding percentage is (refer Fig. 4(b)) due to the reason stated earlier that there are more unseen examples in this case as compared to the earlier case, viz., case.
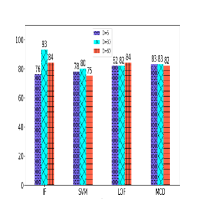
Recall is illustrated in Fig. 5. For both the scenarios (graphs), recall is above for all the algorithms. Moreover, the F1-score is also well above for all the algorithms for both scenarios (refer Fig. 6).


Additionally, we employ -fold cross validation on the two test data-sets. We partition the data-set into fixed-sized divisions of equal size. Then, we choose one partition as the test data and the rest partitions as the training data. We, then train the model using the training data and test using the test data. This process is repeated for iterations by choosing a distinct partition as the test data in each iteration. The performance results shown are determined by averaging over the iterations. Tables 1 and 2 give the accuracy for different values of . Here, the value of does not seem to have any significant effect on the accuracy.
5.2 PU Outside SU Region
The results presented in the previous subsection are for the case when the PU and the attacker are in the same region as the SUs (as illustrated in Fig. 2(a)). In this subsection, we present the results when they are outside the region (as illustrated in Fig. 2(b)). This results are obtained so as to check whether there is any effect of varying distance and orientation between the PU and the SUs.
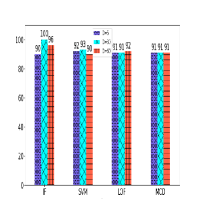
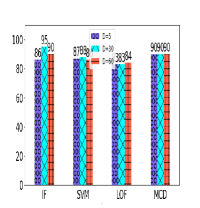
The corresponding graphs that depict accuracy are given in Fig. 7. We find that even if the PU and attacker are farther away from the SUs, the performance of the ML-based detection system is good. This can be seen also w.r.t. other performance metrics such as Precision, Recall and F1-score as illustrated in Figs. 8 to 10.
| k | IF | SVM | MCD | LOF |
|---|---|---|---|---|
| acc.(%) | acc.(%) | acc.(%) | acc.(%) | |
| 2 | 82 | 84 | 90 | 90 |
| 5 | 82 | 84 | 89 | 90 |
| 10 | 82 | 84 | 89 | 90 |
| 20 | 82 | 84 | 90 | 90 |
| k | IF | SVM | MCD | LOF |
|---|---|---|---|---|
| acc.(%) | acc.(%) | acc.(%) | acc.(%) | |
| 2 | 75 | 78 | 82 | 82 |
| 5 | 75 | 78 | 82 | 82 |
| 10 | 75 | 78 | 82 | 82 |
| 20 | 74 | 78 | 82 | 82 |
6 Conclusions
This research studies the use of supervised machine learning, viz., one-class classification as a tool for detecting PUEA in infrastructure-based CRN. Classifiers such as Isolation Forest (IF), SVM, MCD and LOF are examined. We show through simulation how audit data of the sensing reports collected at the FC can be processed to characterize the behaviour of a PU transmission, thereby generating the training data-set. To the best of our knowledge, there has been no similar study that employs the rich sensed data collected at the FC for characterizing a PU transmission. Subsequently, we employ one-class classification algorithms and train them using the data-set thus created to build models that detect PUEA. Of all the techniques, SVM performs the worst with inconsistent performance. Isolation Forest (IF) performs better than SVM but not as good as MCD and LOF. MCD and LOF are the most robust, showing consistently very good performance.
References
- [1] Z. Jin, S. Anand, and K. P. Subbalakshmi, Detecting primary user emulation attacks dynamic spectrum access networks, IEEE International Conference on Communications, (ICC’2009) 1-3 doi:10.1109/icc.2009.5198911.
- [2] S. Anand, Z. Jin and K. P. Subbalakshmi, An Analytical Model for Primary User Emulation Attacks in Cognitive Radio Networks. 3rd IEEE Symposium on New Frontiers in Dynamic Spectrum Access Networks,USA (2008) 1-6, doi: 10.1109/DYSPAN.2008.16
- [3] G. Baldini, T. Sturman, A. Biswas, R. Leschhorn, G. Godor, and M. Street, Security aspects in software defined radio and cognitive radio networks: A survey and a way ahead, IEEE Communications Surveys and Tutorials,(2011) 1-14 doi:10.1109/SURV.2011.032511.00097.
- [4] Zesheng Chen, T. Cooklev, Chao Chen and C. Pomalaza-Ráez, Modeling primary user emulation attacks and defenses in cognitive radio networks, IEEE 28th International Performance Computing and Communications Conference, (2009) 209-214, doi: 10.1109/PCCC.2009.5403815.
- [5] R. Chen, J. Park and J. H. Reed, Defense against Primary User Emulation Attacks in Cognitive Radio Networks.IEEE Journal on Selected Areas in Communications,(2008) vol. 26, 25-37, doi: 10.1109/JSAC.2008.080104.
- [6] C. Xin and M. Song. Detection of PUE Attacks in Cognitive Radio Networks Based on Signal Activity Pattern,IEEE Transactions on Mobile Computing,(2014) vol. 13, no. 5, 1022-1034, doi: 10.1109/TMC.2013.121.
- [7] Y. Liu, P. Ning and H. Dai, Authenticating Primary Users’ Signals in Cognitive Radio Networks via Integrated Cryptographic and Wireless Link Signatures, IEEE Symposium on Security and Privacy (2010) 281-300, doi: 10.1109/SP.2010.24.
- [8] Julio Soto and Michele Nogueira, A framework for resilient and secure spectrum sensing on cognitive radio networks, Computer Networks,(2017) vol 115, 130–138. doi:10.1016/j.comnet.2017.01.012
- [9] Z. Jin, J. P. Morgan, S. Anand and K. P. Subbalakshmi, NEAT: A NEighbor AssisTed spectrum decision protocol for resilience against PUEA, Conference on Communications and Network Security (2014) 44-52, doi: 10.1109/CNS.2014.6997464.
- [10] N. Sureka and K .Gunaseelan, Investigations on detection and prevention of primary user emulation attack in cognitive radio networks using extreme machine learning algorithm, Journal of Ambient Intelligence and Humanized Computing. (2021) 1-6, doi.org/10.1007/s12652-021-03080-5
- [11] Di Pu, Yuan Shi, Andrei V. Ilyashenkot and Alexander M. Wyglinski, Detecting Primary User Emulation Attack in Cognitive Radio Networks, IEEE Global Telecommunications Conference GLOBECOM, (2011) 1-4 . doi:10.1109/glocom.2011.6134419
- [12] Z. Jin, S. Anand, and K. P. Subbalakshmi, Mitigating primary user emulation attacks in dynamic spectrum access networks using hypothesis testing, ACM Mobile Computing and Communications Review,Special Issue on Cognitive Radio Technologies and Systems,(2009) vol. 13,no. 2, doi:10.1145/1621076.162108
- [13] Y. Zhang, G. Xu and X. Geng, Security threats in cognitive radio networks, Proceedings of the IEEE International Conference on High Performance Computing and Communications, (2008) 1-4 , doi:10.1109/HPCC.2008.21
- [14] S. Chen, K. Zeng, and P. Mohapatra, Hearing is believing:Detecting mobile primary user emulation attack in white space, Proceedings IEEE INFOCOM (2011), 36-40, doi: 10.1109/INFCOM.2011.5935184.
- [15] Z. Jin, S. Anand, and K. Subbalakshmi, Robust spectrum decision protocol against primary user emulation attacks in dynamic spectrum access networks, IEEE Global Telecommunications Conference GLOBECOM (2010) 1-4, doi:10.1109/glocom.2010.5683174
- [16] N. Nguyen, R. Zheng, and Z. Han, On identifying primary user emulation attacks in cognitive radio systems using nonparametric Bayesian classification, IEEE Trans. Signal Process,(2012) vol. 60,1432–1445, doi:10.1109/tsp.2011.2178407
- [17] H. M. Furqan, M. A. Aygül, Mahmoud Nazzal and Hüseyin Arslan, Primary user emulation and jamming attack detection in cognitive radio via sparse coding, EURASIP Journal on Wireless Communications and Networking volume, 141 (2020) 1-3.doi.org/10.1186/s13638-020-01736-y
- [18] F.T. Liu, K.M. Ting and Z. Zhou, Isolation Forest, IEEE International Conference on Data Mining. (2008) 413-422, doi: 10.1109/ICDM.2008.17.
- [19] Zineb Noumir, Paul Honeine and Cedric Richard , On simple one-class classification methods. 2012 IEEE International Symposium on Information Theory Proceedings.(2012) (1-4) doi:10.1109/isit.2012.6283685
- [20] Peter J. Rousseeuw and Katrien Van Driessen, A Fast Algorithm for the Minimum Covariance Determinant Estimator , Technometrics. (1999) Volume 41, doi: 10.1080/00401706.1999.10485670
- [21] Markus M Breunig,Hans-Peter Kriegel,Raymond Tak Yan Ng and Jörg Sander, Proceedings of the 2000 ACM SIGMOD international conference on Management of data. (2000) 93–104 , doi.org/10.1145/342009.335388