marginparsep has been altered.
topmargin has been altered.
marginparwidth has been altered.
marginparpush has been altered.
The page layout violates the ICML style.
Please do not change the page layout, or include packages like geometry,
savetrees, or fullpage, which change it for you.
We’re not able to reliably undo arbitrary changes to the style. Please remove
the offending package(s), or layout-changing commands and try again.
Deep Spatio-Temporal Forecasting of Electrical Vehicle Charging Demand
Anonymous Authors1
Preprint. Work in progress.
Abstract
Electric vehicles can offer a low carbon emission solution to reverse rising emission trends. However, this requires that the energy used to meet the demand is green. To meet this requirement, accurate forecasting of the charging demand is vital. Short and long-term charging demand forecasting will allow for better optimisation of the power grid and future infrastructure expansions. In this paper, we propose to use publicly available data to forecast the electric vehicle charging demand. To model the complex spatial-temporal correlations between charging stations, we argue that Temporal Graph Convolution Models are the most suitable to capture the correlations. The proposed Temporal Graph Convolutional Networks provide the most accurate forecasts for short and long-term forecasting compared with other forecasting methods.
1 Introduction
Electric Vehicles (EVs) offer lower carbon emission when compared to gasoline-powered vehicles and can reverse rising emission trends assuming a green energy mix Miotti et al. (2016); Coignard et al. (2018); Wei et al. (2021). As EV adoption increases and the charging network expands, forecasting the charging demand becomes increasingly essential for energy providers seeking to provide green energy to meet the demand Rolnick et al. (2019). Operators of EV Charging Stations (EVCS) also have a stake in the forecast as they seek to find optimal locations for expansion of the infrastructure Cheon & Kang (2017); Tao et al. (2018).
Forecasting of EV charging demand is generally well studied and explored in the literature, with methods ranging from queuing theory to machine and statistical learning Khoo et al. (2014); Xydas et al. (2016); Kim & Kim (2021); Amara-Ouali et al. (2021). Despite this interest in modelling the demand, the data used is often not publicly available. The lack of accessibility obscures results and reduces comparability. Fortunately, we find that comments on lack of real-world public data are inaccurate Kim & Kim (2021). As highlighted by Amara-Ouali et al. (2021), there exist multiple open datasets, which are still underutilized in research.
These public datasets provide sufficient data for research and forecasting. The datasets contains both diverse spatial and temporal resolutions. Prominent examples include the city of Palo Alto, U.S. which is on a dense spatial resolution with observations going back to 2011 CityofPaloAlto (2021), and the city of Perth, Scotland which spans a spatially sparse area with observations from 2016 to 2019 PerthandKinross (2020). Two other prominent datasets are from Boulder, U.S. Colorado (2020) and Dundee, Scotland CityOfDundee (2019), which again spans a different spatial and temporal resolutions. We propose to use the publicly available data from to forecast the EV charging demand.
One of the challenges in forecasting the EV charging demand is the complex spatial and temporal dependencies between EVCS Amara-Ouali et al. (2021). We argue that forecasts of EV charging demand must account for the dependencies between the stations, however, this dependence is often neglected by modelling the entire system of EVCS jointly Kim & Kim (2021). In recent years there has been increased research into Graph Convolution Network (GCN) which can handle graph-structured data Kipf & Welling (2016) and extensions that model temporal graph-structured data Zhao et al. (2020). We leverage these temporal graph convolutions to capture the complex spatio-temporal correlations of the EVCS. The use of temporal GCN is, to our knowledge, previously unexplored in the domain of EV charging demand forecasting.
2 Related work
We now provide a brief overview of related works. For a more in-depth review of current publicly available datasets and models, the reader is referred to Amara-Ouali et al. (2021) and the related work section in Kim & Kim (2021).
Temporal forecasting
Related studies can be broken down as either classical statistical or machine learning forecasting methods. The classical statistical models often providing interpretable parameters such as regression Cheon & Kang (2017) and ARIMA models Amini et al. (2016). Machine learning methods, such as random forest Majidpour et al. (2016); Lu et al. (2018) and deep learning models Chee Tat & Fränti (2018); Kim & Kim (2021), can provide higher forecast accuracy, at the expense of interpretability.
Spatio-temporal forecasting
In recent years there has been an increase in spatio-temporal forecasting with multiple methods for extraction of spatial and temporal features. Research has focused on raster maps above areas and using convolutional neural networks (CNN) LeCun et al. (2015) to extract spatial features and recurrent deep learning layers to learn temporal features Rodrigues & Pereira (2018). The convolution operators have been extended to work on non-euclidean data using using graph convolutions and graph convolutional networks (GCN) Kipf & Welling (2016). The GCN models have seen some use in forecasting the demand of EVCS in a shared fleet of EVs Luo et al. (2019). Recent research have extendedn the GCN to model temporal correlations by incorporation of recurrent deep learning layers into the GCN (T-GCN) Zhao et al. (2020).
3 Methodology
Incorporating the spatio-temporal correlations into the forecast should provide better estimates of the EV charging demand compared to methods that only consider a single charging station or all the charging stations jointly as one time-series.
Problem definition
Given the temporal signal containing the historical daily energy demand for each charging station in an area and a topology , which models the spatial correlations of the charging stations, the problem of spatio-temporal forecasting can be considered as learning a a function on topology with temporal signal .
| (1) |
where is the length of the historical signal and is the forecast horizon. can be presented through a Raster map or with a Graph, as follows.
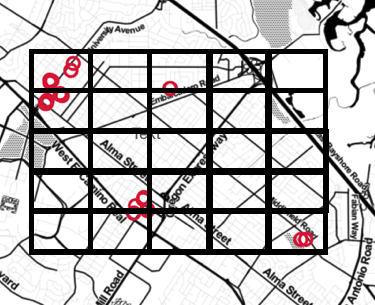
Raster-map
In this case, the topology is a grid spanning the entire area. Each grid cell then pertains to a specific spatial location in the area, and corresponds to the sum of daily energy demand for stations in the cell. The forecast using a raster map is the daily demand in each grid cell.
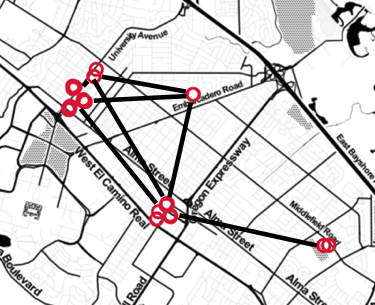
Graph
In this cases, the topology is a graph , where is the set of charging stations in the area. is the number of nodes and is the set of edges between the nodes in . The forecast is then for the daily energy demand for each individual charging station. To model the correlation between individual charging stations, the weight of an edge is computed as:
| (2) |
where and are the location of the charging stations and is the Haversine Distance in km. We can setup the adjacency matrix using Zhao et al. (2020). Stations far away from each-other is assumed to no be very correlated, which makes us set edges for large distance to be non-existent.
3.1 Modelling
For modelling the spatial and temporal features with the raster maps, a CNN can obtain spatial and temporal correlation by stacking historical raster maps in the channel dimension, making each grid cell a time-series of demand for the spatial location.
Long short term memory
As an alternative to stacking raster maps, spatial features can be extracted from each raster map using a CNN. Then each grid cell can be stacked as a time-series and propagated through a long short term memory cell (CNN+LSTM) Hochreiter & Schmidhuber (1997). The CNN and LSTM then capture the spatial and temporal features, respectively.
Temporal Graph Convolutional Network
The spatial features the CNN captures will be heavily influenced by the size of the grid cells. If the grid is sufficiently fine-grained, then the CNN captures the topological structure, but at the expense of many grid cells with zero observations. On the other hand, if the grid cells are made too large, the model will not capture the complex topological structure. Conversely, a Graph Convolutional Network (GCN) can capture the complex topological structure with graph convolutions. The GCN constructs a filter in the Fourier domain, which acts on each graph node and its first-order neighbourhood to capture spatial dependencies between nodes Kipf & Welling (2016). A 2-layered GCN model is formulated as:
| (3) |
where is the feature matrix, is the adjacency matrix, denotes a preprocessing step, is a matrix with self-connection structure, and is a degree matrix, . and are the weight matrices in the first and second layers, respectively, and , is the activation function.
The GCN extends to account for a temporal signal by combining the GCN with LSTM layers (T-GCN) Zhao et al. (2020). The key equations of the T-GCN with a LSTM cell can be summarised as follows, where is the graph convolution from Equation 3:
| (4) |
| (5) |
| (6) |
| (7) |
| (8) |
| (9) |
The matrices and contain the trainable weights, denotes the Hadamard product and and . In summary, the T-GCN models capture both the complex topological structure of the charging stations, using the GCN, and the temporal structure of the data, using the LSTM layers.
3.2 Loss function
We denote the forecasted value as and the realised value as , and aim to minimise forecast errors. The models are optimized using the mean absolute error loss and stochastic gradient descent. The networks are regularised through regularisation of the parameter, making the loss:
| (10) |
where is a tuneable hyperparameter and denotes the parameters of the models.
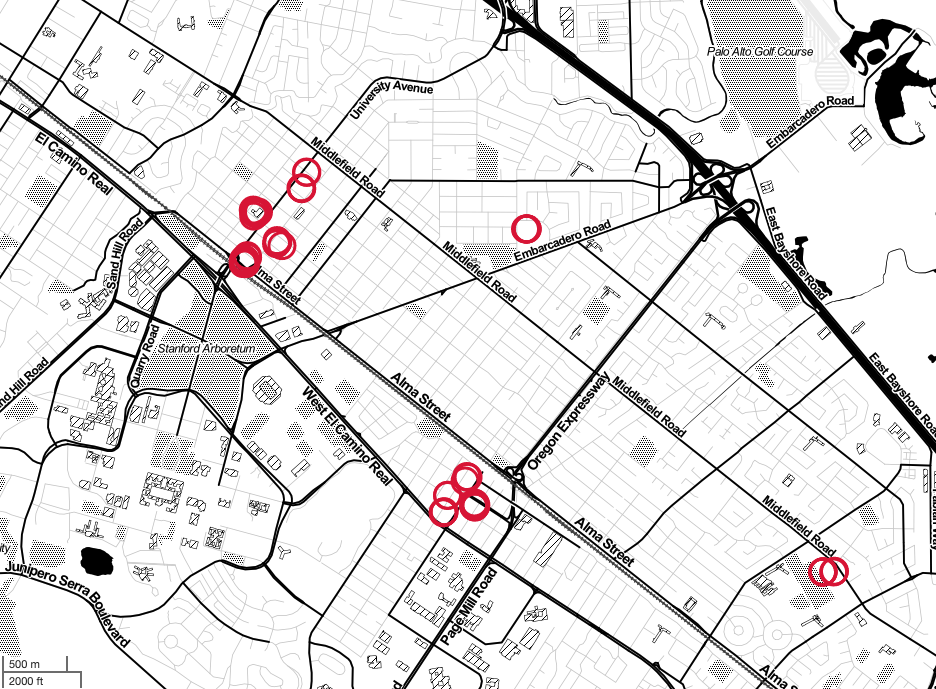
4 Data
The proposed models are empirically evaluated using data from the city of Palo Alto CityofPaloAlto (2021). The data consists of EV charging transactions at the locations depicted in Figure 2. The data set contains various meta-data on the charging transaction such as Gasoline Savings, Charging time, Plug type. The meta-data is excluded from the analysis, because it is not available for the other public datasets. We focus on using purely the energy consumption (kWh) for a transaction since this is computeable for all datasets, making the models applicable to those. The consumption is aggregated into a a daily energy demand for each of the stations in Palo Alto. For the raster map, we use a grid of and for the graph is created as explained in section 3. The data from Palo Alto is continually updated and contains data up until 2021.
5 Experiments
The models are tested on three different forecasts horizons; 1 day, 7 day and 30 day. The different horizons thus reflect various usages of the models, as follows. The long forecast horizon of 30 days can be used by EVCS operators looking to forecast usage of their system. The short horizons can be used by energy providers to plan for and optimise the dayahead energy consumption, such that they can meet the demand with clean energy. Models for the 1 and 7 day forecasts are trained using the last 30 days. For the 30 days forecast, the models use the last 120 days. The models are implemented in keras Chollet et al. (2015) and the graphs are implemented using stellar graph Data61 (2018). The CNN uses 16 kernels to forecast based on the last 30 days raster maps. The CNN+LSTM uses 16 kernels in the CNN and 50 hidden units in the LSTM. The T-GCN uses 16 and 10 filters along with 50 hidden units in the LSTM. All models are fitted using the loss in Equation 10 with and the ADAM optimiser Kingma & Ba (2014) for 1000 epochs111The code is public at Github.
5.1 Evaluation
We evaluate the models on the forecast daily energy demand for the total system, which is the sum of all the energy needed for the area. For the T-GCN model, it is the sum of the forecasts for each station. For the CNN and CNN+LSTM it is the sum for each grid cell. We compare the CNN, CNN+LSTM and T-GCN with a baseline Auto-regressive (AR) model fitted on the entire system and a baseline of a vector auto-regressive (VAR). The VAR model uses the grid cells from the raster map as inputs. Both baselines models use a model order of 30, in order to match the 30 lagged values as the deep learning model are trained with. We train the models with data between 2012 and 2019.
5.2 Experimental Results
We evaluate the models with the Root mean squared error (RMSE) across the different forecast horizons (Table 1). As can be expected, finer spatial resolution yields higher predictive quality. Since the LSTMs in both the T-GCN and the CNN+LSTM are the same, the graph convolutions are superior to convolutions at extracting features required for the forecast.
| Model | 1 day | 7 days | 30 days |
|---|---|---|---|
| AR(30) | 178 | 251 | 252 |
| VAR(30) | 189 | 203 | 201 |
| CNN | |||
| CNN+ LSTM | |||
| T-GCN |
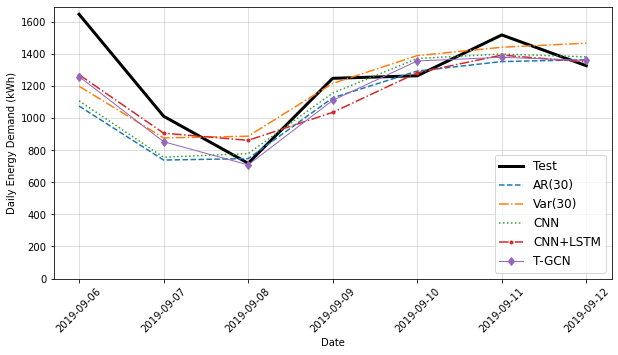
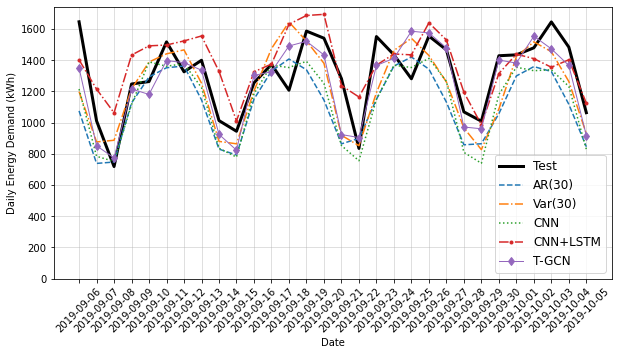
Across the different forecast horizons, the T-GCN provides the best forecasting of the models. For both the short and long term predictions, the T-GCN is showing a lower RMSE than the other proposed methods. The graph is able to capture the small difference that is present in each EVCS, as opposed to the raster map presentation, and to capture the correlations between the EVCS. Figure 3 shows the forecast for the different models. All models appear to capture the weekly patterns, where the demand is lower in the weekends, compared to weekdays.
6 Conclusion
Throughout this paper, we have argued for the use of publicly available data for forecasting the electric vehicle charging demand. Based on the experimental results, Graph Convolutional Networks have superior forecasting performance compared to other methods. In particular, we see that the Graph Convolutional Network model can capture the spatial and temporal correlations of the network of charging stations better than plain convolutional neural networks.
The models presented in this work have assumed a known expansion of the charging station network. In future work, we will incorporate dynamically evolving graphs. Further, previous research in demand forecasting has shown that the observed demand is probably censored, e.g., by the maximum capacity of the charging stations or through demand lost to competing charging services, which makes the true demand latent. There exist various ways to handle censored data which we intend to explore in future work Biganzoli et al. (2002); Greene (2005); Gammelli et al. (2020).
We hope that the results and arguments encourage researchers to use publicly available data for research into EV charging demand. In particular, we encourage researchers and stakeholders in EV charging to use Graph Convolutional Networks to forecast the electric vehicle charging demand. We believe the methods provided here can help expand the electric vehicle charging infrastructure and help reverse rising emissions trends.
References
- Amara-Ouali et al. (2021) Amara-Ouali, Y., Goude, Y., Massart, P., Poggi, J.-M., and Yan, H. A review of electric vehicle load open data and models. working paper or preprint, April 2021. URL https://hal.inria.fr/hal-03028375.
- Amini et al. (2016) Amini, M. H., Kargarian, A., and Karabasoglu, O. Arima-based decoupled time series forecasting of electric vehicle charging demand for stochastic power system operation. Electric Power Systems Research, 140:378–390, 2016. ISSN 0378-7796. doi: https://doi.org/10.1016/j.epsr.2016.06.003. URL https://www.sciencedirect.com/science/article/pii/S0378779616302115.
- Biganzoli et al. (2002) Biganzoli, E., Boracchi, P., and Marubini, E. A general framework for neural network models on censored survival data. Neural networks : the official journal of the International Neural Network Society, 15:209–18, 04 2002. doi: 10.1016/S0893-6080(01)00131-9.
- Chee Tat & Fränti (2018) Chee Tat, T. H. and Fränti, P. Real-time electric vehicle load forecast to meet timely energy dispatch. In 2018 IEEE International Conference on Service Operations and Logistics, and Informatics (SOLI), pp. 148–153, 2018. doi: 10.1109/SOLI.2018.8476758.
- Cheon & Kang (2017) Cheon, S. and Kang, S.-J. An electric power consumption analysis system for the installation of electric vehicle charging stations. Energies, 10(10), 2017. ISSN 1996-1073. doi: 10.3390/en10101534. URL https://www.mdpi.com/1996-1073/10/10/1534.
- Chollet et al. (2015) Chollet, F. et al. Keras. https://keras.io, 2015.
- CityOfDundee (2019) CityOfDundee. Electric vehicle charging sessions dundee, Mar 2019. URL https://data.dundeecity.gov.uk/dataset/ev-charging-data.
- CityofPaloAlto (2021) CityofPaloAlto. Electric vehicle charging station usage (july 2011- dec 2020). open data. city of palo alto, 2021. URL https://data.cityofpaloalto.org/dataviews/257812/electric-vehicle-charging-station-usage-july-2011-dec-2020/.
- Coignard et al. (2018) Coignard, J., Saxena, S., Greenblatt, J., and Wang, D. Clean vehicles as an enabler for a clean electricity grid. Environmental Research Letters, 13(5):054031, May 2018. doi: 10.1088/1748-9326/aabe97. URL https://doi.org/10.1088/1748-9326/aabe97.
- Colorado (2020) Colorado, B. Electric vehicle charging station energy consumption, 2020. URL https://open-data.bouldercolorado.gov/datasets/2d8bad4baf274407a674d2ed3c657951_0?orderBy=Start_Date___Time&orderByAsc=false.
- Data61 (2018) Data61, C. Stellargraph machine learning library. https://github.com/stellargraph/stellargraph, 2018.
- Gammelli et al. (2020) Gammelli, D., Peled, I., Rodrigues, F., Pacino, D., Kurtaran, H. A., and Pereira, F. C. Estimating latent demand of shared mobility through censored gaussian processes. Transportation Research Part C: Emerging Technologies, 120:102775, 2020. ISSN 0968-090X. doi: https://doi.org/10.1016/j.trc.2020.102775. URL https://www.sciencedirect.com/science/article/pii/S0968090X20306859.
- Greene (2005) Greene, W. Censored data and truncated distributions. The Palgrave Handbook of Econometrics Volume 1: Econometric Theory, 1, 02 2005. doi: 10.2139/ssrn.825845.
- Hochreiter & Schmidhuber (1997) Hochreiter, S. and Schmidhuber, J. Long short-term memory. Neural Comput., 9(8):1735–1780, November 1997. ISSN 0899-7667. doi: 10.1162/neco.1997.9.8.1735. URL https://doi.org/10.1162/neco.1997.9.8.1735.
- Khoo et al. (2014) Khoo, Y. B., Wang, C.-H., Paevere, P., and Higgins, A. Statistical modeling of electric vehicle electricity consumption in the victorian ev trial, australia. Transportation Research Part D: Transport and Environment, 32:263–277, 2014. ISSN 1361-9209. doi: https://doi.org/10.1016/j.trd.2014.08.017. URL https://www.sciencedirect.com/science/article/pii/S1361920914001187.
- Kim & Kim (2021) Kim, Y. and Kim, S. Forecasting charging demand of electric vehicles using time-series models. Energies, 14(5), 2021. ISSN 1996-1073. doi: 10.3390/en14051487. URL https://www.mdpi.com/1996-1073/14/5/1487.
- Kingma & Ba (2014) Kingma, D. P. and Ba, J. Adam: A method for stochastic optimization, 2014. URL http://arxiv.org/abs/1412.6980. cite arxiv:1412.6980Comment: Published as a conference paper at the 3rd International Conference for Learning Representations, San Diego, 2015.
- Kipf & Welling (2016) Kipf, T. N. and Welling, M. Semi-supervised classification with graph convolutional networks. CoRR, abs/1609.02907, 2016. URL http://arxiv.org/abs/1609.02907.
- LeCun et al. (2015) LeCun, Y., Bengio, Y., and Hinton, G. Deep learning. Nature, 521(7553):436–444, May 2015. ISSN 1476-4687. doi: 10.1038/nature14539. URL https://doi.org/10.1038/nature14539.
- Lu et al. (2018) Lu, Y., Li, Y., Xie, D., Wei, E., Bao, X., Chen, H., and Zhong, X. The application of improved random forest algorithm on the prediction of electric vehicle charging load. Energies, 11(11), 2018. ISSN 1996-1073. doi: 10.3390/en11113207. URL https://www.mdpi.com/1996-1073/11/11/3207.
- Luo et al. (2019) Luo, M., Wen, H., Luo, Y., Du, B., Klemmer, K., and Zhu, H. Dynamic demand prediction for expanding electric vehicle sharing systems: A graph sequence learning approach. ArXiv, abs/1903.04051, 2019.
- Majidpour et al. (2016) Majidpour, M., Qiu, C., Chu, P., Pota, H. R., and Gadh, R. Forecasting the ev charging load based on customer profile or station measurement? Applied Energy, 163:134–141, 2016. ISSN 0306-2619. doi: https://doi.org/10.1016/j.apenergy.2015.10.184. URL https://www.sciencedirect.com/science/article/pii/S0306261915014348.
- Miotti et al. (2016) Miotti, M., Supran, G. J., Kim, E. J., and Trancik, J. E. Personal vehicles evaluated against climate change mitigation targets. Environmental Science & Technology, 50(20):10795–10804, Oct 2016. ISSN 0013-936X. doi: 10.1021/acs.est.6b00177. URL https://doi.org/10.1021/acs.est.6b00177.
- PerthandKinross (2020) PerthandKinross. Electric vehicle charging station usage, Oct 2020. URL https://data.pkc.gov.uk/dataset/ev-charging-data.
- Rodrigues & Pereira (2018) Rodrigues, F. and Pereira, F. C. Beyond expectation: Deep joint mean and quantile regression for spatio-temporal problems, 2018.
- Rolnick et al. (2019) Rolnick, D., Donti, P. L., Kaack, L. H., Kochanski, K., Lacoste, A., Sankaran, K., Ross, A. S., Milojevic-Dupont, N., Jaques, N., Waldman-Brown, A., Luccioni, A., Maharaj, T., Sherwin, E. D., Mukkavilli, S. K., Körding, K. P., Gomes, C. P., Ng, A. Y., Hassabis, D., Platt, J. C., Creutzig, F., Chayes, J., and Bengio, Y. Tackling climate change with machine learning. CoRR, abs/1906.05433, 2019. URL http://arxiv.org/abs/1906.05433.
- Tao et al. (2018) Tao, Y., Huang, M., and Yang, L. Data-driven optimized layout of battery electric vehicle charging infrastructure. Energy, 150:735–744, 2018. ISSN 0360-5442. doi: https://doi.org/10.1016/j.energy.2018.03.018. URL https://www.sciencedirect.com/science/article/pii/S036054421830416X.
- Wei et al. (2021) Wei, W., Ramakrishnan, S., Needell, Z. A., and Trancik, J. E. Personal vehicle electrification and charging solutions for high-energy days. Nature Energy, 6(1):105–114, Jan 2021. ISSN 2058-7546. doi: 10.1038/s41560-020-00752-y. URL https://doi.org/10.1038/s41560-020-00752-y.
- Xydas et al. (2016) Xydas, E., Marmaras, C., Cipcigan, L., Jenkins, N., Carroll, S., and Barker, M. A data-driven approach for characterising the charging demand of electric vehicles: A uk case study. Applied Energy, 162:763–771, 01 2016. doi: 10.1016/j.apenergy.2015.10.151.
- Zhao et al. (2020) Zhao, L., Song, Y., Zhang, C., Liu, Y., Wang, P., Lin, T., Deng, M., and Li, H. T-gcn: A temporal graph convolutional network for traffic prediction. IEEE Transactions on Intelligent Transportation Systems, 21(9):3848–3858, 2020. doi: 10.1109/TITS.2019.2935152.