Coexistence of Multiple Magnetic Interactions in Oxygen Deficient V2O5 Nanoparticles
Abstract
In this paper, we report the spin glass-like coexistence of Ferromagnetic (FM), paramagnetic (PM) and antiferromagnetic (AFM) orders in oxygen deficient nanoparticles (NP). It has a chemical stoichiometry of nearly and a bandgap of nearly 2.2 eV with gap states due to significant defect density. The temperature dependent electrical conductivity and thermopower measurements clearly demonstrate a polaronic conduction mechanism of small polaron hopping with hopping energy of about 0.112 eV. The sample shows a strong field as well as temperature dependent magnetic behavior when measured using a sensitive SQUID magnetometer. It shows a positive magnetic susceptibility over the entire temperature range (2 - 350 K). The FC-ZFC data shows clear hysteresis indicating glassy behavior with dominant superparamagnetism (SPM). The Curie-Weiss fitting confirms the AFM to PM transition at nearly 280 K and the curie constant yields 1.56 which is close to single electron moment. The small polaron formation, which arises due to oxygen vacancy defects compensated by charge defects of , results in Magneto-Electronic Phase Separation (MEPS) and hence various magnetic exchanges, as predicted by first principle calculations. This is further revealed as strong hybridization of V bonded to oxygen vacancy and neighboring ions, resulting in net magnetic moment per vacancy (1.77 which is in good agreement with experiment). Besides, the rise in defects is found to show AFM component as observed from the calculations. Thus, the diversity in magnetism of undoped has its origin in defect number density as well as their random distribution led to MEPS. This involves localized spins in polarons and their FM clusters on the PM background while, dimers within and across the ladder, inducing AFM interactions. This detailed study shall advance the understanding of the diverse magnetic behavior observed in undoped non-magnetic systems.
I Introduction
The origin of ferromagnetism in otherwise non-magnetic () materials has been an intriguing question for about a few decades.[1, 2, 3, 4, 5, 6, 7, 8] Various reports have shown the existence of unexpected ferromagnetism (FM) or even other less ordered types of magnetism such as antiferromagnetism (AFM), paramagnetism (PM) and superparamagnetism (SPM) etc, in simple as well as complex oxides, nitrides which are otherwise expected to be diamagnetic (DM). the origin of the unusual magnetism was ascribed to magnetic ion dopants in host oxides, but later they were identified as vacancy defects in lattice which contribute reasonably long-range order to give ferromagnetic moment even in undoped samples at room temperature[9, 5, 10, 2, 11, 12]. Subsequently, the observations of defect induced magnetism were reported in other non-oxide systems [13, 14, 15, 16, 17] as well as recently in graphene and its analogues[18, 19, 20, 21]. However, the net concentration and distribution of these defects (vacancies) is contingent upon the processing condition, hence diverse nature of magnetic properties were reported for the same system in the literature which made it difficult to pin down the origin of this phenomenon.
Efforts were made by various researchers to induce magnetic moments or enhance the existing moment in non-magnetic oxides through doping by transition metal ions. Those have been explained through the Bound Magnetic Polaron (BMP) model where magnetic exchange happens between two polaronic sites through transition metal ions[22, 23, 24]. However, this could not be applied to undoped non-magnetic oxides since there were no magnetic impurities to mediate. Nevertheless, there seems to be a larger consensus on the defect at one of the constituent sites being responsible for this unusual magnetism in undoped systems. The transition metal oxides may show various sub-stoichiometric magnetic phases and thus a number of magnetic properties are depicted due to variable -orbital occupancy. This results in a wide variety of magnetic signatures in oxides of the same element. Nevertheless, the most stable transition metal oxides (TMO), having completely empty d orbitals (, S=0), are expected to show bulk diamagnetism because of their zero net spin e.g. vanadium pentoxide (V2O5), titanium dioxide (TiO2) etc. Among these, V2O5 is of growing interest because of its narrow bandgap (2.2 eV), suitable for visible absorption unlike other wide bandgap oxides like ZnO, SnO2, TiO2, which have been extensively studied for dilute magnetic semiconductors[9, 22, 12, 6, 25, 26]. Moreover, V2O5 has layered crystal structure and hence can be exfoliated into atomically thin layers. This has far reaching implications for 2D materials based functionalities. Nevertheless, a few studies have reported magnetic interactions, particularly in the vanadium oxide (V2O5) system. Like other oxide systems, the magnetic behaviors observed are quite diverse in this case too.[27, 28, 29, 30, 31, 32] Moreover, these studies have reported a wide range of microstructures of V2O5, such as nanotubes, nanolamellas, nanowires and nanoparticles etc.
Mesoscopic materials form an integral part of condensed matter systems and polydispersity is inherent to real materials that cannot be avoided in most generic cases even including growth of single crystals where a size distribution is inevitable. Measurements performed on such single crystals are representative of the entire batch of samples and caution should be exercised while reporting the phenomena with relevant statistical variations. Nevertheless, such statistical variations are small when reporting macroscopic or bulk properties where magnitude is large enough. In case of results pertaining to non-trivial origins such as noise, inhomogeneities, crystalline imperfections etc, the statistical variations become overwhelmingly large. Nevertheless, their macroscopic average consistently behaves in a certain fashion whose magnitude may vary from sample to sample and depending on different processing conditions. To have a complete understanding of what is the breadth of the different interactions possible, it requires to mark the limiting cases at extremes of completely homogenous vis-à-vis an absolutely inhomogeneous systems. A system which contains large inhomogenities is likely to exhibit all possible phenomena which are otherwise reported in diverse studies with limited degree of inhomogeneity in different compartments.
Investigation of the defect induced magnetism in otherwise non-magnetic oxides has led to new questions and new possible applications. [25, 26, 33] Besides, recently exfoliated two dimensional layered solids showing different physical attributes are being explored for new physics and devices [68]. However making magnetic measurements in individual 2D layers is challenging. Therefore bulk solids like V2O5 which have layered structure are interesting systems to investigate for this dual significance. This being the case, we have explored the magnetic properties of V2O5 nanoparticles, which are bulk diamagnetic.
The experimental results were analyzed in the light of first principle calculations which support the observed nature of diverse magnetic interactions. Although the BMP model is developed for magnetic impurity doped semiconductors, we find that it also applies to systems which are self-doped with magnetic ions due to charge non-stoichiometry. Further, for the first time the direct estimation of electric polarons properties have been made in the same system in addition to magnetic measurements. The results of this work demonstrates that there exists a mix of various magnetic interactions in the nanoparticles of V2O5, which are field as well as temperature dependent. Thus, it may address the origin of different magnetic phases reported in V2O5 for different processing conditions and dimensionalities.
The manifestation of inhomogeneous magnetic properties due to short range phase inhomogeneities is refereed as magnetoelectronic phase separation[34, 35]. Usually it is observed that upon carrier injection certain systems show FM clusters in non-FM matrix leading to complex magnetic behaviour as demonstrated by several systems. The examples include cobaltites ([36]), manganites ([37], [38]) etc. Notably, the transport properties of these systems has commonality of polaron hopping mechanism. Similarly in oxygen deficient one can imagine electrons doped by oxygen vacancy dopants and their polaron formation. In such case, the magnetic as well as the transport properties are governed by the site occupancy induced randomness of the dopant (defect in this case) vis-a-vis the background spin distribution. Thus we observe a cluster glass system wherein competing magnetic interactions are observed having their origin in electronic localization induces magnetoelectronic phase separated clusters.
II Experimental details
II.1 Synthesis
The precursor, NH4VO3, in powder form was heated in an alumina crucible at 500oC for about 3 hours (heating rate 10oC/min.) under ambient atmosphere, in a tube furnace. By 500oC the thermal decomposition reaction is complete and pure V2O5 was left behind in the crucible. NH3 as well as H2O are evolved as gaseous byproducts. The details of thermochemical reaction can be found elsewhere.[39]
II.2 Characterizations
The X-ray diffraction patterns were recorded on a Bruker D8 Advance diffractometer with Cu Kα source having a wavelength of 1.5418 Å. The patterns were recorded in the range 20o - 80o, with a step size of 0.02o. TEM images were obtained on a FEI transmission electron microscope with an accelerating voltage of 300 keV. The X-ray Photoelectron Spectra (XPS) and Ultraviolet Photoelectron Spectra (UPS) were obtained on an Omicron Nanotechnology XPS system with Mg Kα X-ray source (1253.6 eV) for XPS and He II source (21.2 eV) for UPS. The room temperature photoluminescence spectrum was recorded using Shamrock 303i spectrometer (Andor, Oxford Instruments) equipped with an Andor iDus 420 CCD camera for detection. The sample was excited with a 320 nm laser and the spectral resolution of measurement was about 2.5 nm. The magnetic measurements have been performed using a very sensitive Superconducting Quantum Interference Device (SQUID) magnetometer (Quantum Design, model MPMS-3) in temperature range of 2 to 350 K. The resistivity was measured in a home-built setup using four probe van der Pauw method on a pellet sample of 8 mm diameter and 2 mm thickness.
II.3 Computational details
First principle calculations based on density functional theory (DFT) were performed using the projector augmented-wave (PAW) method as implemented within the VASP (Vienna Ab-initio Simulation Package)[40, 41, 42]. Generalized Gradient approximation (GGA) with Perdew-Burke-Ernzerhof (PBE) exchange-correlation functional was used [43]. Electronic and magnetic properties of V2O5 for three cases namely pure V2O5, V2O5 with 10% O-vacancy, O-deficient V2O5 with 30 ions replaced with ions have been examined. Within the DFT+U method, Hubbard correction U was used to account for strong on-site Coulombic interactions between localized d electrons of transition metal V within Dudarev’s approach [44], where only the difference Ueff (U-J) is meaningful. Values of eV and eV were kept fixed for U and J for the V atoms. The structure optimization was done with the gamma-centred k-point mesh of for supercell calculations. Kinetic energy cut-off of eV was used for the plane-wave basis set. The lattice constants and atomic coordinates were fully relaxed with convergence criteria for total energy eV. Self-consistent calculations of charge density were done with the same k-mesh. Spin-polarized calculations to study magnetic properties were done with VASP.
III Results
III.1 Structure, size and crystallinity of nanoparticles
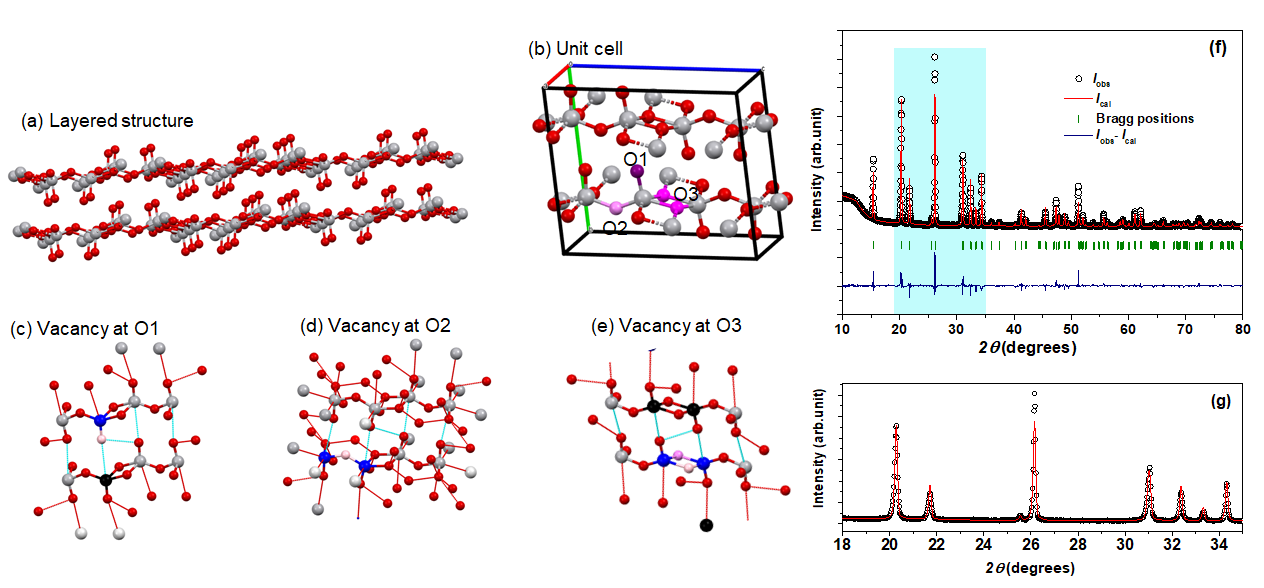
Vanadium pentoxide has a layeres structure wherein parallel sheets of atoms exist along b-axis as shown in Fig 1(a). It has an orthorhombic structure with space group and lattice parameters of a = 11.51 Å, b=3.56 Å, and c =4.33 Å as shown in Fig 1(b). As shown here, each VO5 square pyramids are slightly distorted with an apical oxygen marked as O1, while the basal oxygen ions can be identified as having one bridging oxygen (O2) and two having equivalent positions (O3). Ngamwongwan et.al.[45] studied the energetics of formation of vacancy defect at each of these sites and the corresponding effect on the band structure. It was demonstrated that the formation of a neutral vacancy at any site, acts as double ionized donor with these electrons localization of vanadium ions. Also it was shown that out of these possible sites, vacancy at O1 is major defect for V2O5 synthesized at atmospheric conditions. Besides, higher the temperature of annealing or formation, higher is the oxygen defect concentration and subsequently the carrier concentration of the solid. Nevertheless, having an oxygen vacancy at any of the site causes further lattice distortion VO5 square pyramids. Besides, the weak van der Waals bonds between the two layers (shown by broken bonds in Fig 1(c-e)) also gets affected in adjacent layers due to vacancies.
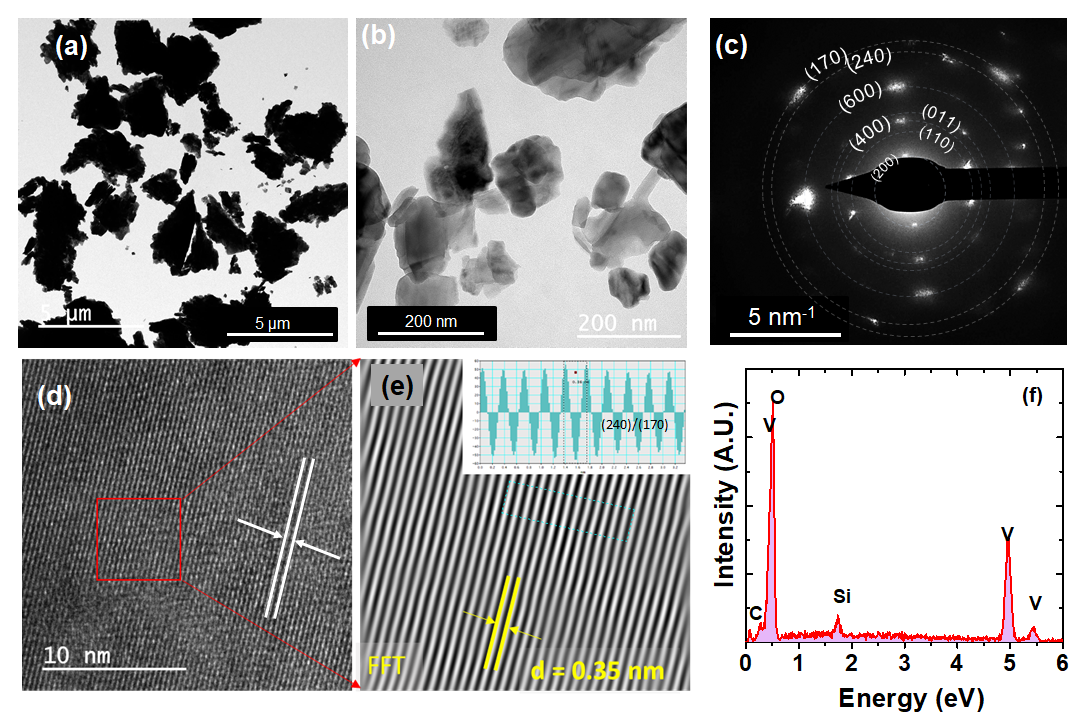
The XRD pattern collected for V2O5 is shown in Fig 2(a). The as obtained data has been analyzed using Rietveld refinement profile fitting method. The full range of the XRD pattern shows all reflections of the orthorhombic structure (JCPDS no. 60-0767). Fig 2(b) shows the magnified view of the low angle region of XRD pattern, which indicates the absence of impurity phases in the sample, seen to the best of resolution. Further, the crystallite size calculated using Scherrer formula is estimated to be about 50 nm. The size and crystallinity of the particles have been further verified with Transmission Electron Microscopy (TEM). The images obtained have been shown in Fig 2(c). It may be observed from the TEM image that the typical size of the particles seen are nearly 50 to 100 nm. As the XRD shows the lower threshold of the crystallites, these observations are in agreement with each other. Moreover, there is greater degree of agglomeration within the particles as the thermal decomposition process is more akin to producing agglomerates as opposed to solution based methods where nuclei grow into well separated particles[46]. The elemental scan using energy dispersive spectroscopy is shown in Fig 2(d) and it shows peaks of only V and O which marks the purity of the sample. The lattice fringes obtained in high resolution TEM have been analyzed using Fast Fourier Transform (FFT) and the spacing observed corresponds to (010) planes of V2O5, as marked in Fig. 2(e) and (f). Fringe separation has been measured using FFT of the fringes as shown in Fig. 2(f). The spacing of 0.36 nm is observed in V2O5. Therefore, no other impurity phases or elements have been observed in the sample.
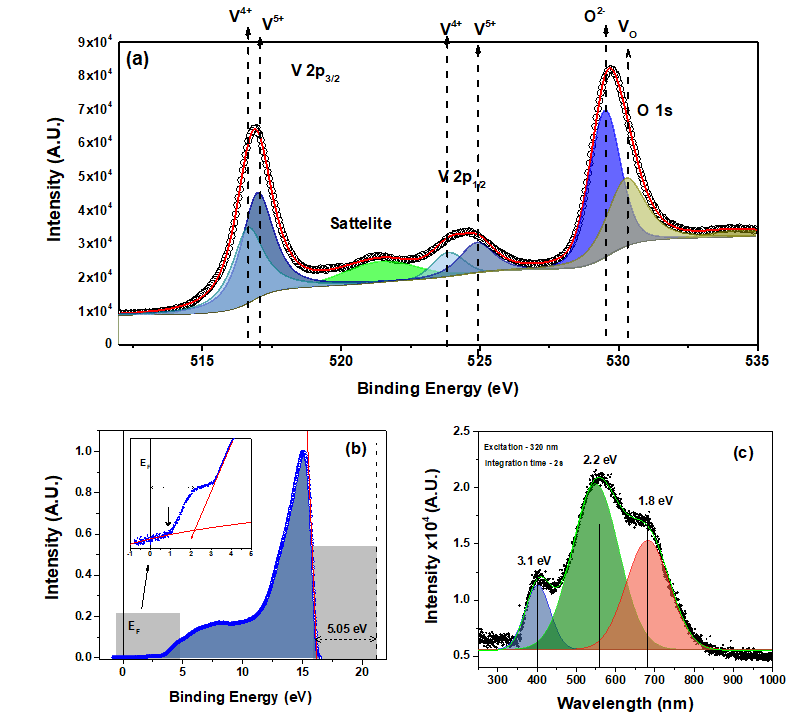
The X-ray and UV photoelectron spectra of V2O5are shown in Fig. 3(a and b). The V 2p and O 1s core levels are very close in binding energies and hence have been deconvoluted together.
The O 1s peak shows asymmetry with a higher binding energy shoulder (530.5 eV) in addition to the regular lattice O2- site peak at 529 eV. The higher binding energy peak has been ascribed to O ions in the vicinity of oxygen defects in the crystal[9]. The oxygen defects are mainly the oxygen vacancies in the V2O5 lattice, which act as donors and impart an n-type conductivity to wide bandgap oxides[13, 47]. Since XPS is a surface sensitive technique, these oxygen vacancies are mainly on the surface due to abrupt surface discontinuity in the periodicity of the lattice. Nevertheless, their relative fraction with respect to regular O 1s is significant. These oxygen vacancies are warranted by the thermodynamic stability of the lattice and their formation energy is much lower[45], which justifies their dominant nature as compared to V5+ metal ion vacancies. The V 2p peak is also found to show asymmetry due to non-stoichiometry of V ions in addition to spin orbit splitting of the 2p level into and . (See Fig 3(a)) The non-stoichiometry results in having a significant shoulder at the lower binding energy side of the V5+ characteristic peak in either multiplets. The resolved peaks have been ascribed to chemical shift due to the occurrence of V4+ substitution at V5+ sites. The presence of V4+ is warranted for charge neutrality, balancing the oxygen vacancies, i. e. lack of negatively charged ions.
| Element | V | O |
| Estimated fraction | 2 | 4.63 |
| Estimated formula | ||
| : | 39.9 : 60.1 | |
| : | 60.5 : 39.5 | |
UV photoelectron spectroscopy (UPS) was done in order to study the nature of density of states in the valence band region and estimate the work function of the sample. From the full range UPS spectra shown in Fig. 3(b), the Valence Band Maxima (VBM) has been estimated by extrapolating the rising edge to cut the line extending from the flat intensity profile at the lower binding energy. This region (0-5 eV) has been magnified in Fig. 3(b) inset, which shows the presence of a small mid gap peak, about 1 eV below the VBM, ascribable to the presence of reduced oxidation states of V i.e. V4+[13]. Nonetheless, the secondary electron cut off for the sample is at 16.05 eV. Thus, the work function calculated from UPS spectra is about 5.5 eV which matches with that of the reported values in literature[48].
Room temperature Photoluminescence (PL) spectrum of V2O5 nanoparticles is obtained by excitation with 320 nm laser. The same has been shown in Fig. 3(c) where predominantly three peaks are seen after deconvolution viz, 3.1,, 2.2 and 1.8 eV. The optical properties of vanadium pentoxide system have been studied in great details by various researchers[49, 13, 71]. All these reports clearly show that the interband opti. …cal transitions are strongly contingent upon the defect nature of the V2O5 system. Rather, the study of optical absorption and PL spectra can be used to investigate the defects in oxides. Here we observe that the room temperature PL spectrum obtained is very similar to that of non-stoichiometric V2O5 nanowires, synthesized by Wang et.al. [13], than their stoichiometric counterpart. Out of the three clear peak contributions, the central one i.e. 2.2 eV is ascribed to indirect band edge emission of V2O5. Whereas the peak at nearly 1.8 eV appears due to gap states formed as a result of oxygen vacancy defects in the oxide. These gap states are also evident from the valence band spectra shown in Fig. 3(b). The presence of oxygen defect changes the neighboring vanadium oxidation state from V5+ to V4+, as discussed in previous sections. This pair of vacancy with V4+ makes these mid-gap states. The excited electron occupies the next available state within the conduction band and hence shows a blue shifted PL emission, explained by the Moss-Burstein effect. As a result, PL emissions of energies more that 2.2 eV are also observed. This could be due to lower dispersion of V2O5, thereby allowing band filling with even small electron injection.[13, 71, 51]. The reflectance of the drop casted sample was measured and is shown in Fig. S1 in the supplementary information section. The result obtained using the Kubelka-Munk function also agrees well with that of PL spectroscopy.
While it is true that MB shift is observed in only degenerate semiconductors where carrier concentration is very high leading to population of conduction band, in this case it is observed because of two reasons: the first one is due to the low gap in the conduction band of where the minima of the conduction band is only limited for occupancy followed by a gap and then the next available states in CB. Doping in such systems can fill sizable states of this band. Secondly, because, the which is synthesized has a large oxygen vacancy defect concentration (as seen by PL) which also act as donors (polarons) thereby having large concentration. Such narrow band with high doping can result into new optical as well as magnetic effects when coupled with strong on-site coulomb potential of the partially filled d band.[70] Such MB shift has been observed earlier in doped systems or low dimensional such as nanowires having large surface defects. This is further substantiated by the observation of Le et. al., who have shown that the PL emission of 3.14 eV appears upon excitation with strong UV only for nanostructures which have high V4+ and oxygen defects.[71]
III.2 What do transport measurements reveal?
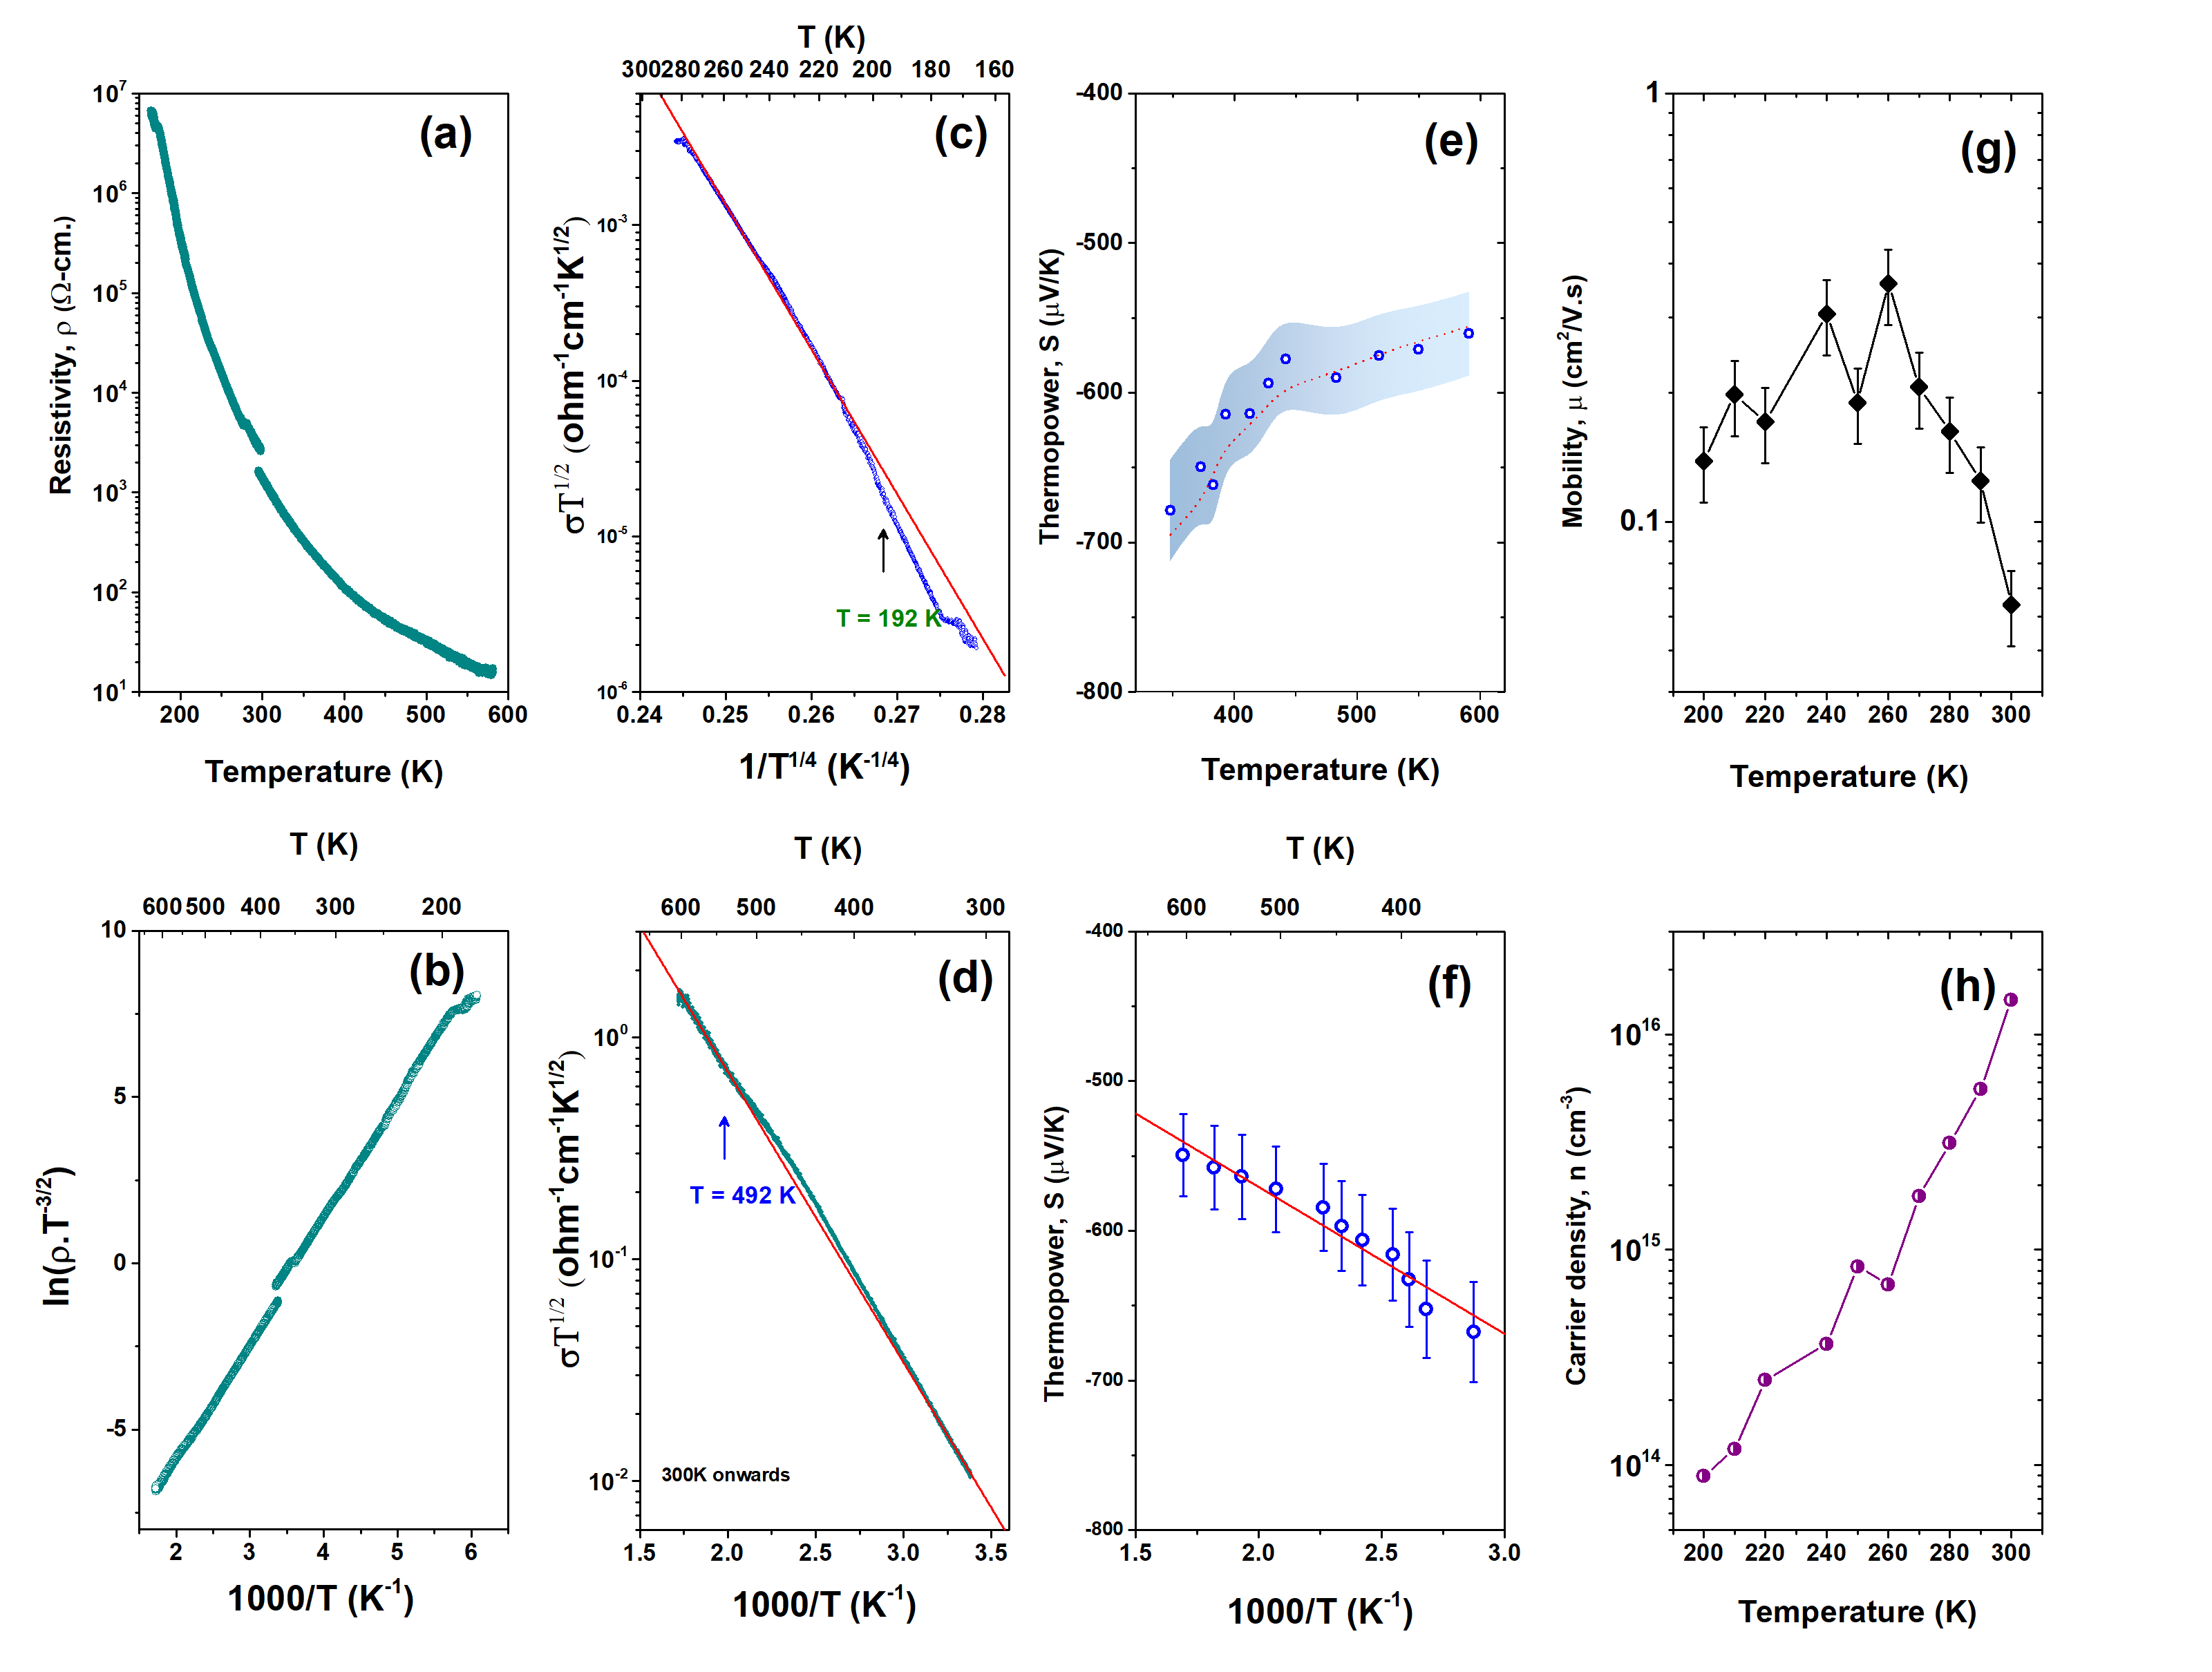
The electrical resistivity vs temperature data for the V2O5 sample is obtained using a 4-probe van der Pauw geometry, in the temperature range to K. The data reveals a semiconducting nature of the sample as the resistivity drops with increasing temperature. However when the Arrhenius plot is obtained i.e. ln vs , the activation energy of the sample turns out to be very low eV. Such a low value of thermal activation energy for a large bandgap material ( 2 eV) cannot justify the thermally activated behavior in band transport.
This apparent discrepancy and the exact nature of transport of V2O5 has been ascribed to the low lying impurity levels and is well documented in the literature [52, 53]. The charge imbalance resulting from oxygen vacancies in V2O5 is compensated by the excess electrons located on neighboring vanadium atoms, reducing them from V5+() to V4+ (). This is directly substantiated by the XPS data which indicates the significant presence of V4+ in the given sample. Nevertheless, XPS being a surface sensitive technique, those are most likely the surface defects formed as a result of surface oxygen vacancies. However, those are also likely to be present in the bulk of the nanoparticles, although in reduced concentrations balancing the net defect density. The localized charge on V4+ deforms the lattice in its vicinity and leads to the formation of a bound state of lattice distortion and a trapped electron, namely a polaron. These polarons can carry both current as well as heat as it moves within the solid. The temperature dependence of DC resistivity through the polaron hopping channel is given by,
| (1) |
where, is the activation energy of the transport. Fig 4 shows that ln vs is in very good agreement with the above equation, confirming the polaronic transport and yielding eV. Further, is constituted of and . Where is the energy required to put the charge into the polaronic site, while is the energy required to extract the charge from one polaronic site and propagate it to the next. Since all the polarons are assumed to have same energies, can be independently ascertained from the Seebeck coefficient () vs temperature data by fitting it with the equation,
| (2) |
Thus, the variation of Seebeck coefficient with temperature can be used to extract the value of . The seebeck coefficient (S) vs temperature measurement is shown in Fig. 4(b). Clearly, the vs data shown in Fig 4(f) fits very well with this expression, confirming the presence of thermal activation of charges into the polaronic sites and yielding . These values are summarized in Table 2. Thus, the polaronic hopping energy calculated in this case is eV which is in good agreement with literature for vanadium pentoxide[52, 45] and other complex oxides which also have eV.
where, is the ratio of the number of reduced transition metal ions (V4+) to the total number of standard oxidation state metal ions (V5+)in the transition metal oxide. Negative sign of Seebeck coefficient implies n-type carriers.
The Seebeck values obtained from experiments are unusually high considering V4+ ion constituents estimated from XPS as well as Eq. 3. The estimation of V4+ ions gives c at about 0.01 from S vs T. (see Fig. S2 in supporting information). Here we do understand that XPS being a surface sensitive technique, gives a surface estimation which could be different from the bulk. In nanoparticles most defects reside on surface due to uncompensated bonds and surface states. This implies that in spite of a large number of defects, only a small fraction participates in conduction.
| data | slope value | energy (eV) |
| resistivity | 3581.43 | = 0.308 |
| seebeck | 0.098 | = 0.196 |
| 0.112 | ||
Now, the polaron hopping conduction, as described by Greaves[54], actually consists of two contributors - the optical modes () and the acoustic modes (), so that
| (4) |
At higher temperatures, only the optical modes contribute to the conductivity while it is only the acoustic modes that are responsible for conductivity at lower temperatures. However, in the intermediate temperature range, contributions from both the modes exist. Fig.4(c) shows the plot of log vs in the high temperature range. In Fig. 4(d), log has been plotted against , in the low temperature range. Both the plots show good linear fit. A closer inspection of the high temperature data (Fig. 4(c)) shows that the data deviates from linearity at around 490 K. Above this temperature, acoustic modes are no longer significant. A similar deviation from linearity is observed in the low temperature data (Fig. 4(d)), at around 190 K. Below this temperature all the optical modes are quenched. In the intermediate temperature range (190 K 490 K), both the modes are present and contribute to the conductivity. All these observations are in compliance with the model proposed by Greaves in [54] and the key temperature values obtained are in good agreement with these kinds of glasses.
Thus, in the system of V2O5 having significant defect density the transport occurs through equivalent site hopping within kT of EF at low temperatures, assisted by acoustic phonon (representing bound polarons). This is characterized by a large hopping energy. While at higher temperature the slope of EF becomes flat across several KT, leading to band like conduction between one site to the other having equivalent energies due to significant lattice distortion (representing free polarons). This also leads to saturation of thermopower due to no net change in carrier potential energies during hoping at equivalent sites. The same may be observed in the carrier mobility and carrier concentration data shown in Fig 4(g) and (h) respectively. The sample shows very low carrier mobility and lower carrier concentrations below room temperature (300K). The carrier concentration quickly escalates through thermal activation, while the mobility gets adversely affected due to sudden rise in free carriers.
III.3 Do undoped V2O5 nanoparticles exhibit magnetic order?
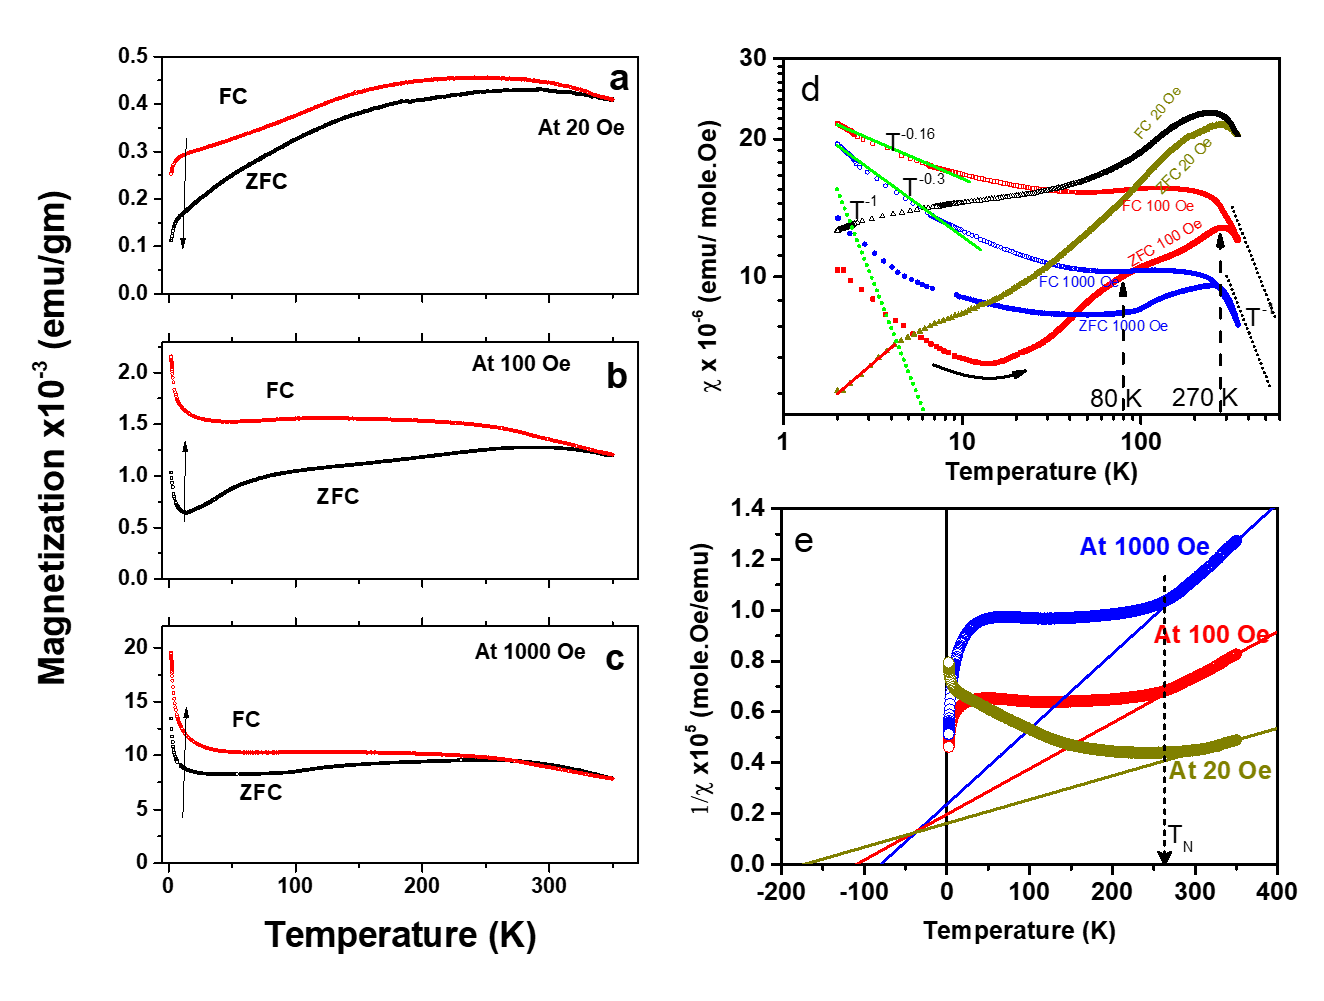
The magnetic measurements of the V2O5 sample are carried out on a sensitive SQUID magnetometer. Fig. 5 shows all the temperature dependent magnetic measurement data obtained for V2O5. The M-T measurements are done over the temperature range 2 - 350 K, in three different bias fields, 20, 100 and 1000 Oe. The Zero Field Cooled (ZFC) curves were obtained by cooling the sample in the absence of a magnetic field, up to 2 K. Subsequently, a small bias field is applied and measured in the warming cycle. Field Cooled (FC) curves were obtained by taking measurements while cooling the sample down to 2 K, under a constant bias field. The sample holder background has been subtracted from all the sample data. The M-T data resembles cases where there is a coexistence of paramagnetic (PM), ferromagnetic (FM) as well as anti-ferromagnetic (AFM) components within the same material. The FC data at 100 and 1000 Oe have a similar nature, consisting of a rising trend when cooled from room temperature (300 K), a plateau in the intermediate temperature range and again a sharp rise below 10 K. The FC data shows a rise in moment in a Curie-Weiss (CW) fashion and followed by a broad maxima as well as an upturn. These observations are similar to those observed due to the presence of short-range interactions in a glassy system[56, 57]. Towards the lowest end on the temperature scale, a PM-like exponential tail is seen which signifies the PM component of the system. The exponential decay with temperature is reminiscent of perfect PM behavior which may be attributed to superparamagnetism (SPM) given the size of the V2O5 nanoparticles (¡100 nm). Similar variations of PM with FM and glass-like FC-ZFC are found in a number of non-magnetic oxide nanoparticles [9, 22, 38, 58, 59, 60]
The irreversibility of the ZFC and FC curves reveals a spin-glass nature of the system. The gap begins to close at higher fields. That might be due to the reduced AFM phase at higher fields. Such behavior has been previously reported for manganites by Pillai et al. in [37] which also associates such behavior with the inhomogeneous mixing of FM-AFM phases. The 20 Oe curve is strikingly different in comparison to those of high field data. Nevertheless, when observed carefully it may be noted that as the field decreases (at low temperatures), M-T gradually changes slope with the field. At 1000 Oe it is exponentially decreasing with a steep negative slope, while the slope becomes less negative for 100 Oe and it becomes positive for 20 Oe. This may be interpreted as the suppression of the PM contribution as the field decreases below 100 Oe. The presence of the AFM component is further accentuated in the slowly falling nature of the ZFC curve, where two AFM components are seen, one at 270 K and the other at 80 K[37].
The DC magnetic susceptibilities are evaluated at given magnetic fields, and the same are plotted in Fig. 5(d). The gradual change in trend with temperature, as mentioned above, is clearly observed in the case of magnetic susceptibilities (), shown in Fig 5(d). The temperature dependence systematically reduces exponent as H increases as shown with green dashed lines. The departure between FC-ZFC is maximum for 100 Oe field, which is intermediate of low (20 Oe) and high (1000 Oe) fields, demarcated in this study, where the susceptibility of the FM centers is gradually surpassed by that of the PM centers and going through a maximum glassy nature in between.
| (5) |
A Curie-Weiss (CW) fit (Eq. 5) is attempted on the high temperature region of the vs T plot, as can be seen in Fig. 5(e), in order to ascertain the nature of the various magnetic phases predicted in the system. However, the CW extrapolation lines in the high temperature region, yield negative intercepts on the temperature axis indicating an antiferromagentic (AFM) ordering. Further, the value of CW temperature () decreases as the applied field increases. This could be extrapolated as as H increases (purely PM at high fields). Nevertheless, the apparent Neel temperature is nearly the same irrespective of field i.e. 260 K. Similar AFM ordering has been observed by Dhoundiyal et.al. [61] and Dreifus et.al. [62]. However, the Neel temperatures reported are quite different (50 K [61] and 80 K [62] respectively). These AFM interactions may result from V4+ ions, which has been reported in the literature[63, 64]. However, as discussed earlier, the concentration and relative proximity of V4+ ions depend on that of the oxygen vacancies which is predominantly governed by the processing conditions as well as microstructures, which are different in these cases. A strong deviation of CW fit for low field values indicates the presence of short range clusters of FM in AFM or vice versa in glassy systems [56, 57]. Thus, the deviation from CW fit observed for low field (20 and 100 Oe) points towards such short range FM clusters in the AFM matrix.
The effective moment is deduced from the Curie constant using the eq 6,
| (6) |
where N is avagadro’s number, is bohr magneton and C is curie constant deduced from CW plot whose value has been found to change with field. However, as can be seen in Fig 5(b), the 1000 Oe field data shows clear signature of linear behaviour at high temperature, considering that Curie constant value of 0.31 K.emu/mole(of V).Oe which gives and effective moment of 1.56 which is close to 1.72, a value obtained by single unpaired electron (S=1/2).
The observations from the M-T data are corroborated by the M-H isotherms, obtained at three different temperatures, 2, 100, 300 K. The PM component at high field becomes more prominent as temperature decreases. The high temperature isotherms are more or less like FM, with a prominent hysteresis loop and saturation, overlaid with a small positive slope, which might come from both PM and AFM components in the system. However, at 2 K the PM component completely overshadows the FM loop, as expected from the M-T data. However, clearly FM has been found to persist all the way from 2 K to 300 K, as depicted from a centered hysteresis loop.
Thus far a mixed FM-AFM-PM state is observed where FM dominates at low fields (depicted by hysteresis loops) and high temperatures, while PM dominates at low temperatures (¡ 10 K) and high fields (as seen by linear rise of M-H). At the intersection i.e. low temperature, low fields the system behaves like superparamagnetic single domain particles. However, a system at low temperature PM phase turning into a FM at high temperature is unlikely hence all the components must have a coexistence where the measurements manifests its behavior depending on relative strength of magnetic susceptibilities. There could be a wider PM background with short range clusters of FM and AFM which reveal depending on temperature and field and also converts to PM when heated beyond 350 K. The complete picture of proposed coexisting phases has been summarised in Table III.3.
| 20 | 20-250 | 250 | |
| 20 | SPM + AFM | FM + AFM | FM +PM |
| 100 | SPM + AFM | FM + AFM | FM +PM |
| 1000 | PM + AFM | PM +AFM | PM |
In order to confirm the PM and FM contributions, and estimate the moment in the low temperature the M-H data is fitted with the Brillouin and Langevin function, as shown in Eq. 8 and 7.
| (7) |
where, , J is the magnitude of the exchange interaction. As J , the Brillouin function tends to the Langevin.
| (8) |
where, N is number of magnetic centers (ions or spins) per unit volume. The data is converted from emu/mole to per formula unit (FU). is the total moment carried by each ion/spin (), is boltzmann constant and T is absolute temperature. The attempts were made for fitting the data with Brillouin function but it could not be fit satisfactorily. The Brillouin function (shown above in eq 7) fitting for the same data did not converge and the fitting having best goodness of fit showed very low total J value( , see supporting information Fig S5). The results of fit can be found in supplementary material Fig S4 and S5. Although the fitting was attempted at all of the three different temperatures, only 2 K data gave physically reliable fitting parameters i.e. and N which are summarized in Table 4. In order to get a perfect fit, an additional H term was required along with the Langevin function (8), which marks the background susceptibility.
| T | , moment per | N, No of magnetic | No of FU contributing |
| (K) | magnetic center() | centers (per FU) | single Spin |
| 2 | 5.65 | 1.3 | 7520 |
| 100 | 13.4 | 5.22 | 2 |
| 300 | 31.25 | 2.1 | 5 |
As can be seen from Table 4, the value of obtained for 2 K fitting is although higher side but fairly reasonable whereas those of the high temperature are unusually large and hence unreliable(See the supporting material, Fig S4). Nevertheless, the 2 K data predicts that there is a moment of 5.6 and about 7520 formula units make up a single spin unlike traditional magnetism where half integral multiple spins are contributed by unique magnetic ions in the lattice. If this the case, this could be due to the delocalization of vacancy contributed unpaired electrons having an unpaired spin as discussed in the polaron model. Eq. 8 has been used to fit the M-H curve at 2 K. It consists of two parts - one is the Langevin function and the other is a simple paramagnetic H term. It has been used because a single Langevin function couldn’t successfully fit the entire data, especially the un-saturating part of the data. Besides, the reason why Langevin may have work better than Brillouin (as J ) is at this temperature (2 K) most of the particles behaves like single domain ferromagnets i.e. superparamagnetism. In addition, the average distances among the magnetic spins is fairly large yielding a weak exchange (lower J). Thus, the Langevin fit worked and yielded a value of moment (5.65 ). Nevertheless, the number of electrons which may have contributed to give rise to such moment cannot be estimated conclusively and needs further investigations. However, the PM dominates at 2 K as is evident from the -T curves (Fig. 5(d)). At low temperatures, the paramagnetic component heavily dominates over every other magnetic phase in the sample. The exact origin of each of the magnetic contributions needs to be confirmed further hence we perform first principle calculations which are discussed in the next section.
III.4 Predictions from first principle calculations
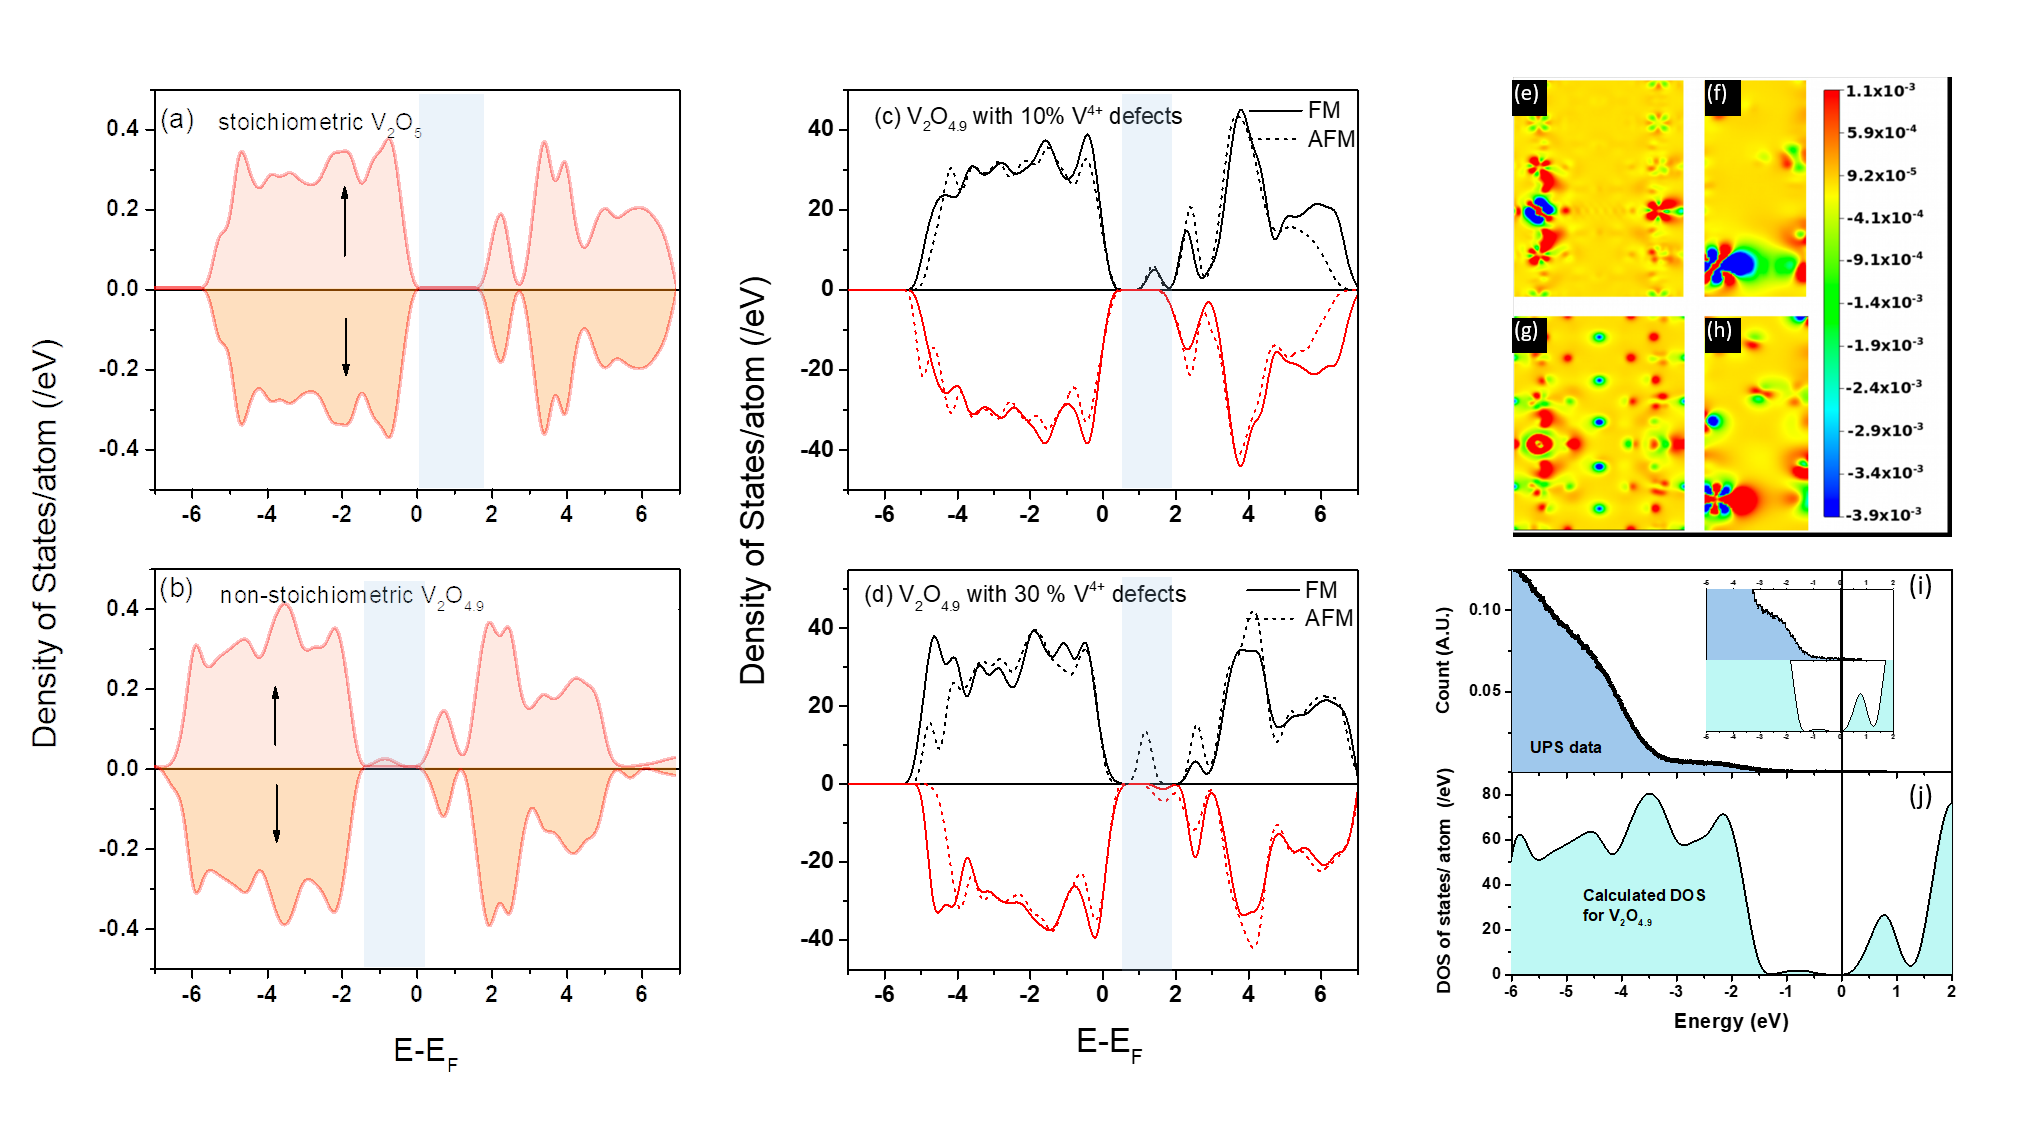
In order to estimate the origin of different magnetic contributions, the first principle calculations are performed using a supercell of vanadium pentoxide lattice stoichiometric V2O5. Further, an oxygen vacancy is created in this supercell. The stoichiometric V2O5 is known to be a diamagnetic semiconductor[65, 66], which is also verified in our study from electronic and magnetic calculations. Spin-polarized calculations result in zero value of magnetic moment on all the atoms indicating diamagnetic state of V2O5. The total density of states (DOS) plot as shown in Fig. 7(a) exhibits semiconducting properties with a band gap of eV between valence and conduction band calculated using PBE functional (shown in blue band). The HSE06 functional were also performed and those resulted in overestimation of the band gap to 3.6 eV.(see figure S6 in supporting materials section). Nevertheless, the PBE results are in good agreement with those reported earlier.[71]
| Total magnetic | E | |
| moment per vacancy | ||
| (/vacancy) | (eV/vacancy) | |
| Pure V2O5 | 0 | - |
| V2O5 with O-vacancy | 1.775 | -0.788 (FM) |
| O-deficient V2O5 with 10% charged defect | 0.818 | -0.382 (AFM) -0.383(FM) |
|---|---|---|
| O-deficient V2O5 with 30% charged defect | 3.959 | -3.277(AFM) -3.273(FM) |
Electronic and magnetic properties calculations were done of V2O5 by introducing 10% oxygen vacancies in the perfect crystal structure. Spin-polarized calculations indicate magnetic moment induced on V atom bonded to the site of oxygen vacancy as well as a small magnetic moment induced on oxygen atoms nearby to the vacancy-site giving net magnetic moment 1.775 per unit cell per vacancy. Total energy calculations to determine ground-state magnetic ordering stabilizes the ferromagnetic solution. The energy difference E (in eV) between magnetic and non-magnetic states as well as total magnetic moment (in ) values per vacancy are listed in Table 5. Electronic spin-polarized DOS plot in ferromagnetic state shown in Fig. 7(b) with PBE functionals, clearly emanates that the band gap value for V2O5 with O-vacancy estimated at 1.9 eV is closer to the experimentally determined value of 2.2 eV. In case of HSE calculations the value obtained is also large (greater than 3eV).
The electronic and magnetic properties for the case of O-deficient V2O5 in which 10% and 30% fraction of ions have been replaced with ions (as charge compensatory defect) were investigated. The spin-polarized calculations stipulate that the induced magnetic moment on the V atom bonded to the vacancy-site due to oxygen vacancies is reduced when ions are replaced with ions. Also, moments on V atoms align antiferromagnetically as well as small magnetic moment induced on O atoms as depicted by the total magnetic moment value 0.818 and 3.959 for 10% and 30% fraction of ions respectively as shown in Table 5. Further, as shown in Fig. 7(c), the estimated DOS for the case of O-deficient V2O5 with 10 as well as 30% charged defect reveals metallic behaviour with fermi level trapped inside the valence band. HSE calculations yield similar behaviour to the case of PBE calculations. There is very small change in FM and AFM DOS for both charged defect case due to robust local magnetic configuration of V atom bonded to the site of O vacancy with the magnetic configuration of the system [72]. However, It should be noted that the DOS of charged defect may be less accurate due to non localized extra electron in the system. We also performed spin-polarized calculations for the 10% charged defect in O-deficient V2O5, in which case, the ferromagnetic ordering was found to have lowest energy. The corresponding energy values are listed in table 5. Adding charged defects only helps in explaining AFM contribution i.e. AFM increases as V4+ goes from 10% to 30 %. The moment value of obtained for only oxygen deficient case is 1.77 which is close to a single electron (S=1/2) as estimated from Curie constant value.
The calculated DOS using PBS for crystal having oxygen vacancies has been compared with that of UV photoelectron spectrum (UPS) which gives local DOS below Fermi level. It may be observed from Fig 7(i and j), there is a very good correlation observed in that of calculated and experimental spectra which denotes the experimental validity of results. It is clear that in spite of presence of surface defects, the electronic band structure does not concur with its simulated band structure for measured defect densities. Hence the contribution of such defect is minimal in deciding the electronic energies. Besides, the amount of charged defect contributing (10 or 30 %) cannot be large here as by finite tempertaures the thermal activation helps bound polarons to become free, resulting in more delocalised electrons[69]. Tt is also seen from the transport measurements that temeprature dependance of conductivity becomes band like (1/T). Whereas, the thermopower measurements and Heike’s formula tells us that effective / ratio should be one in thousand or lower. (see supplementary material Fig S2). Thus, only a small fraction of charged defects lead to polaronic states. Others may contribute to the paramagnetic background. Therefore, none of those DOS for charged defects matched observed UPS. The electronic band structure is governed by metal and O characters of the bands and the mid gap states arise as a result of oxygen deficiencies. These mid gap state are characteristics of polarons in (like other polaronic solids)[69].
IV Discussion
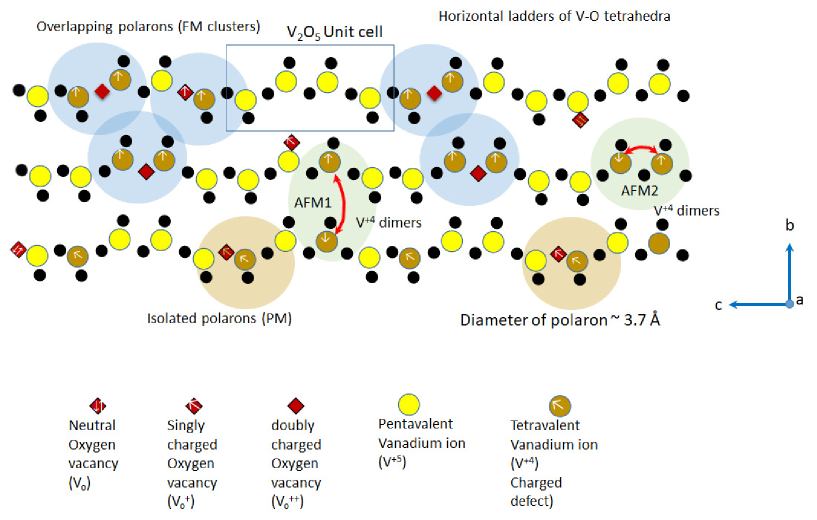
Although bulk V2O5 is diamagnetic in nature, experimental magnetic measurements conducted on the oxygen deficient nanoparticles showed a large variation in the observations ranging from ferromagnetism[27, 32, 29], antiferromagnetism[62] and to a mixture of both[28, 30]. While first principles calculations performed by Xiao et.al.[31] predicted that the V2O5 system may have vacancy induced ferromagnetism if the x-value lies within 0.19 to 0.45 or below 0.13. However, through it shall also exhibit an antiferromagnetic coupling (AFM-1 shown in Fig 8) because of anti-parallel coupling of V4+ spins on adjacent ladders, (often referred to as dimers[28]). Besides, at the , another AFM coupling (AFM-2 shown in Fig 8) may arise due to anti-parallel coupling of V4+ spins on adjacent rungs of the ladder. For low vacancy concentrations (and low V4+ defects) the electronic structure remains similar to that of bulk V2O5-x, while for large oxygen vacancy concentrations the electronic structure may exhibit a significant change as also confirmed by our calculations. Thus, we envisage that the electronic structure of our sample is likely to be similar to that of oxygen deficient V2O5-x with trace amount of V4+ defects present. This can be readily confirmed upon comparison of the UPS spectrum of our sample with the calculated DOS in Fig. 7(i-j), which shows very good agreement. Besides, the value for our sample (0.35), as calculated from the XPS data, legitimizes the presence of a combination of both FM and AFM phases in it (both AFM-1 as well as AFM-2). This is seen as the AFM to PM transition at about 280 K in the Curie Weiss plot shown in Fig. 5(b). Here V4+ introduces the AFM interaction and increases with increasing its amount as seen from the calculations.
Bhandari et.al. [51] investigated the effect of electron doping on electronic and magnetic properties of . Here they employed several strategies to dope system with electrons, such as varying the effective atomic numbers and interacalation of alkali metal within the layers of . Similar electron doping occurs when the system is doped with oxygen vacancies such as in this case. Wherein the generalized Heisenberg Hamiltonian used is of the form,
Counting the spin on each non-equivalent vanadium atom of the two parallel rungs twice. The interaction , , were identified among the nearest neighbor vanadium ions and the net spin was found to be 0.5 on each vanadium ion due to excess of electrons distributed over all the vanadium atoms effectively rather than electron localization on defect. The energies difference calculated between FM and AFM shows that below a particular electron concentration of 0.88 electrons per vanadium atom shows strong FM while on exceeding this it tends to show AFM dominance. The maximum exchange coupling of 44.8 meV is observed between two parallel rugs of ladder with an electron delocalised over each of them. i.e. same electron shared by two vanadium atoms of the same rug of the latter (making unit cell) (See Fig 8) and hence having the same spin. Whereas the j-values of other two non-equivalent sites predicted are = -4.5 meV and = -2.1 meV. Thus, quoting from Bhandari et. al. [51] The nature of both the interactions are antiferromagnetic. They reduce significantly as distance increases. This is an indication of neighboring chains coupling antiferromagnetically and the within chain ordering is also antiferromagnetic. This has been marked in Fig 8 as AFM1 and AFM2.
It is perhaps wiser to examine the polaronic signature observed in the electrical transport studies and the concurrently observed magnetic behavior, due to their common origin from an oxygen vacancy paired with a V4+ defect. An oxygen vacancy can be neutral (VO) or singly charged (V) or doubly charged (V) making shallow and deep donors. Most of existing literature has apparently overlooked or only marginally discussed this under the umbrella of bound magnetic polarons (BMP), without any reference to their electrical contributions. The problem of polaronic conduction and its energetics has been a question of interest for a long time. Sanchez et.al.[53] in their paper published in 1982 showed a remarkable correlation between DC electrical conductivity and Electron Spin Resonance (ESR) experiments, to establish the mechanism of polaronic conduction in the V2O5 system. The study clearly revealed that there exists a coupling between the unpaired electron of V4+ and an associated oxygen defect. The electron may be localized on equivalent V5+ ions in the vicinity of the defect (as shown by the blue / brown shaded circle in Fig 8). Nevertheless, this polaron is a small polaron which could be localized near the defect (i.e. bound polaron) or it could be delocalized (free polaron) when thermally activated with sufficient activation energy of about 0.2 eV, leading to increased conductivity. Thus the electrical conductivity quickly escalates as the polaron hopping is enabled with sufficient thermal activation. The activation energies mentioned by Sanchez et.al.[53] are in very good agreement with those calculated in this study.
This system can be considered as equivalent to a semiconductor self-doped with trace transition metal (V4+) impurities similar to described in reference [23]. As mentioned earlier, at low temperatures the polarons are bound and the unpaired electrons are localised near the defects. These being small polarons, they are reasonably near, yet isolated from each other. The calculated radius of a small polaron (1.84 Å) is a good indicator of this. Isolated polarons are distributed throughout the space and can contribute to the paramagnetic background, which decreases sharply with temperature. The bounded electrons, confined in polaronic states in their vicinity, may show a direct ferromagnetic exchange, referred to as polaron-polaron interaction. However, their separation distances may play a key role in deciding the dominant interactions (See Fig 8). The background semiconductor matrix may meanwhile have a carrier-carrier antiferromagnetic interaction from ions.
As predicted by Durst et.al.[23], the susceptibility variation shown in Fig. S7, in the temperature of interest, shows a dual magnetization mechanism i.e. low field involving polaron-polaron interaction which could induce direct ferromagnetic exchange. Whereas high field isolated polarons and among the magnetic ions, if any. While the linear slope at high field ( Oe) results from paramagnetic spin alignments.
Owing to the nano-sized nature of the particles additional effects may be expected, such as superparamagnetism from the core of particles (domains), as observed here. Besides, the inter-granular dipoles may contribute to the paramagnetic background. Further, due to orientational anisotropy of the particles, the relative orientation of the easy axis with the field shall have a precision contributing to spin flip distribution (abrupt along easy axis and gradual perpendicular to the easy axis).
Subsequently, at high temperatures, as the polarons become free by thermal activation, long range correlations are enabled. These polaron-polaron correlations observed at low temperatures and low fields, are disturbed, resulting in gradually vanishing magnetism at high temperatures. Nevertheless, at high temperatures, a weak ferromagnetic hysteresis at 300 K, suggests the existence of short range FM clusters, which could be primarily due to the dilute magnetism.
Thus, we have a tentative picture of the competing processes that are present in the system and how they contribute to the magnetic data. Fig. 8 is a pictorial representation of that. There are V4+ ions besides V5+ ions in the material. The O-vacancies capture electrons in them and they hybridize with the d-orbital of the nearby V4+ ions to form polarons. Polarons can be thought of as large bubbles containing spins, spanning several formula units (FU). Hence isolated polarons will have a paramagnetic moment. When they come close enough, they can overlap and give rise to FM or AFM. As in the sample, all these polarons and V4+ ions are distributed at random, and depending on the spacing between them, RKKY interaction decides if the coupling will be FM or AFM. Hence there is an inherent randomness and competing interactions within the system and it is conducive to spin-glass behavior, which might be the reason for the split in the FC-ZFC curves. For confirmation, AC susceptibility measurements are required.
V Conclusion
The study of the magnetic properties of otherwise bulk diamagnetic vanadium pentoxide reveals the significance of oxygen vacancies and vanadium ion charge stoichiometry in imparting magnetic moment to the sample. The electrical transport studies reveal a polaronic hopping mechanism due to the presence of oxygen vacancies and charged vanadium defects. The oxygen defects are well corroborated with optical absorption studies which show an optical bandgap of 2.2 eV. Besides, significant optical emissions are observed at 1.8 eV and 3.1 eV due to gap states resulting from oxygen defects and Moss-Burstein effect due to the split in the conduction band of V2O5. Electrical resistivity and Seebeck coefficient show the polaron hopping mechanism with a hopping energy of 0.112 eV. The radius of the polarons is estimated to be 1.8 Å. Polaron binding energy of 0.287 eV confirms the possibility of long range hopping at sufficiently high temperatures causing a transition from bound to free polarons, thereby improving the electrical conductivity at higher temperatures. Electronic and magnetic calculations for three cases of pure V2O5, V2O5 with 10% O-vacancy, O-deficient V2O5 with 10 and 30% V5+ ions replaced with V4+ ions have been studied theoretically. Whereas, pure V2O5 is a diamagnetic semiconductor, V2O5 with 10% O-vacancy is a ferromagnetic semiconductor. On introducing charged defects, V2O5 with 10% O-vacancy is found to be antiferromagnetic metal. Thus it is proposed that vanadium charged defects are in dilute limit which induced antiferromagnetism within dimers but no changes in the band structure. Experimental observations are in good agreement with the predictions of first principles calculations. It shows a ferromagnetic ordering for low temperatures which is attributed to polaron - polaron interactions at low fields and isolated spin alignments at high fields. Nevertheless, there also exists antiferromagnetic contributions to the magnetic signals, due to vanadium dimers across the ladders in the crystal structure of V2O5. For that further analysis and time dependent measurements are required, like AC susceptibility and temperature dependent EPR spectra.
Acknowledgements
The authors are grateful to the institute SQUID magnetometer facility of IISER Thiruvananthapuram for the magnetic measurements and Dr Deepshikha Jaiswal-Nagar, Dr Tuhin S Maity, Mr Waseem for their help and Support during the magnetic measurements. The funding received from Science and Engineering Board (SERB), Government of India for the research grant (EEQ/2018/000769) supporting this work, is gratefully acknowledged.
References
- [1] JMD Coey. ferromagnetism. Solid State Sciences, 7(6):660–667, 2005.
- [2] JMD Coey, P Stamenov, RD Gunning, M Venkatesan, and K Paul. Ferromagnetism in defect-ridden oxides and related materials. New Journal of Physics, 12(5):053025, 2010.
- [3] Jacek K Furdyna. Diluted magnetic semiconductors. Journal of Applied Physics, 64(4):R29–R64, 1988.
- [4] Nguyen Hoa Hong, Joe Sakai, Nathalie Poirot, and Virginie Brizé. Room-temperature ferromagnetism observed in undoped semiconducting and insulating oxide thin films. Physical Review B, 73(13):132404, 2006.
- [5] Nguyen Hoa Hong, Joe Sakai, Ngo Thu Huong, Nathalie Poirot, and Antoine Ruyter. Role of defects in tuning ferromagnetism in diluted magnetic oxide thin films. Physical Review B, 72(4):045336, 2005.
- [6] Nguyen Hoa Hong, Joe Sakai, and Francois Gervais. Magnetism due to oxygen vacancies and/or defects in undoped semiconducting and insulating oxide thin films. Journal of magnetism and magnetic materials, 316(2):214–217, 2007.
- [7] Malcolm P. Kennett, Mona Berciu, and R. N. Bhatt. Two-component approach for thermodynamic properties in diluted magnetic semiconductors. Phys. Rev. B, 65:115308, Feb 2002.
- [8] PA Wolff, RN Bhatt, and AC Durst. Polaron-polaron interactions in diluted magnetic semiconductors. Journal of Applied Physics, 79(8):5196–5198, 1996.
- [9] Vinayak B Kamble, SV Bhat, and AM Umarji. Investigating thermal stability of structural defects and its effect on d0 ferromagnetism in undoped . Journal of Applied Physics, 113(24):244307, 2013.
- [10] David W Abraham, Martin M Frank, and Supratik Guha. Absence of magnetism in hafnium oxide films. Applied Physics Letters, 87(25):252502, 2005.
- [11] V Fernandes, RJO Mossanek, P Schio, JJ Klein, AJA De Oliveira, WA Ortiz, N Mattoso, J Varalda, WH Schreiner, M Abbate, et al. Dilute-defect magnetism: Origin of magnetism in nanocrystalline . Physical Review B, 80(3):035202, 2009.
- [12] A. Sundaresan, R. Bhargavi, N. Rangarajan, U. Siddesh, and C. N. R. Rao. Ferromagnetism as a universal feature of nanoparticles of the otherwise nonmagnetic oxides. Phys. Rev. B, 74:161306, Oct 2006.
- [13] Qi Wang, Mathew Brier, Siddharth Joshi, Ajinkya Puntambekar, and Vidhya Chakrapani. Defect-induced burstein-moss shift in reduced nanostructures. Phys Rev B, 94(24):245305, 2016.
- [14] You Lai, Liqin Ke, Jiaqiang Yan, Ross D. McDonald, and Robert J. McQueeney. Defect-driven ferrimagnetism and hidden magnetization in . Phys. Rev. B, 103:184429, May 2021.
- [15] Matheus P. Lima, L. Cabral, Emanuela Margapoti, Suddhasatta Mahapatra, Juarez L. F. Da Silva, Fabian Hartmann, Sven Höfling, Gilmar E. Marques, and Victor Lopez-Richard. Defect-induced magnetism in ii-vi quantum dots. Phys. Rev. B, 99:014424, Jan 2019.
- [16] Mathias Bersweiler, Evelyn Pratami Sinaga, Inma Peral, Nozomu Adachi, Philipp Bender, Nina-Juliane Steinke, Elliot Paul Gilbert, Yoshikazu Todaka, Andreas Michels, and Yojiro Oba. Revealing defect-induced spin disorder in nanocrystalline . Phys. Rev. Materials, 5:044409, Apr 2021.
- [17] Suhas Nahas, Biplab Sanyal, and Annica M. Black-Schaffer. Spontaneous ferromagnetism and finite surface energy gap in the topological insulator from surface antisite defects. Phys. Rev. B, 102:140407, Oct 2020.
- [18] Oleg V. Yazyev and Lothar Helm. Defect-induced magnetism in graphene. Phys. Rev. B, 75:125408, Mar 2007.
- [19] Elton JG Santos, Andrés Ayuela, and Daniel Sánchez-Portal. Universal magnetic properties of -type defects in covalently functionalized graphene. New Journal of Physics, 14(4):043022, 2012.
- [20] Ahmet Avsar, Cheol-Yeon Cheon, Michele Pizzochero, Mukesh Tripathi, Alberto Ciarrocchi, Oleg V Yazyev, and Andras Kis. Probing magnetism in atomically thin semiconducting . Nature communications, 11(1):1–7, 2020.
- [21] Antal A Koos, Peter Vancso, Marton Szendro, Gergely Dobrik, David Antognini Silva, Zakhar I Popov, Pavel B Sorokin, Luc Henrard, Chanyong Hwang, Laszlo P Biro, et al. Influence of native defects on the electronic and magnetic properties of cvd grown single layers. The Journal of Physical Chemistry C, 123(40):24855–24864, 2019.
- [22] Kusuma URS, SV Bhat, and Vinayak Kamble. On exceeding the solubility limit of dopants in nanoparticles based dilute magnetic semiconductors. Journal of Applied Physics, 123(16):161518, 2018.
- [23] Adam C. Durst, R. N. Bhatt, and P. A. Wolff. Bound magnetic polaron interactions in insulating doped diluted magnetic semiconductors. Phys. Rev. B, 65:235205, Jun 2002.
- [24] Jian-Yun Zheng, Shan-Hu Bao, Yan-Hong Lv, and Ping Jin. Activation and enhancement of room-temperature ferromagnetism in -doped anatase films by bound magnetic polaron and oxygen defects. ACS applied materials & interfaces, 6(24):22243–22249, 2014.
- [25] Pablo David Esquinazi, Wolfram Hergert, Markus Stiller, Lukas Botsch, Hendrik Ohldag, Daniel Spemann, Martin Hoffmann, Waheed A Adeagbo, Angelika Chassé, Sanjeev K Nayak, et al. Defect-induced magnetism in nonmagnetic oxides: Basic principles, experimental evidence, and possible devices with zno and . physica status solidi (b), 257(7):1900623, 2020.
- [26] Shuai Ning, Peng Zhan, Qian Xie, Weipeng Wang, and Zhengjun Zhang. Defects-driven ferromagnetism in undoped dilute magnetic oxides: a review. Journal of Materials Science & Technology, 31(10):969–978, 2015.
- [27] Manas R Parida, C Vijayan, Chandra Sekhar Rout, CS Suchand Sandeep, Reji Philip, and PC Deshmukh. Room temperature ferromagnetism and optical limiting in nanoflowers synthesized by a novel method. The Journal of Physical Chemistry C, 115(1):112–117, 2011.
- [28] E. Vavilova, I. Hellmann, V. Kataev, C. Täschner, B. Büchner, and R. Klingeler. Magnetic properties of vanadium oxide nanotubes probed by static magnetization and nmr. Phys. Rev. B, 73:144417, Apr 2006.
- [29] L Krusin-Elbaum, DM Newns, H Zeng, V Derycke, JZ Sun, and R Sandstrom. Room-temperature ferromagnetic nanotubes controlled by electron or hole doping. Nature, 431(7009):672–676, 2004.
- [30] SV Demishev, AL Chernobrovkin, VV Glushkov, AV Grigorieva, EA Goodilin, H Ohta, S Okubo, M Fujisawa, T Sakurai, NE Sluchanko, et al. Magnetic properties of vanadium oxide nanotubes and nanolayers. Physical Review B, 84(9):094426, 2011.
- [31] ZR Xiao and GY Guo. Structural, electronic and magnetic properties of : An ab initio study. The Journal of chemical physics, 130(21):214704, 2009.
- [32] AB Cezar, IL Graff, J Varalda, WH Schreiner, and DH Mosca. Oxygen-vacancy-induced room-temperature magnetization in lamellar thin films. Journal of Applied Physics, 116(16):163904, 2014.
- [33] Tao Xu, Takahiro Shimada, Masataka Mori, Gen Fujimoto, Jie Wang, and Takayuki Kitamura. Defect engineering for nontrivial multiferroic orders in . Phys. Rev. Materials, 4:124405, Dec 2020.
- [34] M Yu Kagan, KI Kugel, and AL Rakhmanov. Electronic phase separation: Recent progress in the old problem. Physics Reports, 916:1–105, 2021.
- [35] Tian Miao, Lina Deng, Wenting Yang, Jinyang Ni, Changlin Zheng, Joanne Etheridge, Shasha Wang, Hao Liu, Hanxuan Lin, Yang Yu, et al. Direct experimental evidence of physical origin of electronic phase separation in manganites. Proceedings of the National Academy of Sciences, 117(13):7090–7094, 2020.
- [36] A Podlesnyak, Georg Ehlers, M Frontzek, AS Sefat, Albert Furrer, Th Strässle, Ekaterina Pomjakushina, Kazimierz Conder, F Demmel, and DI Khomskii. Effect of carrier doping on the formation and collapse of magnetic polarons in lightly hole-doped . Physical Review B, 83(13):134430, 2011.
- [37] S Savitha Pillai, G Rangarajan, NP Raju, AJ Epstein, and PN Santhosh. Coexistence of ferromagnetic and antiferromagnetic phases in manganites. Journal of Physics: Condensed Matter, 19(49):496221, 2007.
- [38] Luis Andrés Burrola-Gándara, L Vázquez-Zubiate, DM Carrillo-Flores, and JT Elizalde-Galindo. Spin glass behavior in nanofibers obtained by electrospinning. Journal of Superconductivity and Novel Magnetism, 32(8):2501–2508, 2019.
- [39] KM Shafeeq, VP Athira, CH Kishor, and PM Aneesh. Structural and optical properties of v2o5 nanostructures grown by thermal decomposition technique. Applied Physics A, 126(8):1–6, 2020.
- [40] P. E. Blöchl. Projector augmented-wave method. Phys. Rev. B, 50:17953–17979, Dec 1994.
- [41] G. Kresse and D. Joubert. From ultrasoft pseudopotentials to the projector augmented-wave method. Phys. Rev. B, 59:1758–1775, Jan 1999.
- [42] G. Kresse and J. Furthmüller. Efficient iterative schemes for ab initio total-energy calculations using a plane-wave basis set. Phys. Rev. B, 54:11169–11186, Oct 1996.
- [43] John P. Perdew, Kieron Burke, and Matthias Ernzerhof. Generalized gradient approximation made simple. Phys. Rev. Lett., 77:3865–3868, Oct 1996.
- [44] S. L. Dudarev, G. A. Botton, S. Y. Savrasov, C. J. Humphreys, and A. P. Sutton. Electron-energy-loss spectra and the structural stability of nickel oxide: An LSDA+U study. Phys. Rev. B, 57:1505–1509, Jan 1998.
- [45] Lappawat Ngamwongwan, Ittipon Fongkaew, Sirichok Jungthawan, Pussana Hirunsit, Sukit Limpijumnong, and Suwit Suthirakun. Electronic and thermodynamic properties of native point defects in : A first-principles study. Physical Chemistry Chemical Physics, 23(19):11374–11387, 2021.
- [46] Yasser K Abdel-Monem, Sanaa M Emam, and Hager MY Okda. Solid state thermal decomposition synthesis of nanoparticles from coordinated pyrazolopyridine as novel precursors. Journal of Materials Science: Materials in Electronics, 28(3):2923–2934, 2017.
- [47] J Buckeridge, Charles Richard A Catlow, MR Farrow, Andrew J Logsdail, DO Scanlon, TW Keal, P Sherwood, SM Woodley, AA Sokol, and A Walsh. Deep vs shallow nature of oxygen vacancies and consequent n-type carrier concentrations in transparent conducting oxides. Physical Review Materials, 2(5):054604, 2018.
- [48] Mark T Greiner and Zheng-Hong Lu. Thin-film metal oxides in organic semiconductor devices: their electronic structures, work functions and interfaces. NPG Asia Materials, 5(7):e55–e55, 2013.
- [49] Manil Kang, Sok Won Kim, Younghun Hwang, Youngho Um, and Ji-Wook Ryu. Temperature dependence of the interband transition in a film. AIP Advances, 3(5):052129, 2013.
- [50] Top Khac Le, Manil Kang, and Sok Won Kim. A review on the optical characterization of micro-nanostructures. Ceramics International, 45(13):15781–15798, 2019.
- [51] Churna Bhandari and Walter R. L. Lambrecht. Electronic and magnetic properties of electron-doped and . Phys. Rev. B, 92:125133, Sep 2015.
- [52] B. Sipos, M. Duchamp, A. Magrez, L. Forró, N. Barišić, A. Kis, J. W. Seo, F. Bieri, F. Krumeich, R. Nesper, and G. R. Patzke. Mechanical and electronic properties of vanadium oxide nanotubes. Journal of Applied Physics, 105(7):074317, 2009.
- [53] C Sanchez, M Henry, JC Grenet, and J Livage. Free and bound polarons in vanadium pentoxide. Journal of Physics C: Solid State Physics, 15(35):7133, 1982.
- [54] GN Greaves. Small polaron conduction in - glasses. Journal of Non-Crystalline Solids, 11(5):427–446, 1973.
- [55] P Kounavis, A Vomvas, E Mytilineou, M Roilos, and L Murawski. Thermopower, conductivity and the hall effect in gels. Journal of Physics C: Solid State Physics, 21(5):967, 1988.
- [56] K. V. Rao, M. Fähnle, E. Figueroa, O. Beckman, and L. Hedman. Deviations from curie-weiss behavior in spin-glasses. Phys. Rev. B, 27:3104–3107, Mar 1983.
- [57] Jianchao Lin, Peng Tong, Dapeng Cui, Cheng Yang, Jie Yang, Shuai Lin, Bosen Wang, Wei Tong, Lei Zhang, Youming Zou, et al. Unusual ferromagnetic critical behavior owing to short-range antiferromagnetic correlations in antiperovskite . Scientific reports, 5(1):1–7, 2015.
- [58] G Narsinga Rao, YD Yao, and JW Chen. Superparamagnetic behavior of antiferromagnetic cuo nanoparticles. IEEE Transactions on magnetics, 41(10):3409–3411, 2005.
- [59] Fengzhen Huang, Zhijun Wang, Xiaomei Lu, Junting Zhang, Kangli Min, Weiwei Lin, Ruixia Ti, TingTing Xu, Ju He, Chen Yue, et al. Peculiar magnetism of bifeo 3 nanoparticles with size approaching the period of the spiral spin structure. Scientific reports, 3(1):1–7, 2013.
- [60] Eric Vincent and Vincent Dupuis. Spin glasses: experimental signatures and salient outcomes. In Frustrated Materials and Ferroic Glasses, pages 31–56. Springer, 2018.
- [61] Hemlata Dhoundiyal, Pintu Das, and Mukesh C. Bhatnagar. Electrical and magnetic properties of microstructure formed by self-assembled nanorods. Physica B: Condensed Matter, 603:412622, 2021.
- [62] D Dreifus, MPF Godoy, AC Rabelo, AD Rodrigues, YG Gobato, PC Camargo, EC Pereira, and AJA de Oliveira. Antiferromagnetism induced by oxygen vacancies in polycrystals synthesized by the pechini method. Journal of Physics D: Applied Physics, 48(44):445002, 2015.
- [63] Prashanta K. Mukharjee, K. M. Ranjith, B. Koo, J. Sichelschmidt, M. Baenitz, Y. Skourski, Y. Inagaki, Y. Furukawa, A. A. Tsirlin, and R. Nath. Bose-einstein condensation of triplons close to the quantum critical point in the quasi-one-dimensional spin- antiferromagnet . Phys. Rev. B, 100:144433, Oct 2019.
- [64] M. E. Saleta, H. E. Troiani, S. Ribeiro Guevara, G. Ruano, R. D. Sánchez, M. Malta, and R. M. Torresi. Strong reduction of V4+ amount in vanadium oxide/hexadecylamine nanotubes by doping with Co2+ and Ni2+ ions: Electron paramagnetic resonance and magnetic studies. Journal of Applied Physics, 109(9):093914, 2011.
- [65] V. Eyert and K.-H. Höck. Electronic structure of : Role of octahedral deformations. Phys. Rev. B, 57:12727–12737, May 1998.
- [66] A. Chakrabarti, K. Hermann, R. Druzinic, M. Witko, F. Wagner, and M. Petersen. Geometric and electronic structure of vanadium pentoxide: A density functional bulk and surface study. Phys. Rev. B, 59:10583–10590, Apr 1999.
- [67] VN Bogomolov and DN Mirlin. Optical absorption by polarons in rutile () single crystals. physica status solidi (b), 27(1):443–453, 1968.
- [68] A.M. Tokmachev, D.V. Averyanov, O.E. Parfenov, A.N. Taldenkov, I.A. Karateev, I.S.! Sokolov, O.A. Kondratev, V.G. Storchak, Emerging two-dimensional ferromagnetism in silicene materials Nat Commun 9, 1672, 2018.
- [69] Franchini, Cesare and Reticcioli, Michele and Setvin, Martin and Diebold, Ulrike Polarons in materials Nature Reviews Materials 6, 560 – 586, 2021.
- [70] Beltrán JI, Muñoz MC. Tunable correlated-electron phases in (111) LaAlO3/SrTiO3 band insulator heterostructures. Physical Review B, 16, 245120, 2017.
- [71] Le, Top Khac, Manil Kang, and Sok Won Kim. Morphology engineering, room-temperature photoluminescence behavior, and sunlight photocatalytic activity of V2O5 nanostructures. Materials Characterization, 153, 52-59, 2019.
- [72] Sandratskii LM. Exchange interactions in (ZnMn) Se: LDA and LDA+ U calculations. Physical Review B. 29, 224432, 2003
*
Appendix A Calculation of polaron radius
Through further analysis of the transport properties an estimate of the size of the polaron could be made. Greaves [54] reported a detailed investigation into the polaron hopping process in V2O5 - P2O5 glasses. The polarons may be referred to as ’small’ if the radius of the polaron () is larger than the localized electron site but smaller than the distance between two back to back polaronic sites (). Bogomolov et. al. in [67] gave a formula for , which is shown by Eq. 9
| (9) |
where, N is the number of sites per unit volume. Therefore, if there are more polaronic sites in a crystal, the size of the polaron should decrease. The polaronic binding energy () is given by the potential energy of the electron plus the energy due to the lattice distortion created by the electron. In an ionic material, for the small polaron, the potential that a self-trapped electron sees is given by-
| (10) |
where, is the permittivity of V2O5. This results in the binding energy () being,
| (11) |
However, if the concentration of the sites is too high so that , and the self-trapped electron is away from an empty site, then is reduced by . can be evaluated from the formula
| (12) |
Here, is the V-V distance in the crystal, which is estimated to be about 3.53 Å, as obtained from the powder diffraction data and subsequent Rietveld analysis of our sample. has been taken to be 13.6, form literature. has been evaluated by putting into . Now a relation between and has been established using eq. (9) as
| (13) |
Using this formula the values of and have been found to be 3.43 Å and 1.84 Å, respectively. Substituting the value of in eq. (11), we estimated the binding energy to be around 0.287 eV, which is in good agreement with experiment and literature.