Low-density superconductivity in SrTiO3 bounded by the adiabatic criterion
Abstract
SrTiO3 exhibits superconductivity for carrier densities cm-3.Across this range, the Fermi level traverses a number of vibrational modes in the system, making it ideal for studying dilute superconductivity. We use high-resolution planar-tunneling spectroscopy to probe chemically-doped SrTiO3 across the superconducting dome. The over-doped superconducting boundary aligns, with surprising precision, to the Fermi energy crossing the Debye energy. Superconductivity emerges with decreasing density, maintaining throughout the Bardeen-Cooper-Schrieffer (BCS) gap to transition-temperature ratio, despite being in the anti-adiabatic regime. At lowest superconducting densities, the lone remaining adiabatic phonon van Hove singularity is the soft transverse-optic mode, associated with the ferroelectric instability. We suggest a scenario for pairing mediated by this mode in the presence of spin-orbit coupling, which naturally accounts for the superconducting dome and BCS ratio.
The occurrence of superconductivity in electron-doped SrTiO3 has been a mystery ever since its discovery over a half-century ago [1]. To date, it remains one of the lowest density known bulk superconductors, only recently surpassed by Bi [2]. It was also the first material shown to exhibit a doping-dependent superconducting dome [3]. This has been observed in many subsequent materials, for which the dome structure is often a result of nontrivial electron interactions. By contrast, electrons in SrTiO3 are expected to reflect more simple, semiconductor-like charge degrees of freedom. The lattice is unusual for a semiconductor, in that SrTiO3 exhibits a soft transverse-optic phonon mode that nearly condenses at low temperature [4]. The absence of an ordered ferroelectric ground state is attributed to quantum fluctuations [5].
There has been a renaissance of interest in this problem from a number of fronts. The ability to engineer low-dimensional superconductivity in various SrTiO3 heterostructures has emerged [6, 7, 8], where the low carrier density is highly amenable to electrostatic control. Furthermore, there is increasing experimental evidence for a close relationship between ferroelectricity and superconductivity [9, 10, 11], developed in the broader context of modern studies of bulk single crystals and thin films. Theoretically there has been progress in treating electron-phonon interactions in the regime of strong coupling [12, 13], scenarios for plasmon and plasmon-polariton coupling [14, 15], and considerations of quantum critical electrical polarization fluctuations [16, 17]. We take advantage of many of these developments in our work here.
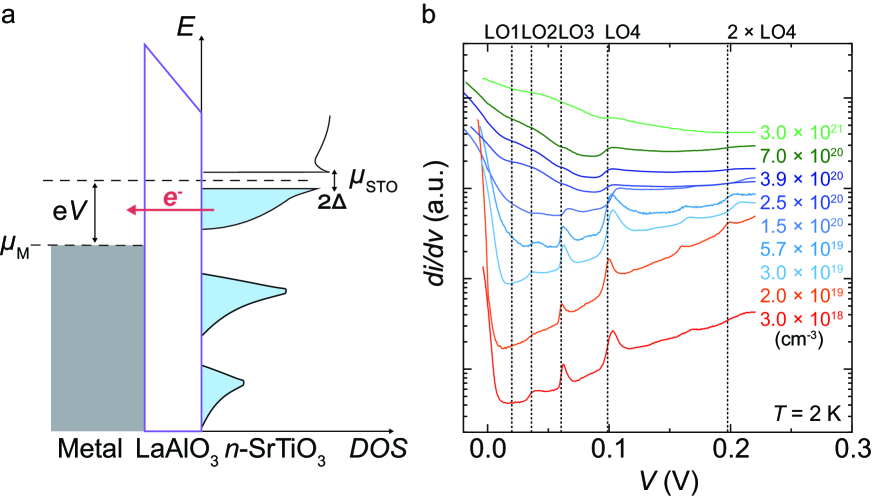
We study the systematic evolution of the electronic structure of doped SrTiO3 using planar tunnel junctions as shown in Fig. 1(a). We utilize high-temperature synthesis of highly-crystalline, substitutionally-doped thin-film SrTiO3 in the step-flow growth regime and atomic-scale polar tunnel barriers (two or three unit cell LaAlO3) covered by a high work-function metal [18]. These structures have been developed to suppress carrier depletion at the SrTiO3 surface, enabling flat-band measurements of the electronic structure down to low carrier densities [19]. Representative differential conductance () measurements performed at 2 K are shown in Fig. 1(b) for Nb doping from 0.02 - 2 atomic %, and 3.5 and 7 atomic % La doping above the bulk solubility limit of Nb. As can be seen in the forward bias spectra, clear longitudinal-optic (LO) phonon replicas are observed, most prominently for the highest-energy LO4 mode and at the lowest densities. These features can be analyzed to estimate [18] the electron-phonon coupling , ranging from for the lowest densities, and rapidly diminishing with increasing density and screening. The phonon peak linewidth is also a good probe of the Fermi energy at the interface [18], which confirms the expected doping evolution for flat-band conditions.
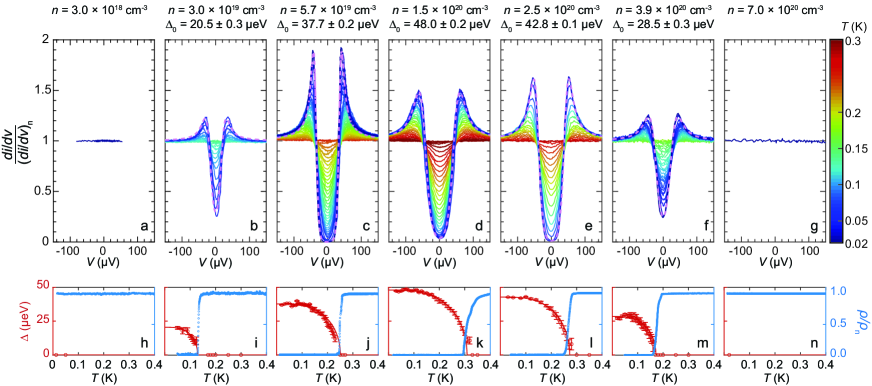
Figure 2 shows measured across the doping series at various temperatures in a dilution refrigerator, normalized to its normal state value . The samples span the superconducting dome, as well as non-superconducting ground states at high and low doping.
The lower panels of Fig. 2 show the resistive transition and the temperature dependent superconducting gap . We extract at each temperature by fitting the Bardeen-Cooper-Schrieffer (BCS) gap function via
| (1) | ||||
where is the Fermi-Dirac function, is the density of states, and is the Dynes quasiparticle broadening parameter. From this we can find the zero temperature gap from the extrapolated fitting of ,
| (2) |
where and the superconducting transition temperature are free parameters of the fit [20]. We find that deduced from gap spectroscopy is very close to the value determined by 50 of the resistive transition, as shown in Fig. 2(h)-(n). In particular, no evidence of a pseudogap is observed, in contrast to one- and two-dimensional superconductivity in SrTiO3 heterostructures, which may reflect their enhanced quantum fluctuations, classical phase fluctuations, and sensitivity to disorder [8, 21, 22]
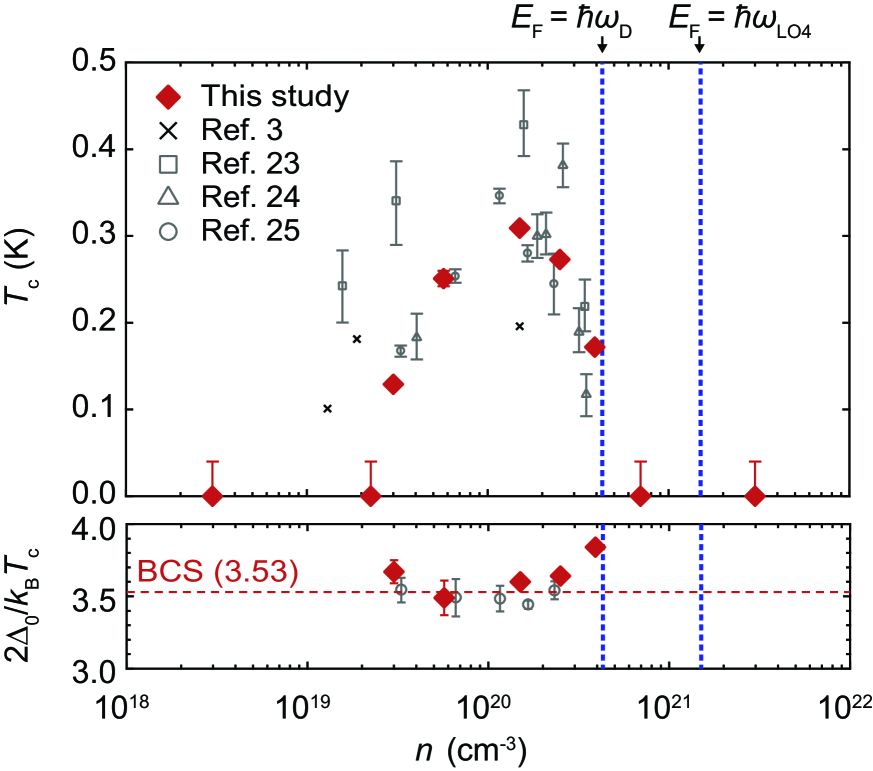
Figure 3(a) plots as a function of doping across the superconducting dome, which is consistent with prior studies of the resistive transition [3, 23, 24, 25]. Also indicated in Fig. 3(a) is the carrier density at which is equal to the Debye energy extracted from specific heat measurements [26]. It is quite striking that this density corresponds to the overdoped boundary for superconductivity in SrTiO3. The LO4 (zone center) phonon energy is crossed by at even higher carrier density (Fig. 3(a)). Conventional superconductivity in metals is mediated by the retarded attractive interaction arising from electron-phonon coupling. Both the original weak-coupling BCS limit and the extension to strong-coupling in Migdal-Eliashberg theory [27, 28] are based on the adiabatic condition that . Here we find that superconductivity in SrTiO3 only emerges in the anti-adiabatic regime. Despite this, we find that (where is the Boltzmann constant) conspicuously mantains a value near the weak-coupling BCS limit of 3.53 across the entire superconducting dome, as shown in Fig. 3(b), consistent with recent microwave conductivity measurements [25].
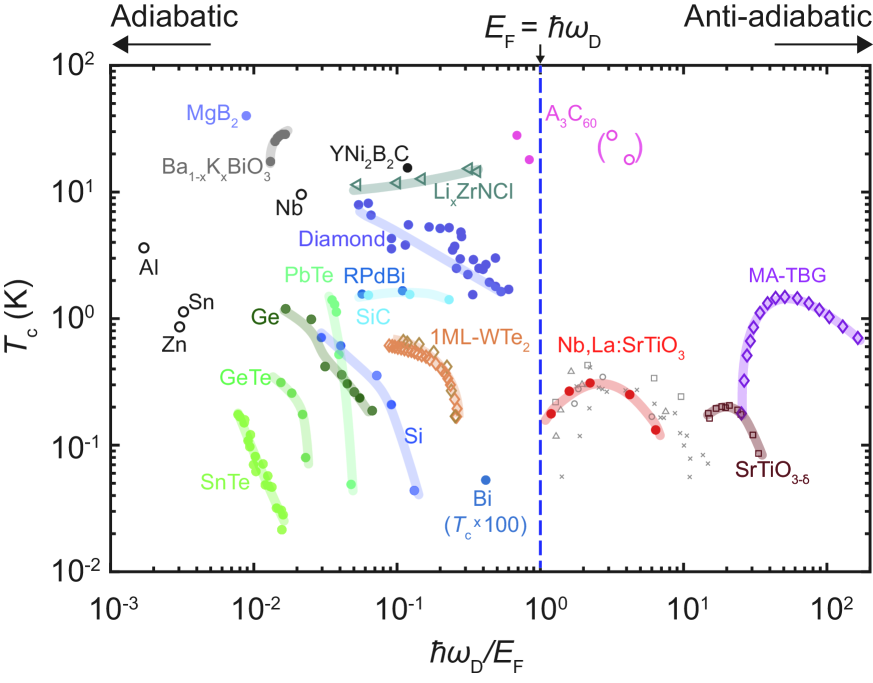
To place this surprising observation in context, we show in Fig. 4 the variation of as a function of estimated for a wide range of superconductors, with emphasis on those that occur at low carrier density and for which phonon contributions to pairing are established or possible. This includes semiconductors with the face-centered-cubic diamond structure (C, Si, SiC, Ge) and the rock-salt structure (PbTe, SnTe, GeTe). In all of these cases, superconductivity is observed only for the adiabatic condition. Despite the extremely low carrier density ( 1017 cm-3) in superconducting Bi, it is also adiabatic due to its very low effective mass. Superconductivity in the fullerides [29] is difficult to categorize given the very different energy scales for intra/inter-molecular phonons. Indeed the possible relevance of anti-adiabatic pairing motivated theoretical investigations of this problem [30, 31, 32].
The only superconductors clearly found in the anti-adiabatic regime are doped SrTiO3, magic-angle twisted bilayer graphene (MA-TBG), and heavy fermion systems (not shown). For completeness we also plot in Fig. 4 the second superconducting dome observed in SrTiO3-δ exclusively for electron-doping via oxygen vacancies. There are open questions whether this second dome occurs due to inhomogeneities arising from vacancy clustering [33, 34]; experimentally we cannot controllably access this regime in our tunneling structures either via direct synthesis of SrTiO3-δ [35] or reduction (given the LaAlO3 barrier).
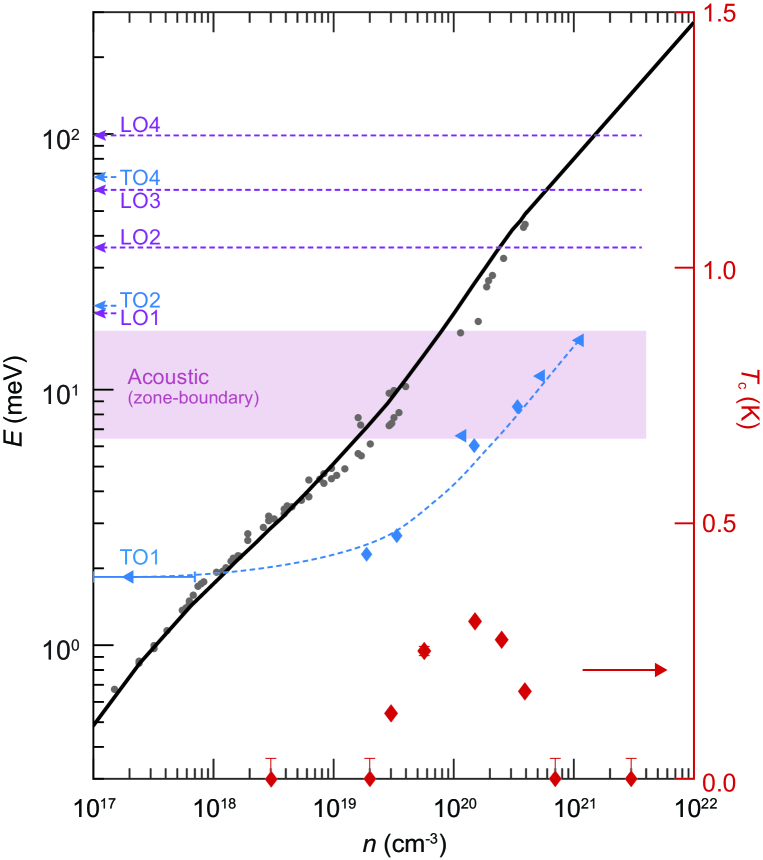
Going beyond the average measure of the phonon energy given by , additional insight can be gained by considering the various phonon modes crossed by with decreasing density, as shown in Fig. 5. In the low-density half of the superconducting dome, is lower than all but one of the optical phonon modes of the system. Although crosses the zone-boundary acoustic modes in this region, we note that they cannot mediate pairing across the small electron pockets at the zone center in SrTiO3. Therefore, other than the extremely low phonon density of states arising from the linear acoustic branches, the only prominent phonon density remaining is the anomalously soft transverse optic phonon mode TO1.
The experiments reported here have several consequences for proposed electron-phonon pairing mechanisms in SrTiO3 which, broadly construed, fall into two categories. The first set of ideas involve anti-adiabatic pairing scenarios, where the entire spectrum of phonons, both of longitudinal and transverse modes, is involved in providing an attractive interaction. Since the Debye energy is large compared to the Fermi energy, the resulting pairing problem is in an inverted regime where the electrons are slow compared to the phonons. In this framework, one would not a priori expect a BCS value for , which crucially depends on the adiabatic limit to apply. Furthermore, we expect substantial mass renormalization to occur in this regime due to the breakdown of Migdal-Eliashberg theory [12]. The absence of such effects casts doubt on the relevance of anti-adiabatic pairing in light of the experimental measurements.
The second set of ideas involves a conventional BCS pairing mechanism, often in the context of ferroelectric quantum criticality, where the phonon scale is small compared to [36, 37, 38]. Given the low carrier concentration, the only viable candidate for such pairing is using the TO1 mode. Without spin-orbit coupling, the electrons can only couple to pairs of TO1 phonons, as noted in Ref. [39]. However, with spin-orbit coupling, pairing can be mediated by single TO1-phonon processes (via scattering between distinct orbitals), and can naturally give rise to a BCS value for the gap to ratio.
A further advantage of the TO1-mediated pairing scenario is that it can also account for a superconducting dome occurring at low Nb concentrations. To see why, note first that with niobium doping , the effective spring constant acquires a density dependent contribution of the form
| (3) |
where is the TO1 mode spring constant associated with Ti [40], and can be derived in the spirit of an effective medium approximation where the system is viewed as a binary alloy. It suggests that the hardening of the TO1 mode from Nb doping stems from substitution rather than from an electronic mechanism. Furthermore, with the adiabatic assumption, where the TO1 mode entirely generates the pairing interaction, the effective BCS pairing eigenvalue is given by
| (4) |
At low concentrations, the pairing strength decreases due to the vanishing of the density of states, whereas at larger concentrations, the weakening of the effective interaction due to the hardening of the TO1 phonon causes the attenuation of the pairing strength. Finally, invoking the Coulomb pseudopotential, , which is certainly valid within the adiabatic regime, we find that the transition temperature decays with density in a convex fashion and abruptly vanishes when . Our hypothesis here is further bolstered by the fact that the LO modes are hardly affected with Nb doping (Fig. 1), which would suggest that their role in superconducting properties is relatively limited.
Thus within this simple framework, we are able to rationalize the observation of a superconducting dome, along with the observed BCS ratio. It is interesting to consider how the dome in bulk SrTiO3 relates to that found in electrostatically-gated LaAlO3/SrTiO3 [6, 22] given the differences in the density of states, orbital structure, and the presence of Rashba coupling at the interface. Finally we note that the results and discussion presented here are likely relevant to the recent discovery of K at KTaO3 interfaces [41, 42], which has a much higher spin-orbit coupling scale than for SrTiO3, but somewhat reduced proximity to ferroelectricity.
Figures.
Acknowledgements
We thank K. Behnia, S. A. Kivelson, I. Fisher, and Y. Suzuki for useful discussions. This work was supported by the Department of Energy, Office of Basic Energy Sciences, Division of Materials Sciences and Engineering, under contract No. DE-AC02-76SF00515; and by the Gordon and Betty Moore Foundation’s Emergent Phenomena in Quantum Systems Initiative through Grant GBMF9072 (dilution refrigerator equipment and A.G.S.). S.B.C. was supported by the National Research Foundation of Korea (NRF) grants funded by the Korea government (MSIT) (2020R1A2C1007554) and the Ministry of Education (2018R1A6A1A06024977).
References
- Schooley et al. [1964] J. F. Schooley, W. R. Hosler, and M. L. Cohen, Phys. Rev. Lett. 12, 474 (1964).
- Prakash et al. [2017] O. Prakash, A. Kumar, A. Thamizhavel, and S. Ramakrishnan, Science 355, 52 (2017).
- Koonce et al. [1967] C. S. Koonce, M. L. Cohen, J. F. Schooley, W. R. Hosler, and E. R. Pfeiffer, Phys. Rev. 163, 380 (1967).
- Yamada and Shirane [1969] Y. Yamada and G. Shirane, J. Phys. Soc. Jpn. 26, 396 (1969).
- Müller and Burkard [1979] K. A. Müller and H. Burkard, Phys. Rev. B 19, 3593 (1979).
- Caviglia et al. [2008] A. D. Caviglia, S. Gariglio, N. Reyren, D. Jaccard, T. Schneider, M. Gabay, S. Thiel, G. Hammerl, J. Mannhart, and J.-M. Triscone, Nature 456, 624 (2008).
- Kozuka et al. [2009] Y. Kozuka, M. Kim, C. Bell, B. G. Kim, Y. Hikita, and H. Y. Hwang, Nature 462, 487 (2009).
- Cheng et al. [2015] G. Cheng, M. Tomczyk, S. Lu, J. P. Veazey, M. Huang, P. Irvin, S. Ryu, H. Lee, C.-B. Eom, C. S. Hellberg, and J. Levy, Nature 521, 196 (2015).
- Rischau et al. [2017] C. W. Rischau, X. Lin, C. P. Grams, D. Finck, S. Harms, J. Engelmayer, T. Lorenz, Y. Gallais, B. Fauqué, J. Hemberger, and K. Behnia, Nat. Phys. 13, 643 (2017).
- Ahadi et al. [2019] K. Ahadi, L. Galletti, Y. Li, S. Salmani-Rezaie, W. Wu, and S. Stemmer, Sci. Adv. 5, eaaw0120 (2019).
- Tomioka et al. [2019] Y. Tomioka, N. Shirakawa, K. Shibuya, and I. H. Inoue, Nat. Commun. 10, 738 (2019).
- Chubukov et al. [2020] A. V. Chubukov, A. Abanov, I. Esterlis, and S. A. Kivelson, Ann. Phys. 417, 168190 (2020).
- Kumar et al. [2021] A. Kumar, V. I. Yudson, and D. L. Maslov, Phys. Rev. Lett. 126, 076601 (2021).
- Takada [1980] Y. Takada, J. Phys. Soc. Japan 49, 1267 (1980).
- Ruhman and Lee [2016] J. Ruhman and P. A. Lee, Phys. Rev. B 94, 224515 (2016).
- Appel [1969] J. Appel, Phys. Rev. 180, 508 (1969).
- Edge et al. [2015] J. M. Edge, Y. Kedem, U. Aschauer, N. A. Spaldin, and A. V. Balatsky, Phys. Rev. Lett. 115, 247002 (2015).
- Swartz et al. [2018] A. G. Swartz, H. Inoue, T. A. Merz, Y. Hikita, S. Raghu, T. P. Devereaux, S. Johnston, and H. Y. Hwang, Proc. Natl. Acad. Sci. 115, 1475 (2018).
- Yajima et al. [2015] T. Yajima, M. Minohara, C. Bell, H. Kumigashira, M. Oshima, H. Y. Hwang, and Y. Hikita, Nano Lett. 15, 1622 (2015).
- Devereaux and Einzel [1995] T. P. Devereaux and D. Einzel, Phys. Rev. B 51, 16336 (1995).
- Richter et al. [2013] C. Richter, H. Boschker, W. Dietsche, E. Fillis-Tsirakis, R. Jany, F. Loder, L. F. Kourkoutis, D. A. Muller, J. R. Kirtley, C. W. Schneider, and J. Mannhart, Nature 502, 528 (2013).
- Chen et al. [2018] Z. Chen, A. G. Swartz, H. Yoon, H. Inoue, T. A. Merz, D. Lu, Y. Xie, H. Yuan, Y. Hikita, S. Raghu, and H. Y. Hwang, Nat. Commun. 9, 4008 (2018).
- Lin et al. [2014] X. Lin, G. Bridoux, A. Gourgout, G. Seyfarth, S. Krämer, M. Nardone, B. Fauqué, and K. Behnia, Phys. Rev. Lett. 112, 207002 (2014).
- Collignon et al. [2017] C. Collignon, B. Fauqué, A. Cavanna, U. Gennser, D. Mailly, and K. Behnia, Phys. Rev. B 96, 224506 (2017).
- Thiemann et al. [2018] M. Thiemann, M. H. Beutel, M. Dressel, N. R. Lee-Hone, D. M. Broun, E. Fillis-Tsirakis, H. Boschker, J. Mannhart, and M. Scheffler, Phys. Rev. Lett. 120, 237002 (2018).
- McCalla et al. [2019] E. McCalla, M. N. Gastiasoro, G. Cassuto, R. M. Fernandes, and C. Leighton, Phys. Rev. Mater. 3, 022001(R) (2019).
- Migdal [1958] A. B. Migdal, Zh. Eksp. Teor. Fiz. 34, 996 (1958).
- Eliashberg [1960] G. M. Eliashberg, Zh. Eksp. Teor. Fiz. 11, 696 (1960).
- Gunnarsson [1997] O. Gunnarsson, Rev. Mod. Phys. 69, 575 (1997).
- Pietronero et al. [1995] L. Pietronero, S. Strässler, and C. Grimaldi, Phys. Rev. B 52, 10516 (1995).
- Grimaldi et al. [1995] C. Grimaldi, L. Pietronero, and S. Strässler, Phys. Rev. B 52, 10530 (1995).
- Chakravarty et al. [1992] S. Chakravarty, S. Khlebnikov, and S. Kivelson, Phys. Rev. Lett. 69, 212 (1992).
- Szot et al. [2002] K. Szot, W. Speier, R. Carius, U. Zastrow, and W. Beyer, Phys. Rev. Lett. 88, 075508 (2002).
- [34] T. M. Bretz-Sullivan, A. Edelman, J. S. Jiang, A. Suslov, D. Graf, J. Zhang, G. Wang, C. Chang, J. E. Pearson, A. B. Martinson, P. B. Littlewood, and A. Bhattacharya, arXiv:1904.03121v2 .
- Ohtomo and Hwang [2007] A. Ohtomo and H. Y. Hwang, J. Appl. Phys. 102, 083704 (2007).
- Kedem [2018] Y. Kedem, Phys. Rev. B 98, 220505(R) (2018).
- Kozii et al. [2019] V. Kozii, Z. Bi, and J. Ruhman, Phys. Rev. X 9, 031046 (2019).
- Gastiasoro et al. [2020] M. N. Gastiasoro, T. V. Trevisan, and R. M. Fernandes, Phys. Rev. B 101, 174501 (2020).
- van der Marel et al. [2019] D. van der Marel, F. Barantani, and C. W. Rischau, Phys. Rev. Research 1, 013003 (2019).
- Bäuerle et al. [1980] D. Bäuerle, D. Wagner, M. Wöhlecke, B. Dorner, and H. Kraxenberger, Z. Physik B - Condensed Matter 38, 335 (1980).
- Liu et al. [2021] C. Liu, X. Yan, D. Jin, Y. Ma, H. W. Hsiao, Y. Lin, T. M. Bretz-Sullivan, X. Zhou, J. Pearson, B. Fisher, J. S. Jiang, W. Han, J. M. Zuo, J. Wen, D. D. Fong, J. Sun, H. Zhou, and A. Bhattacharya, Science 371, 716 (2021).
- Chen et al. [2021] Z. Chen, Y. Liu, H. Zhang, Z. Liu, H. Tian, Y. Sun, M. Zhang, Y. Zhou, J. Sun, and Y. Xie, Science 372, 721 (2021).
- Lin et al. [2015] X. Lin, B. Fauqué, and K. Behnia, Science 349, 945 (2015).
- van der Marel et al. [2011] D. van der Marel, J. L. M. van Mechelen, and I. I. Mazin, Phys. Rev. B 84, 205111 (2011).
- Choudhury et al. [2008] N. Choudhury, E. J. Walter, A. I. Kolesnikov, and C.-K. Loong, Phys. Rev. B 77, 134111 (2008).
- van Mechelen et al. [2008] J. L. M. van Mechelen, D. van der Marel, C. Grimaldi, A. B. Kuzmenko, N. P. Armitage, N. Reyren, H. Hagemann, and I. I. Mazin, Phys. Rev. Lett. 100, 226403 (2008).