Coherence scale of magnetic fields generated in early-time forward shocks of GRBs
Abstract
We report the earliest-ever detection of optical polarization from a GRB forward shock (GRB 141220A), measured s after the burst using the multi-colour RINGO3 optical polarimeter on the 2-m fully autonomous robotic Liverpool Telescope. The temporal decay gradient of the optical light curves from s to s post-burst is typical of classical forward shocks with . The low optical polarization (2) at mean time s post-burst is compatible with being induced by the host galaxy dust (mag), leaving low polarization intrinsic to the GRB emission itself —as theoretically predicted for forward shocks and consistent with previous detections of low degrees of optical polarization in GRB afterglows observed hours to days after the burst. The current sample of early-time polarization data from forward shocks suggests polarization from (a) the Galactic and host galaxy dust properties (i.e. ), (b) contribution from a polarized reverse shock (GRB deceleration time, jet magnetization) or (c) forward shock intrinsic polarization (i.e. ), which depends on the magnetic field coherence length scale and the size of the observable emitting region (burst energetics, circumburst density).
keywords:
gamma-ray burst: individual: grb 141220A – magnetic fields – polarization – ISM: jets and outflows1 Introduction
Gamma-ray bursts (GRBs) are the brightest flashes of -ray emission in the Universe. After the collapse of a massive star or coalescence of two compact stellar objects (Woosley, 1993; Berger, 2014; Abbott et al., 2017a, b), the accretion into a new-born compact object powers ultrarelativistic jetted emission that —via internal dissipation processes— produces the highly variable and characteristic -ray prompt emission. In the fireball model framework, the ejecta is later on decelerated by the circumburst medium by a pair of external shocks —a reverse shock propagating back into the ejecta (Rees & Meszaros, 1992; Sari & Piran, 1999; Kobayashi, 2000) and a forward shock propagating into the ambient medium— producing a long-lived afterglow that can be seen from X-rays to radio frequencies (e.g., Piran 1999; Mészáros 2002; Piran 2004).
During the first hundreds of seconds after the burst —for prompt and reverse shock emission— different polarimetric signatures are expected for competing jet models: unpolarized emission from weak, tangled magnetic fields for a baryonic jet (Rees & Meszaros, 1994; Medvedev & Loeb, 1999) or highly polarized emission due to the presence of globally ordered magnetic fields (Granot & Königl, 2003; Lyutikov et al., 2003; Zhang & Kobayashi, 2005; Komissarov et al., 2009). Currently, the discrepancy among the results of time-integrated -ray polarization studies of the prompt emission remains debated (Coburn & Boggs, 2003; Rutledge & Fox, 2004; Willis et al., 2005; Chattopadhyay et al., 2019; Kole et al., 2020; Gill & Granot, 2021). Additionally, GRB 170114A time-resolved analysis suggests the evolution of the polarization degree and angle over a single pulse, reaching values of (Burgess et al., 2019). Early-time optical polarimetric studies of reverse shocks favour a mildly magnetized jet with primordial magnetic fields advected from the central engine (e.g., GRB 090102; Steele et al. 2009, GRB 120308A; Mundell et al. 2013). However, recent observations suggest that very energetic GRBs can be launched highly magnetized (GRB 190114C: Jordana-Mitjans et al. 2020).
Whilst polarimetry of the prompt emission and early afterglow determines the jet physics, polarimetric observations of forward shocks allow to test particle acceleration mechanisms (e.g., shock formation, magnetic turbulence), study the dust properties of GRBs’ environments and resolve the large-scale geometry of jets at cosmological distances (Lazzati et al., 2003; Rossi et al., 2004). In the afterglow framework, the forward shock is powered by shocked ambient medium and tangled magnetic fields are locally generated in shocks and amplified by plasma instabilities (e.g., via Weibel instability; Weibel 1959; Nishikawa et al. 2003; Silva et al. 2003; Medvedev et al. 2005). The magnetic field is randomly oriented in space with length scales much smaller than the size of the observable region of the shock. Consequently, the emission is expected to be intrinsically unpolarized when the jet is on-axis (Medvedev & Loeb, 1999). However, it can be significantly polarized if the random field is anisotropic (e.g. the averaged strength in the shock normal direction is stronger or weaker) and the line-of-sight runs almost along the jet edge. The second condition is satisfied when a jet break is observed (Sari, 1999; Ghisellini & Lazzati, 1999; Rossi et al., 2004). Additionally, the emission can show few percents of polarization due to differential dust extinction (Hiltner, 1949; Lazarian, 2007) along the Galactic line-of-sight and in the GRB environment (e.g., Lazzati et al. 2003; Klose et al. 2004).
Pioneering polarization studies of GRB afterglows found hours to days after the onset of the GRB in the optical and near-infrared bands (e.g., Covino et al. 2004) —during the forward shock decay. The first polarization constraint was at h post-burst for GRB 990123 (Hjorth et al., 1999). Observations of GRB 990510 registered steady levels of polarization at level from h to h post-burst, hence validating synchrotron as the emitting mechanism (Wijers et al., 1999; Covino et al., 1999). The polarimetric monitoring of GRB 030329 afterglow days post-burst measured low levels with significant variability around the light curve jet break (; Greiner et al. 2003) —expected for beamed ejecta. Polarization also behaved similarly during the achromatic break of GRB 091018 (Wiersema et al., 2012). Recent spectropolarimetric observations of GRB 191221B also detected low levels for forward shock emission h after the burst (Buckley et al., 2020).
With the advance of robotic telescopes, the first early-time polarization constraint of an optical afterglow was made s post-burst —during the afterglow onset of GRB 060418. The (2) suggested a significant contribution of unpolarized forward shock photons (Mundell et al., 2007a). GRB 091208B emission was interpreted as forward shock; the detection during s post-burst disfavoured the afterglow model and proposed other mechanisms for the amplification of the magnetic field at the front shock, e.g., magnetohydrodynamic instabilities (Uehara et al., 2012). GRB 131030A polarization degree remained steady at level during h post-burst and was associated to dust-induced polarization from the Galactic interstellar medium (ISM; King et al. 2014).
GRB 141220A optical light curve, presented in this paper, resembles those of late-time classical forward shocks detected hours to days after the prompt. In contrast, Liverpool Telescope (LT; Steele et al. 2004) observations indicate that the forward shock was dominating the total emission as soon as s after the burst. The afterglow was bright at the time of polarization observations — starting s post-burst— hence providing good early-time constraints. GRB 141220A allows checking whether the early-time emission from forward shocks is intrinsically unpolarized as predicted in the fireball model and observed during late-time afterglows.
This paper is structured as follows. In Section 2, we detail the data analysis of GRB 141220A follow-up observations by the LT. In Section 3, we study the emission decay, the broad-band spectral properties of the burst and the polarization. In Section 4, we check closure relations for GRB 141220A, we discuss which mechanisms can explain the observed polarization levels and we compare GRB 141220A to other early-time forward shock measurements. In Section 5, we summarize our findings. Throughout this paper, we assume flat CDM cosmology , and , as reported by Planck Collaboration et al. (2020a). We adopt the convention , where is the temporal index and is the spectral index. The spectral index is related to the photon index like . Uncertainties are quoted at confidence level unless stated otherwise.
2 Observations and Data Reduction
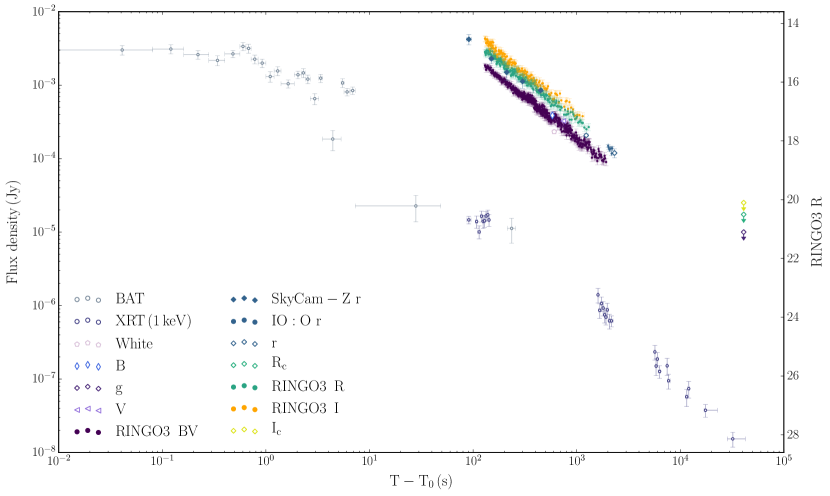
On 2014 December 20 at T06:02:52.7 UT, the Swift Burst Alert Telescope (BAT; Cummings et al. 2014) was triggered by the detection of a pulse of -rays corresponding to the candidate GRB 141220A. The pulses lasted from Ts to Ts and consisted of one structured peak —centred at Ts— followed by two fainter ones at s and s. The emission was detectable until s post-burst (see Fig. 1; Evans et al. 2009).
In the keV band, BAT measured a peak energy keV with the of the burst fluence released during Ts (Stamatikos et al., 2014). Both Fermi Gamma-ray Burst Monitor (GBM; Yu 2014) and Konus-Wind (KW; Golenetskii et al. 2014) detected the -ray prompt with similar T90 in the keV and MeV energy range, respectively. KW detected the event up to MeV and measured a peak energy keV, isotropic energy erg and a peak isotropic luminosity erg s-1 (Tsvetkova et al., 2017). Given the duration of the burst and the hardness ratio111The ratio between the fluences in the keV and keV energy bands. (Lien et al., 2016), GRB 141220A is classified as a long-soft GRB type (Kouveliotou et al., 1993; Bromberg et al., 2013; Lien et al., 2016) —typically associated with a collapsar origin. This classification is further supported by keV s-1 —the ratio is keV s-1 for of long GRBs in BATSE sample (Shahmoradi & Nemiroff, 2015).
A bright optical afterglow of mag was detected s after BAT trigger at the GRB 141220A location by the 0.2-m SkyCam-Z telescope (see Section 2.2) —attached to the LT.
At s after the burst, the Swift X-ray Telescope (XRT; Gompertz et al. 2014) also started observing the field. The XRT light curve has two distinct segments separated by a gap in observations: the first s were done in Windowed Timing (WT) mode, whilst the steepest decay was observed in Photon Counting (PC) mode (see Fig. 1; Evans et al. 2009).
The 2-m LT reacted automatically to Swift alert (Guidorzi et al., 2006) with the three-band optical polarimeter and imager RINGO3 with observations starting at s post-burst (see Section 2.1). LT observations consisted of minute epochs of RINGO3 instrument, followed by s frames with the r band of the Optical Wide Field Camera (IO:O; see Section 2.3) and minute more with RINGO3.
At s post-burst, the 0.3-m Swift Ultraviolet/Optical Telescope (UVOT; Marshall & Cummings 2014) detected an optical counterpart of mag in the white band. At minutes post-burst, the 10.4-m Gran Telescopio Canarias (GTC; de Ugarte Postigo et al. 2014b, a) detected GRB 141220A with mag in the r band and derived a spectral redshift of .
2.1 Calibration of RINGO3 BV/R/I Band Observations
The RINGO3 instrument employs a spinning polaroid and two dichroic that split the light beam into three optical bands (Arnold et al., 2012). From s post-burst, the source intensity was sampled every s at eight polaroid angles by three fast-readout cameras. These s exposures were automatically co-added by the telescope pipeline222https://telescope.livjm.ac.uk/TelInst/Pipelines/ into minute integrations. Given RINGO3 instrumental configuration, the photometry is derived integrating the intensity of all eight frames (see Section 2.1.1) and the polarization degree and angle, measuring the relative intensity of the source at each of the eight polaroid positions (see Section 2.1.2). For both analyses, we use aperture photometry to derive the source flux with Astropy Photutils package (Bradley et al., 2016).
2.1.1 Photometric Calibration of Optical Light Curves
The signal-to-noise ratio (S/N) of the optical transient (OT) was high at the start of observations; the OT was detected at S/N in each of the first s frames of the BV band. Given its brightness, we use the s exposures instead of the minute integrations. We follow the same procedure as in Jordana-Mitjans et al. (2020) and we dynamically co-add the s frames such that the OT reaches a minimum threshold of , which gives a mag photometric precision. BV band observations after s post-burst are the result of integrating frames; the R/I bands have lower S/N and the frame co-adding starts at Ts. The BV photometry after Ts is discarded because the OT fades beyond the S/N threshold; the source S/N is lower in the R/I bands and we only accept photometry up to s and s post-burst, respectively. Integrations of lower S/N thresholds do not present statistically significant structure (within 3) in addition to the OT constant emission decay; frame binnings with thresholds S/N discard late-time photometry. We check the stability of RINGO3 during the OT observations with the stars in the field: a mag star and three mag stars. Using the OT binning for the photometry, the stars present a mag deviation from the mean.
We calibrate the photometry in absolute flux in RINGO3 BV/R/I bandpass system following Jordana-Mitjans et al. (2020). Observations of three dereddened A0 type stars (HD 87112, HD 92573, HD 96781; Høg et al. 2000), including the GRB 141220A field, were scheduled via LT phase2UI333http://telescope.livjm.ac.uk/PropInst/Phase2/ using the same instrumental setup of the night of the burst. The observations were automatically dispatched during the nights of 2018 May 2-3. We correct for the mean Galactic extinction ( is derived from a field statistic444https://irsa.ipac.caltech.edu/applications/DUST/; Schlegel et al. 1998) and we use the RINGO3 magnitude-to-flux conversion from Jordana-Mitjans et al. (2020). This calibration adds mag uncertainty to the photometry.
2.1.2 Calibration of Optical Polarization
We measure the flux of the OT at each of the eight rotor positions of the polaroid and, following Clarke & Neumayer (2002), we convert them to the Stokes parameters (q-u). The confidence levels of the Stokes parameters and the polarization degree and angle are determined with a Monte Carlo error propagation starting from simulated flux values for each polaroid position.
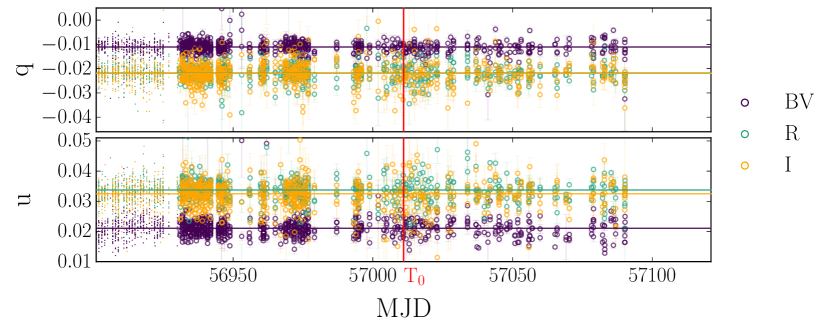
RINGO3 instrumental polarization is subtracted in the Stokes parameters plane and the polarization angle is standardized to a reference (Słowikowska et al., 2016). As RINGO3 is regularly taking observations of standards stars, we choose observations taken during a period of days on either side of the burst date T0 (see Figure 2). From 2014-10-01 to 2015-03-10, the following mag unpolarized standards stars were observed with RINGO3: BD +32 3739, BD +33 2642, BD +28 4211, HD 14069, HD 109055 and G191-B2B. The instrumental polarization is determined with the median q-u of observations of the standards per RINGO3 band. We estimate a precision in the definition of the instrumental q-u, which could introduce no more than in polarization after their subtraction. We also check for any monotonic trend of the instrumental q-u during the Tdays’ time-window; the Pearson’s correlation coefficients of each band are not significant with and -values.
| Band | tmid | t | mag | mag | Fν | F |
|---|---|---|---|---|---|---|
| (s) | (s) | (Jy) | (Jy) | |||
| BV | 130.1 | 0.6 | 15.73 | 0.08 | ||
| BV | 131.3 | 0.6 | 15.76 | 0.08 | ||
| BV | 132.4 | 0.6 | 15.78 | 0.08 | ||
| BV | 133.6 | 0.6 | 15.88 | 0.08 | ||
| BV | … | … | … | … | … | … |
-
a
Note. tmid corresponds to the mean observing time and texp to the length of the observation window. Magnitudes and flux density values are corrected for atmospheric and Galactic extinction. Table 1 is published in its entirety in the machine-readable format. A portion is shown here for guidance regarding its form and content.
Following Mundell et al. (2013) and Jordana-Mitjans et al. (2020), we co-add the -s frames of the first -minute epoch so that the OT has maximum S/N. The BV band provides the highest S/N for the time window s post-burst with polarization at a confidence level. The OT is well detected at an average S/N in each of the eight polaroid position images. The remaining measurements of the BV band —and the R/I bands— are derived maximizing the S/N. The polarization angle is standardized to a reference using observations of mag polarized standard stars taken during the Tdays’ time-window: BD +25 727, BD +59 389, HD 155528, VI CYG 12, BD +64 106 and Hiltner 960 (Turnshek et al., 1990; Schmidt et al., 1992). GRB 141220A polarization measurements are presented in Table 2 with the polarization degree and the angle uncertainty quoted at confidence level.
We estimate RINGO3 depolarizing factor555Note that is the true polarization such that an instrument with no depolarization has . () during the Tdays period using the observations of the polarized standard stars and observations of the polarized planetary nebula of CRL 2688 (Shawl & Tarenghi, 1976). After q-u ellipticity corrections (Arnold, 2017), RINGO3 depolarizing effect is negligible in the BV band () and small in the R/I bands (). Because R/I band polarization measurements are dominated by noise (resulting in upper limits), this correction is not applied to the polarization measurements of Table 2. We check the stability of RINGO3 instrument during observations using the bright star in the R/I band field-of-view that has polarization . Using the OT binning, the polarization presents a deviation from the mean. We test the robustness of the polarization measurements with FWHM photometric apertures for the OT and the bright star. There is no polarization variations within .
| Band | tmid | t | S/N | q | qerr | u | uerr | ||||
|---|---|---|---|---|---|---|---|---|---|---|---|
| (s) | (s) | () | () | (°) | (°) | ||||||
| BV | 166.9 | 37.4 | 60 | -0.017 | 0.009 | 0.023 | 0.009 | 2.8 | 63 | 20 | |
| BV | 253.8 | 49.5 | 42 | 0.006 | 0.014 | 0.014 | 0.014 | - | - | - | |
| BV | 514.4 | 211.1 | 38 | -0.008 | 0.015 | 0.014 | 0.015 | - | - | - | |
| BV | 1043.0 | 298.0 | 21 | -0.009 | 0.026 | 0.008 | 0.026 | - | - | - | |
| BV | 1658.5 | 298.0 | 11 | -0.042 | 0.051 | 0.022 | 0.051 | - | - | - | |
| R | 166.9 | 37.4 | 30 | -0.006 | 0.018 | -0.005 | 0.018 | - | - | - | |
| R | 282.0 | 77.7 | 23 | -0.004 | 0.024 | -0.005 | 0.024 | - | - | - | |
| R | 542.6 | 182.9 | 17 | 0.034 | 0.033 | 0.020 | 0.033 | - | - | - | |
| R | 1043.0 | 298.0 | 11 | 0.083 | 0.049 | -0.005 | 0.049 | - | - | - | |
| R | 1658.5 | 298.0 | 7 | 0.007 | 0.085 | -0.122 | 0.085 | - | - | - | |
| I | 166.9 | 37.4 | 23 | -0.022 | 0.024 | 0.016 | 0.024 | - | - | - | |
| I | 282.0 | 77.7 | 17 | -0.016 | 0.033 | 0.010 | 0.033 | 8 | - | - | - |
| I | 542.5 | 182.9 | 14 | -0.007 | 0.040 | 0.061 | 0.040 | - | - | - | |
| I | 1043.0 | 298.0 | 9 | -0.086 | 0.063 | -0.014 | 0.063 | - | - | - | |
| I | 1658.5 | 298.0 | 6 | 0.013 | 0.088 | 0.120 | 0.088 | - | - | - |
-
a
Note. and uncertainties and upper limits are quoted at confidence level.
2.2 Photometric Calibration of White-light SkyCam-Z Observations
The SkyCam-Z telescope666https://telescope.livjm.ac.uk/TelInst/Inst/SkyCam/ is attached to the LT mount and continuously monitors LT field-of-view with a coverage in a white band —taking a single exposure of s every minute. The SkyCam-Z started the first 10-s exposure of GRB 141220A field at s post-burst, before RINGO3 observations. However, the LT telescope was still slewing towards the target at that time and the first frame has trails; we correct the flux offset of the first frame with the succeeding SkyCam-Z observation (at Ts) using 55 stars detected in both fields. Observations starting at Ts are co-added to reach a minimum threshold of S/N=5. We standardize the white-band photometry with the r-band using five mag stars from the SDSS DR12 catalogue (Alam et al., 2015). In Table 1 and Fig. 1, the photometry is corrected for mean the Galactic extinction (mag) but not for host galaxy extinction (see Section 3.3.2).
2.3 Photometric Calibration of r-band IO:O Observations
The IO:O777https://telescope.livjm.ac.uk/TelInst/Inst/IOO/ observations started at Ts with the r filter. Given that the OT is detected at S/N per frame, we individually derive the OT flux. We standardize the photometry using ten mag stars from the SDSS DR12 catalogue (Alam et al., 2015). In Table 1 and Fig. 1, we present the IO:O photometry in the r band. The IO:O light curve is corrected for the mean Galactic extinction (mag) but not for host galaxy extinction (see Section 3.3.2).
3 Results
In this section, we present the time-resolved polarization measured in three optical bands (see Section 3.1), the optical light curves in three bands and a white band (see Section 3.2), the spectral evolution in the optical bands (see Section 3.3.1) and the combined optical/X-rays spectral energy distributions (SEDs; see Section 3.3.2).
3.1 Polarization in Three Optical Bands
We detect low polarization in RINGO3 BV/R/I bands since the start of observations at s post-burst (see Fig. 3). The best constraint is the polarization measurement at confidence level, with polarization angle °°(2). This measurement corresponds to the time window s post-burst, i.e. s after the burst in the GRB rest-frame. Additionally, we use the permutation test detailed in Steele et al. 2017 to prove that the observed polarization is a measurement and not the result of random noise in an unpolarized source. Consequently, we randomly reorder the eight flux values, corresponding to each angle position of the polaroid, to create a sample of 40320 polarization values with the same S/N properties of the observed polarization. If the observed polarization lays within the simulated distribution (), it indicates that there is high probability of being the result of the random noise. The observed polarization belongs to the upper quantile of the overall distribution; there is only probability that this measurement is consistent with zero polarization.
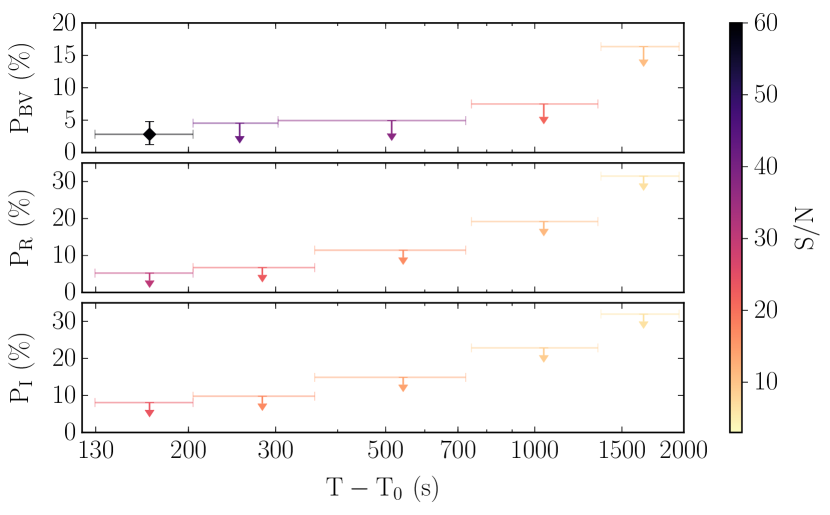
In the BV band, the polarization is further constrained at () level until s post-burst. Afterwards, the upper limits increase significantly with time due to the decreasing brightness of the OT, which cannot be compensated by integrating more frames. The R/I bands have less S/N and the observed polarization is within the instrument sensitivity, ranking in the polarization permutation test. The best constraints in R/I bands are the upper limits during s post-burst —consistent with the cotemporal BV band measurement.
3.2 Optical Light Curves
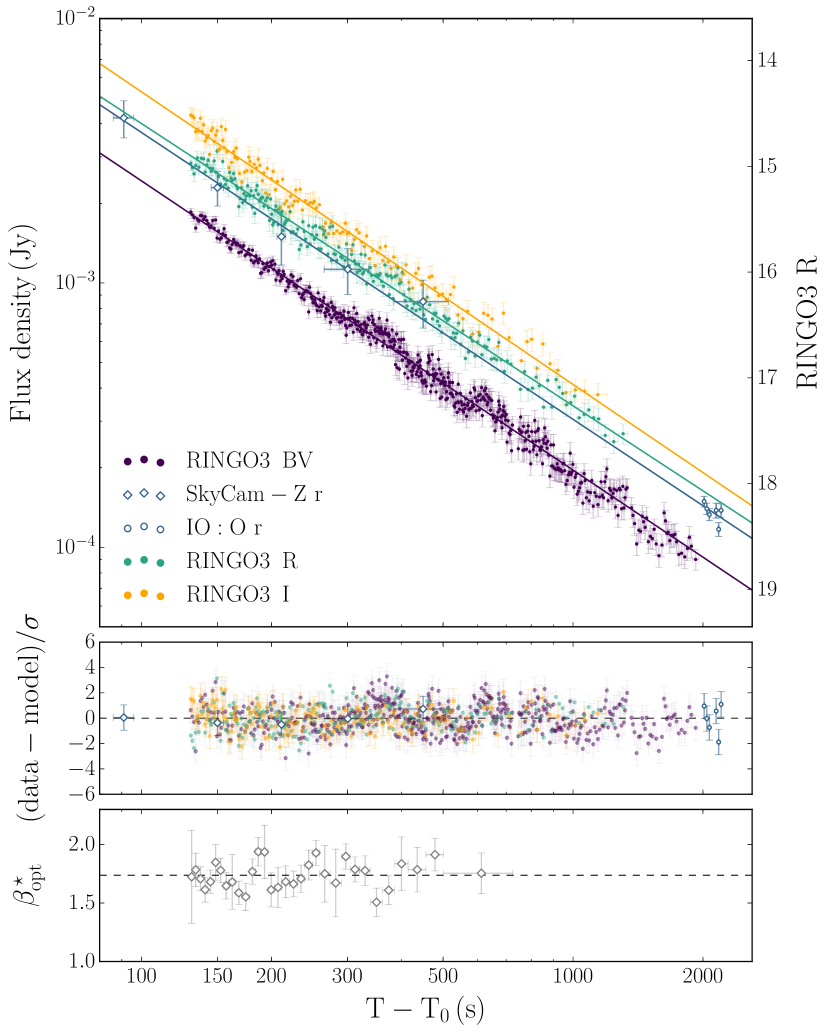
The BV/R/I light curves are satisfactorily modelled with power laws that have compatible decay indexes (see Table 3). We note that the BV band has worse statistics than the R/I bands due to smaller photometric uncertainties888The statistical uncertainty of the BV band is likely underestimated; for the first s of the light curve, it is smaller than the mag deviation we measure in field stars. (higher S/N). The SkyCam-Z White and IO:O r band observations are also fitted in a joint r-equivalent light curve. If we simultaneously fit all light curves with a single power law, the best-fitting model indicates that the emission was decaying as since s and up to s after the burst (see Fig. 4).
3.3 Spectral Evolution of the Emission
3.3.1 Optical Spectral Index
Given RINGO3 simultaneous three-band imaging, we study the evolution of the optical spectral index. We follow Jordana-Mitjans et al. (2020) procedure and we co-add the -s frames of the lowest S/N band (I band) to reach a minimum threshold of S/N=20, which gives mag spectral precision through observations and discards photometry after s post-burst. We use the I-band binning to co-add the BV/R band frames. We subtract the Galactic extinction (; Schlegel et al. 1998) from the flux-calibrated photometry. For each temporal bin, we fit a power law to the three-band SED and we obtain the spectral index .
The evolution of the optical spectral index is consistent with a mean (/dof and -value=0.7); the optical emission does not suffer any significant spectral change during s post-burst (see Fig. 4 bottom panel). Note that the spectral index is not corrected by the host galaxy extinction and, therefore, it is an upper limit of the true optical spectral index .
3.3.2 Broadband Spectral Energy Distribution
To infer the optical to X-rays synchrotron spectrum, we analyse the broadband SEDs using the time-resolved 0.3-10 keV XRT and RINGO3 observations. We extract the XRT spectra that has cotemporal RINGO3 observations using the web interface provided by Leicester University999https://www.swift.ac.uk/user_objects/ based on HEASoft (v. 6.22.1; Blackburn 1995). We then obtain a single RINGO3 photometric measurement per band by co-adding the s frames that correspond to the XRT time interval. XRT has a gap of observations between WT and PC mode; consequently, the two broadband SEDs correspond to the time intervals s and s.
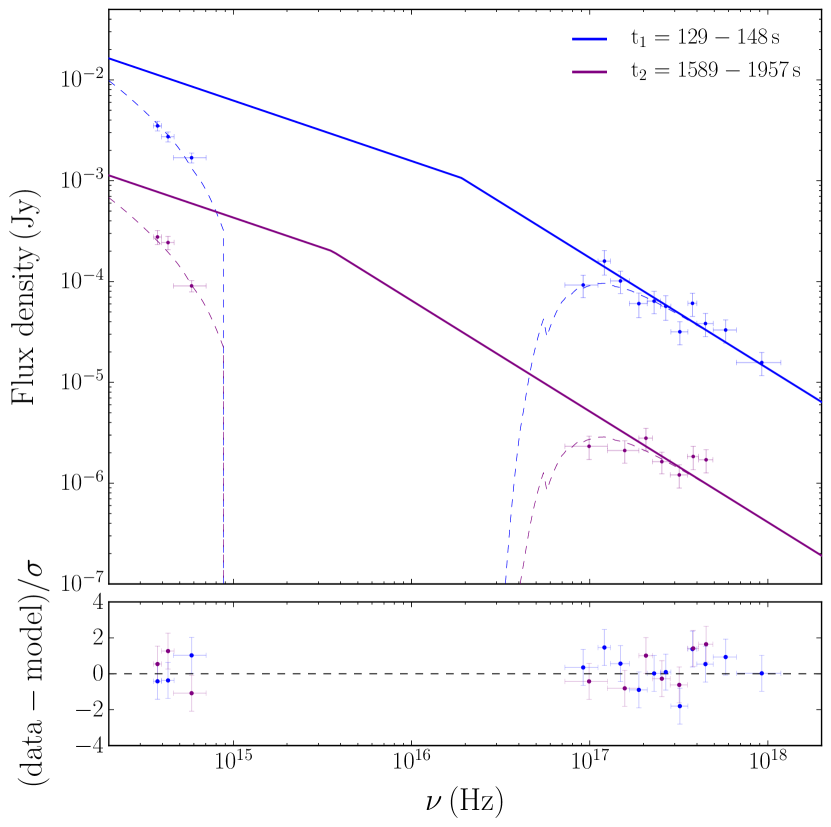
We model the combined optical/X-ray data with XSPEC (v. 12.9.1; Arnaud et al. 1999) using statistics. To ensure the Gaussian limit, we use the GRPPHA tool to group the XRT spectra such that there are at least 20 counts per bin. The models we employ are either power laws (powerlaw in XSPEC) or connected power laws (bknpower) that account for the rest-framed host galaxy and MW total hydrogen column absorption and dust extinction (phabs*zphabs*zdust*zdust). For both SEDs, we fix the MW dust extinction to (Schlegel et al., 1998), the total hydrogen column absorption to cm-2 (derived using the NHtot Swift tool101010https://www.swift.ac.uk/analysis/nhtot/; Willingale et al. 2013) and the GRB redshift to (de Ugarte Postigo et al., 2014a). Given that the number of data bins is low compared to the number of parameters of the model, we further reduce the model complexity. We assume no temporal evolution for the host galaxy dust and total hydrogen absorption, and we also pair the optical and X-ray spectral indexes of both SEDs. Additionally, we assume an Small Magellanic Cloud (SMC) profile for the host galaxy dust absorption (Schady et al., 2007). For the broken power law model, we also link the optical and the X-rays indexes as , following closure relations for slow cooling synchrotron spectrum with the cooling break between the optical and X-rays bands (e.g., Sari et al. 1998; Gao et al. 2013). We leave the energy break () as a free parameter constrained between the optical and the X-ray bands. The data are best fitted with a broken power law model with dof and -value; in comparison, a power law model yields worse statistics (dof and -value). The best-fitting parameters for the broken power law model are a spectral index (i.e. ), energy breaks at keV and keV (see Fig. 5). In the host galaxy rest frame, the reddening is (i.e. absorption of mag) and the total hydrogen absorption is cm-2. MW and Large Magellanic Cloud (LMC) dust profiles yield compatible results with mag and mag, respectively.
4 Discussion
Here, we discuss the nature of the fireball, shock properties and magnetic field structures in GRB 141220A, inferred from the measured properties of the observed light curves and optical polarization. In Section 4.1, we show that from the very start of our observations —beginning s post-GRB— the afterglow properties are consistent with those exhibited by classical forward shocks observed in optical afterglows at late times —hours to days after a GRB. In Section 4.2, we discuss all possible contributions to the low polarization of (2) from s to s post-burst and conclude that the polarization of the afterglow emission itself is very small. GRB 141220A polarization is expected from theoretical predictions but is at odds with the claim by Uehara et al. (2012) of polarized forward shock emission in GRB 091208B. In Section 4.3, we compare the multiwavelength properties of GRB 141220A and GRB 091208B, and put their properties into a wider context of other GRBs with dominant forward shocks emission and optical polarization data in the first hour after the burst.
4.1 A Classical Forward Shock at Early-Times
The optical emission of GRB 141220A decays with a temporal index in the BV/r-equivalent/R/I bands during LT observations (s post-burst), which is in agreement with reported from GTC observations at min post-burst (de Ugarte Postigo et al., 2014a). There is also no evidence of additional spectral components in the optical as there is no colour evolution through RINGO3 bands (see Fig. 4 bottom panel).
The Swift XRT X-ray emission can be modelled with a broken power law111111A power law fit presents worse statistics: /dof= 51.8/26 and p-value= 0.002. with and -value=0.9. It consists of plateau-like emission () followed by a steepening of the light curve () at s post-burst, which we identify as the normal afterglow decay phase (Nousek et al., 2006).
The optical and the X-rays domains satisfy closure relations for interstellar medium (ISM) profile, slow cooling regime and with the cooling break frequency () laying in between the bands (; Sari et al. 1998; Gao et al. 2013). The expected decay rate difference is consistent with the need of a spectral break in the SED modelling (Section 3.3.2). The cooling frequency is expected to evolve like with , which is compatible with derived from the two SEDs epochs. In closure relations conditions, the optical decay corresponds to a typical electron index (e.g., Spitkovsky 2008; Curran et al. 2010), a X-rays temporal decay of and spectral indexes and . These are in agreement with the ones measured: and (i.e. ).
4.2 What Can Contribute to the Polarization of Early-Time Forward Shocks?
Forward shock emission was predicted theoretically to be unpolarized (Medvedev & Loeb, 1999), as the external shock sweeps up circumburst material containing weak, tangled magnetic fields. This prediction was confirmed observationally with detections of low polarization in late-time afterglow measurements made hours to days after the burst (Hjorth et al., 1999; Covino et al., 1999; Wijers et al., 1999; Rol et al., 2000). These low polarizations were not thought to be intrinsic to the afterglow emission but to be associated with ISM dust or jet geometry effects (Covino et al., 2004). However, the early-time polarization detection of at s post-burst for GRB 091208B forward shock started a debate on the intrinsic polarization of forward shocks during the first s after the burst (Uehara et al., 2012). In contrast, our observations of GRB 141220A forward shock measure low polarization levels at early-times: (2) from to s post-burst and (2) up to s post-burst, which are comparable to late-time studies.
GRB 141220A is interesting for polarization observations at early times due to its brightness and a light curve decay typical of late-time forward shocks (; e.g. Waxman 1997). The optical emission does not present statistically significant "bumps" at early times (within ) —usually associated with inhomogeneities in the jet or the ISM (Lazzati et al., 2002; Nakar & Piran, 2003) —which reduces any issues regarding a possible break of the fireball symmetry that could introduce additional polarization signals (Lazzati et al., 2003; Granot & Königl, 2003; Nakar & Oren, 2004). We now discuss possible mechanisms that could produce the observed polarization at very early times.
4.2.1 Polarization Caused by the Jet Geometry
Due to the relativistic beaming effect, only a small region of the physical size of the jet is visible (). If the forward shock emission contains tangled magnetic fields in the plane of the shock with a coherence length of the order of plasma skin depth scales, the polarization is cancelled out for a face-on jet (Medvedev & Loeb, 1999). However, high polarization is expected when the spherical symmetry is broken. For a homogeneous jet, the polarization peaks before and after the jet break (Sari, 1999; Ghisellini & Lazzati, 1999) —when the ejecta has slowed down to (when on-axis) and the observer notices the edge of the jet (see also Rossi et al. (2004) for the case of structured jets).
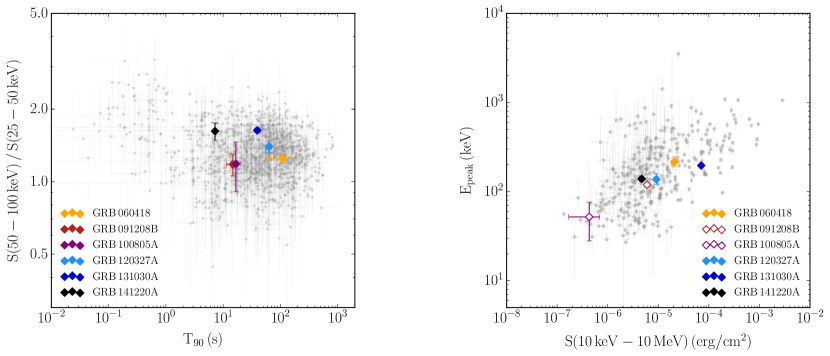
For GRB 141220A, there are no signs of a steepening of the X-rays light curve up to s post-burst. It is highly unlikely that we are detecting net polarization from a jet break during the first minutes after the explosion (Racusin et al., 2009) —requiring very small electron index. Additionally, edge-on/off-axis GRBs are predicted to have softer prompt emission, lower fluence and (e.g., Yamazaki et al. 2002; Yamazaki et al. 2003; Yamazaki et al. 2004; Beniamini & Nakar 2019; Gill et al. 2020); GRB 141220A is on the average of Konus-Wind sample (see Fig. 6 right; Tsvetkova et al. 2017, 2021).
4.2.2 Post-shock Induced Polarization: The GRB Environment
ISM dust can induce non-negligible levels of polarization to an unpolarized source via dichroic absorption (Serkowski et al., 1975). The light is preferably absorbed when the electric field is parallel to the long axis of the dust grains. Because the short axis aligns with the magnetic field, the polarization traces the projected direction of the local magnetic field and the physical properties of dust grains.
The wavelength-dependent behaviour of polarization was characterized with MW stars by the Serkowski empirical relation (Serkowski et al., 1975; Whittet et al., 1992), where is the wavelength at which the polarization is maximum, and is an upper limit on the induced polarization that depends on the number of dust grains and the efficiency of the alignment. More recently, there has been indications that this limit is higher () at low column densities in the MW (Ncm-2; Planck Collaboration et al. 2020b; Panopoulou et al. 2019). Additionally, Fosalba et al. (2002) found that for the range , the average polarization dependency with extinction can be fitted with .
The 11.5 mag star in the R/I band field-of-view presents polarization (2), which gives an estimate of the polarization induced by the Galactic ISM in the GRB 141220A line-of-sight. We note that the measured polarization agrees with the maximum expected () for at low column densities (cm-2). Using the Serkowski law, we determine that the polarization induced by the ISM in the BV band is .
In addition to the polarization induced by the Galactic dust, we have the contribution induced by the propagation of the light along the host galaxy ISM. GRB 141220A is within the top of the most extinguished GRBs of Covino et al. (2013) sample, with mag (i.e. ; Section 3.3.2). To check GRB 141220A host galaxy dust contribution to the intrinsic afterglow polarization, we assume that the redshifted Serkowski law is valid for the host galaxy SMC profile121212SMC and LMC polarimetric studies found that the Serkowski law was still valid —with smaller on average in the SMC (Clayton et al., 1983, 1996; Rodrigues et al., 1997) and polarimetric studies of M31 globular clusters measured with a different relationship (Clayton et al., 2004). with (e.g., Klose et al. 2004). Taking into account the dust-absorbed spectral slope of GRB 141220A (; Section 3.3.1), we estimate that the maximum induced polarization in RINGO3 bands is131313MW and LMC profiles yield similar results: and , respectively. (), with mean polarization .
As suggested in late-time (Lazzati et al., 2003; Covino et al., 2004; Wiersema et al., 2012) and early-time afterglow polarization studies (Jordana-Mitjans et al., 2020), differential light extinction from dust in the host galaxy can account for the observed polarization levels (). In Sections 4.2.3 and 4.2.4, we discuss the implications of a residual polarization intrinsic to GRB 141220A afterglow.
4.2.3 Contamination from a Polarized Reverse Shock
During the early afterglow, we expect contributions from the reverse and the forward shock. GRB 141220A optical light curves present no signature of reverse shock emission and the temporal and spectral properties satisfy closure relations for forward shock emission (Section 4.1). The absence of a reverse shock at early times suggests that is peaking at lower frequencies (Mundell et al., 2007b; Laskar et al., 2013; Kopač et al., 2015) or high magnetization in the jet, which suppresses the afterglow emission of the reverse shock (Zhang & Kobayashi, 2005).
The expected polarization of synchrotron emission is for a homogeneous field in the slow cooling regime and for an electron power law index (inferred from closure relations in Section 4.1; Rybicki & Lightman 1979). However, if we take into account the depolarization caused by the rotation of the polarization vector of each element in a shell due to relativistic kinematic effects, the maximum polarization of the reverse shock is reduced to (Lyutikov et al., 2003). Observationally, we have measured polarization in the range for mildly magnetized jets (GRB 090102, Steele et al. 2009; GRB 120308A, Mundell et al. 2013). Given the low polarization levels in GRB 141220A afterglow, we rule out significant contamination from the reverse shock.
The deceleration peak of the blastwave must have been at s after the GRB, well before SkyCam-Z observations, otherwise it would affect the shape of the observed light curve. From the light curve modelling141414We fit the optical light curves with a reverse/forward shock model assuming ISM, slow cooling regime and the spectral configuration ., a polarized reverse shock contributing equally at the deceleration time (Mundell et al., 2007a, b) reproduces the measured polarization levels () for peak times at s post-burst. We note that later deceleration times are permitted if the reverse shock is suppressed and/or less polarized than the expected (Laskar et al., 2019; Jordana-Mitjans et al., 2020).
4.2.4 Polarization from Collisionless Shocks
In matter-dominated jets, the magnetic fields do not influence the fireball dynamics but they still play a crucial role in efficient synchrotron emission and particle acceleration in collisionless shocks. The afterglow modelling usually indicates equipartition magnetic energy densities of (Panaitescu & Kumar, 2002; Beniamini et al., 2015; Wang et al., 2015). However, for the forward shock, we are left with the magnetic field of the circumburst medium that has a few G ( for ISM; Medvedev & Loeb 1999). Therefore, in order to increase the magnetic energy density several orders of magnitudes, we need some mechanism to amplify the magnetic field that cannot be achieved by shock compression alone, e.g.: via plasma instabilities (e.g., Weibel instability; Medvedev & Loeb 1999; Nishikawa et al. 2009) or by macroscopic turbulences due to preshock density inhomogeneities (Sironi & Goodman, 2007; Inoue et al., 2011). In both cases, the magnetic field will have coherent length scales () smaller than the observable emission area of the jet (), e.g.: cm are expected for Weibel instability (Medvedev & Loeb, 1999) and cm for macroscopic turbulences (Sironi & Goodman, 2007). Magnetohydrodynamics simulations predict for Richtmyer-Meshkov instability (Inoue et al., 2011), which is in agreement with GRB 141220A forward shock polarization.
Observationally, we can estimate the coherent length scale of the magnetic field assuming a polarization model with magnetic domains (Gruzinov & Waxman, 1999; Uehara et al., 2012). If each patch contains ordered magnetic fields, the local polarization would be the theoretical expected for synchrotron emission when accounting for relativistic kinematic effects (Lyutikov et al., 2003). Because the polarization angle is randomly oriented in each magnetic domain, the total observed polarization will be reduced by the number of visible patches () as . The observable region of the jet () increases when the ejecta decelerates —where is the emission radius and is the Lorentz factor the blastwave. Therefore, more patches will be visible with time, which will cause random fluctuations in the polarization angle and the polarization degree will gradually decrease. Following Uehara et al. (2012) derivation, we estimate the coherent length scales of the magnetic field as given that and (Sari, 1997). Consequently,
| (1) |
where is the isotropic-equivalent kinetic energy, the circumburst medium density and is the rest-frame time after the burst. is related to the isotropic energy released in -rays as ; we adopt for the radiative efficiency parameter. If we assume that the observed polarization is intrinsic to the forward shock and erg (Tsvetkova et al., 2017), the coherent length scale of the magnetic field is cm.
4.3 Polarization Properties of Forward Shocks
| GRB | z | AV,MW | AV,HG,rest | N | N | |||
|---|---|---|---|---|---|---|---|---|
| (s) | () | (cm-2) | (cm-2) | |||||
| 060418 | 1.49 | 0.70 | 1.59 | |||||
| 091208B | 1.063 | 0.16 | 0.58 | |||||
| 100805A | 1.85 | 0.58 | - | 2.64 | a | |||
| 120327A | 2.81 | 1.04 | 2.66 | |||||
| 131030A | 1.294 | 0.18 | 0.56 | |||||
| 141220A | 1.3195 | 0.04 | 0.13 |
| GRB | Eiso | ||||
|---|---|---|---|---|---|
| (s) | (keV) | ( erg) | (s) | ||
| 060418 | 198 | ||||
| 091208B | >184 | ||||
| 100805A | a | a | >157 | ||
| 120327A | >195 | ||||
| 131030A | >206 | ||||
| 141220A | >189 |
-
a
References: GRB 060418 (Dupree et al., 2006; Mundell et al., 2007a; Schady et al., 2007; Molinari et al., 2007; Tsvetkova et al., 2021), GRB 091208B (Wiersema et al., 2009; Nakajima et al., 2009; Uehara et al., 2012; Schady et al., 2012; Nava et al., 2012), GRB 100805A (Oates et al., 2012; Steele et al., 2017), GRB 120327A (Perley & Tanvir, 2012; D’Elia et al., 2014; Steele et al., 2017; Melandri et al., 2017; Tsvetkova et al., 2021), GRB 131030A (Breeveld & Troja, 2013; de Ugarte Postigo et al., 2013; Xu et al., 2013; King et al., 2014; Littlejohns et al., 2015; Tsvetkova et al., 2017) and GRB 141220A (de Ugarte Postigo et al. 2014a; Tsvetkova et al. 2017; this work).
-
a
a GRB 100805A N is derived from Swift XRT keV spectra and the Epeak and Eiso are computed from Swift BAT keV spectra.
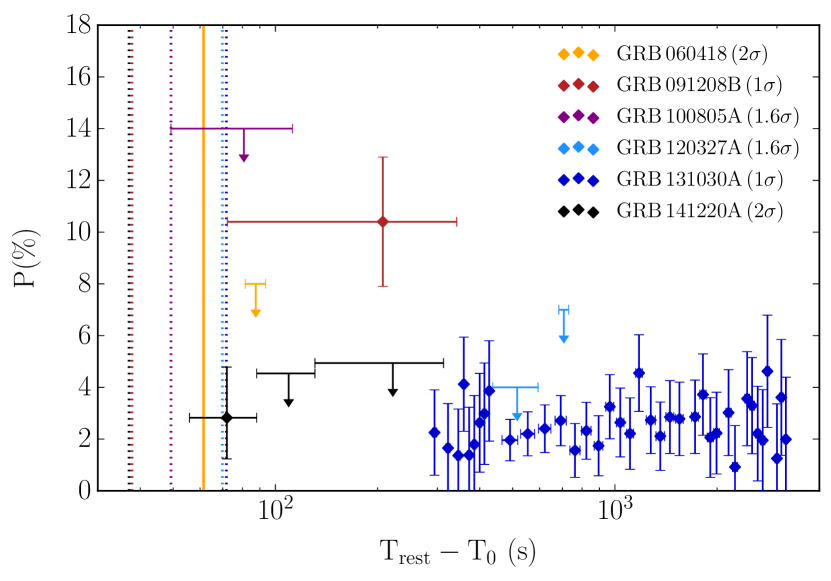
Very early-time follow-up is still rare and dominated by small robotic telescopes, hence there is only a small sample of bright optical afterglows with polarization measurements (e.g., Steele et al. 2017). For those GRBs with polarization measurements, optical light curves consistent with a power-law decay and with the emission interpreted as forward shock emission (at least of the total photons), we summarize their rest-frame properties in Fig. 7 and Table 4.
For all GRBs in Table 4 sample, the polarization observations are well after the end of prompt emission () and no contamination from prompt photons is expected (e.g., GRB 160625B, Troja et al. 2017; GRB 190114C, Jordana-Mitjans et al. 2020). We note that GRB 120327A optical light curve has a similar decay to GRB 141220A with (Steele et al., 2017), GRB 091208B/GRB 100805A/GRB 131030A have shallower light curves with (Uehara et al., 2012; King et al., 2014; Steele et al., 2017) and GRB 060418 measurement was taken during the broad peak of the fireball deceleration (decaying later with ; Mundell et al. 2007a). Table 4 GRBs are characterized as long in the duration-hardness clustering of Swift BAT sample (Kouveliotou et al., 1993; Lien et al., 2016) —with GRB 141220A being the shortest and one of the hardest (see Fig. 6 left). GRB 141220A fluence and peak energy is on the average of the Swift BAT sample (see Fig. 6 right). They also follow the Amati relation (Eiso-Epeak,rest correlation; Amati et al. 2002) within and of the scatter around the best-fitting line of Tsvetkova et al. (2021) and Nava et al. (2012), respectively. To derive the bulk Lorentz factor (; Table 4), we assume ISM profile and thin shell regime and we use Sari & Piran (1999) derivation
| (2) |
where is the deceleration time of the fireball and is the proton mass. The , and limits of Table 4 GRBs are compatible within of Ghirlanda et al. (2018) sample median.
GRB 120327A (Steele et al., 2017) and GRB 131030A (King et al., 2014) measured low values of polarization for forward shock emission, similar to our early-time result for GRB 141220A (see Fig. 7). Furthermore, King et al. (2014) also interpreted the polarization measurements to be dust-induced (from the MW). However, GRB 091208B (Uehara et al., 2012) polarization is significantly higher than for those GRBs. GRB 091208B and GRB 141220A have similar high-energy properties (Eiso, Epeak and fluence) but different polarization and afterglow decays (i.e. electron index; see Table 4). Uehara et al. (2012) measured for GRB 091208B forward shock at a rest-frame time s, which corresponds to (see Eq. 1). This magnetic field length scale predicts polarization for GRB 141220A at the time of observations —far in excess of that measured. Therefore, given that GRB 091208B and GRB 141220A have similar Eiso, either the magnetic field length scale is almost an order of magnitude smaller in GRB 141220A or the circumburst medium density is times greater in GRB 091208B —such that Uehara et al. (2012) observed a smaller emitting region. However, we note that this would result in significant differences in both afterglows. Without the fine-tuning of the microphysical parameters in
| (3) | |||
and ignoring Synchrotron Self Compton effects (Y is the Inverse Compton parameter; e.g. Zhang et al. 2007), the cooling frequency would be already under the optical band at the start of GRB 091208B observations or over the X-ray band for GRB 141220A —inconsistent with the optical and X-ray data of both GRBs. Additionally, GRB 091208B high polarization was measured from a wide time-window and it is an average of the time-evolving polarization vector —favouring a more stable large-scale magnetic field component comparable to the reverse shock in GRB 090102 (Steele et al., 2009). This suggests that GRB 091208B afterglow could have contribution from a polarized reverse shock component (e.g., Section 4.2.3), be the emission of a long-lasting polarized reverse shock (Uhm & Beloborodov, 2007) or less likely —because the light curve is consistent with ISM profile— be embedded in the magnetized wind from the progenitor (Granot & Königl, 2003).
5 Conclusions
We used the 2-m autonomous robotic optical Liverpool Telescope to measure the early optical afterglow of Swift GRB141220A and its multi-colour polarization. The polarization is already low (2) at s after the burst (i.e. s in the GRB rest-frame) in the RINGO3 BV band, and continues to be low (2) to s post-burst.
The temporal and spectral properties of the afterglow emission are consistent with a classical forward shock. We exclude alternative interpretations: a special viewing angle to an off-axis jet, which would require an anomalously low electron index, or an edge-on jet, for which achromatic breaks would be expected but are not observed.
Extinction through the Milky Way along the line-of-sight to GRB 141220A is low; the Galactic dust is expected to induce only polarization. We investigate different mechanisms that can contribute to the total polarization budget ():
-
1.
The obscuration in the GRB host galaxy is high; we estimate that host galaxy dust could induce up to at most —consistent with our observations.
-
2.
Reverse shocks are usually only detectable in the first minutes after the burst if bright —their afterglows have distinct temporal properties and fade more quickly than the slowly emerging forward shock radiation. Theoretical predictions that reverse shocks should be polarized () has been confirmed observationally in mildly magnetized GRBs (). A reverse shock tail at the time of GRB 141220A polarization observations is very likely.
-
3.
Forward shocks are theoretically predicted to be unpolarized or very lowly polarized with ; late-time observations of forward shocks —when any primordial field has dissipated hours to a day after the burst— and GRB 141220A early-time observations confirm this.
The nature of very early-time polarization properties of forward shocks, however, remains debated. Uehara et al. (2012) detected in the first minutes post-burst in GRB 091208B. They interpreted their result as the first detection of significant polarization from a forward shock. The high energy properties (Eiso, Epeak and fluence) of GRB 141220A and GRB 091208B are similar, so a direct comparison of their properties is valuable. The magnetic field length scale of GRB 091208B forward shock implies polarization at the time of GRB 141220A observations, which does not agree with our observations. We find that it is not likely that GRB 091208B and GRB 141220A external mediums have extreme densities and we suggest larger coherent length scales for the magnetic field of GRB 091208B, due to the presence of a large-scale magnetic field from the reverse shock.
Overall, this leads to the conclusion that forward shocks in GRBs are polarized in the first few minutes after the burst and coherence scales of the generated magnetic fields are consistent with theoretical predictions. Therefore, any significant polarization measurement at early times suggests reverse shock (or prompt) emission origin.
Acknowledgements
We thank the anonymous referee for the constructive comments that improved the paper. The Liverpool Telescope is operated on the island of La Palma by Liverpool John Moores University in the Spanish Observatorio del Roque de los Muchachos of the Instituto de Astrofisica de Canarias with financial support from the UK Science and Technology Facilities Council. This work made use of data supplied by the UK Swift Science Data Centre at the University of Leicester. The research leading to these results has received funding from the European Union’s Horizon 2020 Programme under the AHEAD project (grant agreement 654215). N.J. and C.G.M. acknowledge financial support from Mr Jim Sherwin and Mrs Hiroko Sherwin. C.G.M. acknowledges support from the Science and Technology Facilities Council and the UK Research and Innovation (ST/N001265/1). A.G. acknowledges the financial support from the Slovenian Research Agency (grants P1-0031, I0-0033, J1-8136, J1-2460).
Data Availability
The data underlying this article are available in the article and in its online supplementary material.
References
- Abbott et al. (2017a) Abbott B. P., et al., 2017a, Physical Review Letters, 119, 161101
- Abbott et al. (2017b) Abbott B., et al., 2017b, ApJ, 848, L12
- Alam et al. (2015) Alam S., et al., 2015, ApJS, 219, 12
- Amati et al. (2002) Amati L., et al., 2002, A&A, 390, 81
- Arnaud et al. (1999) Arnaud K., Dorman B., Gordon C., 1999, XSPEC: An X-ray spectral fitting package, Astrophysics Source Code Library (ascl:9910.005)
- Arnold (2017) Arnold D., 2017, PhD thesis, Liverpool John Moores University, 10.24377/LJMU.t.00006687
- Arnold et al. (2012) Arnold D. M., Steele I. A., Bates S. D., Mottram C. J., Smith R. J., 2012, in Ground-based and Airborne Instrumentation for Astronomy IV. p. 84462J, doi:10.1117/12.927000
- Beniamini & Nakar (2019) Beniamini P., Nakar E., 2019, MNRAS, 482, 5430
- Beniamini et al. (2015) Beniamini P., Nava L., Duran R. B., Piran T., 2015, MNRAS, 454, 1073
- Berger (2014) Berger E., 2014, ARA&A, 52, 43
- Blackburn (1995) Blackburn J. K., 1995, FTOOLS: A FITS Data Processing and Analysis Software Package. p. 367
- Bradley et al. (2016) Bradley L., et al., 2016, Photutils: Photometry tools (ascl:1609.011)
- Breeveld & Troja (2013) Breeveld A. A., Troja E., 2013, GRB Coordinates Network, 15414, 1
- Bromberg et al. (2013) Bromberg O., Nakar E., Piran T., Sari R., 2013, ApJ, 764, 179
- Buckley et al. (2020) Buckley D. A. H., et al., 2020, arXiv e-prints, p. arXiv:2009.14081
- Burgess et al. (2019) Burgess J. M., Kole M., Berlato F., Greiner J., Vianello G., Produit N., Li Z. H., Sun J. C., 2019, A&A, 627, A105
- Chattopadhyay et al. (2019) Chattopadhyay T., et al., 2019, ApJ, 884, 123
- Clarke & Neumayer (2002) Clarke D., Neumayer D., 2002, A&A, 383, 360
- Clayton et al. (1983) Clayton G. C., Martin P. G., Thompson I., 1983, ApJ, 265, 194
- Clayton et al. (1996) Clayton G. C., Green J., Wolff M. J., Zellner N. E. B., Code A. D., Davidsen A. F., WUPPE Science Team HUT Science Team 1996, ApJ, 460, 313
- Clayton et al. (2004) Clayton G. C., Wolff M. J., Gordon K. D., Smith P. S., Nordsieck K. H., Babler B. L., 2004, AJ, 127, 3382
- Coburn & Boggs (2003) Coburn W., Boggs S. E., 2003, Nature, 423, 415
- Covino et al. (1999) Covino S., et al., 1999, A&A, 348, L1
- Covino et al. (2004) Covino S., Ghisellini G., Lazzati D., Malesani D., 2004, Polarization of Gamma-Ray Burst Optical and Near-Infrared Afterglows. p. 169
- Covino et al. (2013) Covino S., et al., 2013, MNRAS, 432, 1231
- Cummings et al. (2014) Cummings J. R., D’Elia V., Gehrels N., Lien A. Y., Palmer D. M., Sbarufatti B., Siegel M. H., 2014, GRB Coordinates Network, 17196, 1
- Curran et al. (2010) Curran P. A., Evans P. A., de Pasquale M., Page M. J., van der Horst A. J., 2010, ApJ, 716, L135
- D’Elia et al. (2014) D’Elia V., et al., 2014, A&A, 564, A38
- Dupree et al. (2006) Dupree A. K., Falco E., Prochaska J. X., Chen H. W., Bloom J. S., 2006, GRB Coordinates Network, 4969, 1
- Evans et al. (2009) Evans P. A., et al., 2009, MNRAS, 397, 1177
- Fosalba et al. (2002) Fosalba P., Lazarian A., Prunet S., Tauber J. A., 2002, ApJ, 564, 762
- Gao et al. (2013) Gao H., Lei W.-H., Zou Y.-C., Wu X.-F., Zhang B., 2013, New Astron. Rev., 57, 141
- Ghirlanda et al. (2018) Ghirlanda G., et al., 2018, A&A, 609, A112
- Ghisellini & Lazzati (1999) Ghisellini G., Lazzati D., 1999, MNRAS, 309, L7
- Gill & Granot (2021) Gill R., Granot J., 2021, MNRAS, 504, 1939
- Gill et al. (2020) Gill R., Granot J., Kumar P., 2020, MNRAS, 491, 3343
- Golenetskii et al. (2014) Golenetskii S., et al., 2014, GRB Coordinates Network, 17207, 1
- Gompertz et al. (2014) Gompertz B. P., et al., 2014, GRB Coordinates Network, 17203, 1
- Granot & Königl (2003) Granot J., Königl A., 2003, ApJ, 594, L83
- Greiner et al. (2003) Greiner J., et al., 2003, Nature, 426, 157
- Gruzinov & Waxman (1999) Gruzinov A., Waxman E., 1999, ApJ, 511, 852
- Guidorzi et al. (2006) Guidorzi C., et al., 2006, PASP, 118, 288
- Hiltner (1949) Hiltner W. A., 1949, Science, 109, 165
- Hjorth et al. (1999) Hjorth J., et al., 1999, Science, 283, 2073
- Høg et al. (2000) Høg E., et al., 2000, A&A, 355, L27
- Inoue et al. (2011) Inoue T., Asano K., Ioka K., 2011, ApJ, 734, 77
- Jordana-Mitjans et al. (2020) Jordana-Mitjans N., et al., 2020, ApJ, 892, 97
- King et al. (2014) King O. G., et al., 2014, MNRAS, 445, L114
- Klose et al. (2004) Klose S., Palazzi E., Masetti N., Stecklum B., Greiner J., Hartmann D. H., Schmid H. M., 2004, A&A, 420, 899
- Kobayashi (2000) Kobayashi S., 2000, ApJ, 545, 807
- Kole et al. (2020) Kole M., et al., 2020, A&A, 644, A124
- Komissarov et al. (2009) Komissarov S. S., Vlahakis N., Königl A., Barkov M. V., 2009, MNRAS, 394, 1182
- Kopač et al. (2015) Kopač D., et al., 2015, ApJ, 806, 179
- Kouveliotou et al. (1993) Kouveliotou C., Meegan C. A., Fishman G. J., Bhat N. P., Briggs M. S., Koshut T. M., Paciesas W. S., Pendleton G. N., 1993, ApJ, 413, L101
- Laskar et al. (2013) Laskar T., et al., 2013, ApJ, 776, 119
- Laskar et al. (2019) Laskar T., et al., 2019, ApJ, 878, L26
- Lazarian (2007) Lazarian A., 2007, J. Quant. Spectrosc. Radiative Transfer, 106, 225
- Lazzati et al. (2002) Lazzati D., Rossi E., Covino S., Ghisellini G., Malesani D., 2002, A&A, 396, L5
- Lazzati et al. (2003) Lazzati D., et al., 2003, A&A, 410, 823
- Lien et al. (2016) Lien A., et al., 2016, ApJ, 829, 7
- Littlejohns et al. (2015) Littlejohns O. M., et al., 2015, MNRAS, 449, 2919
- Lyutikov et al. (2003) Lyutikov M., Pariev V. I., Blandford R. D., 2003, ApJ, 597, 998
- Marshall & Cummings (2014) Marshall F. E., Cummings J. R., 2014, GRB Coordinates Network, 17201, 1
- Medvedev & Loeb (1999) Medvedev M. V., Loeb A., 1999, ApJ, 526, 697
- Medvedev et al. (2005) Medvedev M. V., Fiore M., Fonseca R. A., Silva L. O., Mori W. B., 2005, ApJ, 618, L75
- Melandri et al. (2017) Melandri A., et al., 2017, A&A, 607, A29
- Mészáros (2002) Mészáros P., 2002, Annual Review of Astronomy and Astrophysics, 40, 137
- Molinari et al. (2007) Molinari E., et al., 2007, A&A, 469, L13
- Mundell et al. (2007a) Mundell C. G., et al., 2007a, Science, 315, 1822
- Mundell et al. (2007b) Mundell C. G., et al., 2007b, ApJ, 660, 489
- Mundell et al. (2013) Mundell C. G., et al., 2013, Nature, 504, 119
- Nakajima et al. (2009) Nakajima H., Yatsu Y., Mori Y. A., Endo A., Shimokawabe T., Kawai N., 2009, GRB Coordinates Network, 10260, 1
- Nakar & Oren (2004) Nakar E., Oren Y., 2004, ApJ, 602, L97
- Nakar & Piran (2003) Nakar E., Piran T., 2003, ApJ, 598, 400
- Nava et al. (2012) Nava L., et al., 2012, MNRAS, 421, 1256
- Nishikawa et al. (2003) Nishikawa K. I., Hardee P., Richardson G., Preece R., Sol H., Fishman G. J., 2003, ApJ, 595, 555
- Nishikawa et al. (2009) Nishikawa K. I., et al., 2009, ApJ, 698, L10
- Nousek et al. (2006) Nousek J. A., et al., 2006, ApJ, 642, 389
- Oates et al. (2012) Oates S. R., Page M. J., De Pasquale M., Schady P., Breeveld A. A., Holland S. T., Kuin N. P. M., Marshall F. E., 2012, MNRAS, 426, L86
- Panaitescu & Kumar (2002) Panaitescu A., Kumar P., 2002, ApJ, 571, 779
- Panopoulou et al. (2019) Panopoulou G. V., Hensley B. S., Skalidis R., Blinov D., Tassis K., 2019, A&A, 624, L8
- Perley & Tanvir (2012) Perley D. A., Tanvir N. R., 2012, GRB Coordinates Network, 13133, 1
- Piran (1999) Piran T., 1999, Phys. Rep., 314, 575
- Piran (2004) Piran 2004, Reviews of Modern Physics, 76, 1143
- Planck Collaboration et al. (2020a) Planck Collaboration et al., 2020a, A&A, 641, A6
- Planck Collaboration et al. (2020b) Planck Collaboration et al., 2020b, A&A, 641, A12
- Racusin et al. (2009) Racusin J. L., et al., 2009, ApJ, 698, 43
- Rees & Meszaros (1992) Rees M. J., Meszaros P., 1992, MNRAS, 258, 41
- Rees & Meszaros (1994) Rees M. J., Meszaros P., 1994, ApJ, 430, L93
- Rodrigues et al. (1997) Rodrigues C. V., Magalhães A. M., Coyne G. V., Piirola S. J. V., 1997, ApJ, 485, 618
- Rol et al. (2000) Rol E., et al., 2000, ApJ, 544, 707
- Rossi et al. (2004) Rossi E. M., Lazzati D., Salmonson J. D., Ghisellini G., 2004, MNRAS, 354, 86
- Rutledge & Fox (2004) Rutledge R. E., Fox D. B., 2004, MNRAS, 350, 1288
- Rybicki & Lightman (1979) Rybicki G. B., Lightman A. P., 1979, Radiative processes in astrophysics
- Sari (1997) Sari R., 1997, ApJ, 489, L37
- Sari (1999) Sari R., 1999, ApJ, 524, L43
- Sari & Piran (1999) Sari R., Piran T., 1999, ApJ, 520, 641
- Sari et al. (1998) Sari R., Piran T., Narayan R., 1998, ApJ, 497, L17
- Schady et al. (2007) Schady P., et al., 2007, MNRAS, 377, 273
- Schady et al. (2012) Schady P., et al., 2012, A&A, 537, A15
- Schlegel et al. (1998) Schlegel D. J., Finkbeiner D. P., Davis M., 1998, ApJ, 500, 525
- Schmidt et al. (1992) Schmidt G. D., Elston R., Lupie O. L., 1992, AJ, 104, 1563
- Serkowski et al. (1975) Serkowski K., Mathewson D. S., Ford V. L., 1975, ApJ, 196, 261
- Shahmoradi & Nemiroff (2015) Shahmoradi A., Nemiroff R. J., 2015, MNRAS, 451, 126
- Shawl & Tarenghi (1976) Shawl S. J., Tarenghi M., 1976, ApJ, 204, L25
- Silva et al. (2003) Silva L. O., Fonseca R. A., Tonge J. W., Dawson J. M., Mori W. B., Medvedev M. V., 2003, ApJ, 596, L121
- Sironi & Goodman (2007) Sironi L., Goodman J., 2007, ApJ, 671, 1858
- Słowikowska et al. (2016) Słowikowska A., Krzeszowski K., Żejmo M., Reig P., Steele I., 2016, MNRAS, 458, 759
- Spitkovsky (2008) Spitkovsky A., 2008, ApJ, 682, L5
- Stamatikos et al. (2014) Stamatikos M., et al., 2014, GRB Coordinates Network, 17202, 1
- Steele et al. (2004) Steele I. A., et al., 2004, in Oschmann Jacobus M. J., ed., Society of Photo-Optical Instrumentation Engineers (SPIE) Conference Series Vol. 5489, Proc. SPIE. pp 679–692, doi:10.1117/12.551456
- Steele et al. (2009) Steele I. A., Mundell C. G., Smith R. J., Kobayashi S., Guidorzi C., 2009, Nature, 462, 767
- Steele et al. (2017) Steele I. A., et al., 2017, ApJ, 843, 143
- Troja et al. (2017) Troja E., et al., 2017, Nature, 547, 425
- Tsvetkova et al. (2017) Tsvetkova A., et al., 2017, ApJ, 850, 161
- Tsvetkova et al. (2021) Tsvetkova A., et al., 2021, ApJ, 908, 83
- Turnshek et al. (1990) Turnshek D. A., Bohlin R. C., Williamson R. L. I., Lupie O. L., Koornneef J., Morgan D. H., 1990, AJ, 99, 1243
- Uehara et al. (2012) Uehara T., et al., 2012, ApJ, 752, L6
- Uhm & Beloborodov (2007) Uhm Z. L., Beloborodov A. M., 2007, ApJ, 665, L93
- Wang et al. (2015) Wang X.-G., et al., 2015, ApJS, 219, 9
- Waxman (1997) Waxman E., 1997, ApJ, 485, L5
- Weibel (1959) Weibel E. S., 1959, Phys. Rev. Lett., 2, 83
- Whittet et al. (1992) Whittet D. C. B., Martin P. G., Hough J. H., Rouse M. F., Bailey J. A., Axon D. J., 1992, ApJ, 386, 562
- Wiersema et al. (2009) Wiersema K., Tanvir N. R., Cucchiara A., Levan A. J., Fox D., 2009, GRB Coordinates Network, 10263, 1
- Wiersema et al. (2012) Wiersema K., et al., 2012, MNRAS, 426, 2
- Wijers et al. (1999) Wijers R. A. M. J., et al., 1999, ApJ, 523, L33
- Willingale et al. (2013) Willingale R., Starling R. L. C., Beardmore A. P., Tanvir N. R., O’Brien P. T., 2013, MNRAS, 431, 394
- Willis et al. (2005) Willis D. R., et al., 2005, A&A, 439, 245
- Woosley (1993) Woosley S. E., 1993, ApJ, 405, 273
- Xu et al. (2013) Xu D., Fynbo J. P. U., Jakobsson P., Cano Z., Milvang-Jensen B., Malesani D., de Ugarte Postigo A., Hayes M., 2013, GRB Coordinates Network, 15407, 1
- Yamazaki et al. (2002) Yamazaki R., Ioka K., Nakamura T., 2002, ApJ, 571, L31
- Yamazaki et al. (2003) Yamazaki R., Yonetoku D., Nakamura T., 2003, ApJ, 594, L79
- Yamazaki et al. (2004) Yamazaki R., Ioka K., Nakamura T., 2004, ApJ, 607, L103
- Yano et al. (2014) Yano Y., et al., 2014, GRB Coordinates Network, 17215, 1
- Yu (2014) Yu H. F., 2014, GRB Coordinates Network, 17205, 1
- Zhang & Kobayashi (2005) Zhang B., Kobayashi S., 2005, ApJ, 628, 315
- Zhang et al. (2007) Zhang B., et al., 2007, ApJ, 655, 989
- de Ugarte Postigo et al. (2013) de Ugarte Postigo A., Thoene C. C., Sanchez-Ramirez R., Gorosabel J., Fynbo J. P. U., Tanvir N. R., Alvarez Iglesias C. A., 2013, GRB Coordinates Network, 15408, 1
- de Ugarte Postigo et al. (2014a) de Ugarte Postigo A., Thoene C. C., Gorosabel J., Tanvir N., Fynbo J. P. U., Pesev P., Gomez Velarde G., Perez Valladares D., 2014a, GRB Coordinates Network, 17198, 1
- de Ugarte Postigo et al. (2014b) de Ugarte Postigo A., Thoene C. C., Gorosabel J., Tanvir N. R., Fynbo J. P. U., Pesev P., Gomez Velarde G., Perez Valladares D., 2014b, GRB Coordinates Network, 17200, 1