IQ Collaboratory III: The Empirical Dust Attenuation Framework — Taking Hydrodynamical Simulations with a Grain of Dust
Abstract
We present the Empirical Dust Attenuation (EDA) framework — a flexible prescription for assigning realistic dust attenuation to simulated galaxies based on their physical properties. We use the EDA to forward model synthetic observations for three state-of-the-art large-scale cosmological hydrodynamical simulations: SIMBA, IllustrisTNG, and EAGLE. We then compare the optical and UV color-magnitude relations, and , of the simulations to a and UV complete SDSS galaxy sample using likelihood-free inference. Without dust, none of the simulations match observations, as expected. With the EDA, however, we can reproduce the observed color-magnitude with all three simulations. Furthermore, the attenuation curves predicted by our dust prescription are in good agreement with the observed attenuation–slope relations and attenuation curves of star-forming galaxies. However, the EDA does not predict star-forming galaxies with low since simulated star-forming galaxies are intrinsically much brighter than observations. Additionally, the EDA provides, for the first time, predictions on the attenuation curves of quiescent galaxies, which are challenging to measure observationally. Simulated quiescent galaxies require shallower attenuation curves with lower amplitude than star-forming galaxies. The EDA, combined with forward modeling, provides an effective approach for shedding light on dust in galaxies and probing hydrodynamical simulations. This work also illustrates a major limitation in comparing galaxy formation models: by adjusting dust attenuation, simulations that predict significantly different galaxy populations can reproduce the same UV and optical observations.
1 Introduction
Dust in the interstellar medium of a galaxy can dramatically impact its spectral energy distribution (SED). The combined effect of dust on a galaxy’s SED is typically described using an attenuation curve, , which has now been broadly characterized by observations. In UV, attenuation curves steeply rise due to absorption by small grains. At , in the near-UV (NUV), there is an absorption bump referred to as the “UV dust bump”. At longer optical wavelengths, the curves take on a power-law shape. Finally, dust reemits the light attenuated in the optical and UV in the infrared (for an overview see Calzetti, 2001; Draine, 2003; Galliano et al., 2018). By impacting the SED, dust also affects the physical properties of a galaxy that are inferred from the SED, such as its star formation rate (), stellar mass (), or star formation history (see reviews by Walcher et al., 2011; Conroy, 2013). Assumptions on dust attenuation can dramatically vary these properties (Kriek & Conroy, 2013; Reddy et al., 2015; Salim et al., 2016; Salim & Narayanan, 2020). Since these properties are the building blocks to our understanding of galaxies and how they evolve, a better understanding of dust not only provides insights into dust, but also underpins all galaxy studies.
To better understand dust in galaxies, many observational works have examined trends between dust attenuation and galaxy properties. For example, UV and optical attenuation are found to correlate with galaxy properties such as , , and metallicity in star-forming galaxies (Garn & Best, 2010; Battisti et al., 2016, for a recent review see Salim & Narayanan 2020). The slope of the attenuation curves in star-forming galaxies also correlate with galaxy properties, such as , specific (), metallicity, and axial ratio (Wild et al., 2011; Battisti et al., 2017). Despite the progress, there is still no clear consensus on the connection between dust attenuation and galaxy properties. Furthermore, studies so far have focused mainly on star-forming galaxies and little is known about dust attenuation in quiescent galaxies. A major limitation of observational approaches is that dust attenation and galaxy properties measured from galaxy SEDs are model-dependent and subject to variations, inconsistencies, and biases of different methodologies. Different methods can measure vastly different derived values, even for the same observations (e.g. Speagle et al., 2014; Katsianis et al., 2020, see also Appendix A). SED modeling can also impose undesirable priors on derived galaxy properties (Carnall et al., 2018; Leja et al., 2019) and suffer from parameter degeneracies that are poorly understood.
Significant progress has also been made in theoretically modeling dust. Simulations can now model the radiative transfer of stellar light through a dusty ISM for a wide range of configurations: from simple slab-like dust geometries (e.g. Witt & Gordon, 1996, 2000; Seon & Draine, 2016) to 3D hydrodynamical simulations of entire galaxies (e.g. Jonsson, 2006; Rocha et al., 2008; Hayward & Smith, 2015; Natale et al., 2015; Hou et al., 2017). Radiative transfer models have even been applied to cosmological hydrodynamical simulations (e.g. Camps & Baes, 2015; Narayanan et al., 2018; Cochrane et al., 2019; Rodriguez-Gomez et al., 2019; Trayford et al., 2020). Dust has also been examined in a cosmological context using semi-analytic models (SAMs; e.g. Granato et al., 2000; Fontanot et al., 2009; Wilkins et al., 2012; Gonzalez-Perez et al., 2013; Popping et al., 2017). Yet there are still major limitations in modeling dust. Dust models in cosmological simulations currently do not reproduce the redshift evolution of dust properties (Somerville et al., 2012; Yung et al., 2019; Vogelsberger et al., 2020, but see Li et al., 2019) and radiative transfer models produce attenuation-slope relations that are significantly steeper than observations. Many models also require significant hand-tuning (e.g. propagating rays/photons into particular cells) and make assumptions on the underlying dust grain models (see Steinacker et al., 2013, for a review). Lastly, radiative transfer models are computationally expensive. Applying a range of radiative transfer dust models to multiple simulations for comparisons would require huge computational resources. Using them with Monte Carlo sampling methods for parameter exploration or to marginalize over the impact of dust would be prohibitive.
We take a different approach from the observational and theoretical works above — we investigate dust attenuation using a forward modeling approach to compare simulations to observations. Our “forward model” starts with three major large-scale hydrodynamical simulations: EAGLE (Schaye et al., 2015), IllustrisTNG (Nelson et al., 2019), and SIMBA (Davé et al., 2019). We use their outputs (e.g. star formation history) to build SEDs for each simulated galaxy. We then apply dust attenuation to the SEDs using the Empirical Dust Attenuation (EDA) framework, which we describe shortly. We construct photometry from the attenuated SEDs and afterwards apply a realistic noise model and sample selection function to construct synthetic observations. Finally, we compare the synthetic observations to actual observations and constrain the free parameters of our EDA prescription. The EDA parameter constraints then provide insight into dust attenation and its connection to galaxies.
The Empirical Dust Attenuation framework provides a flexible and computationally inexpensive prescription for statistically assigning attenatuion curves to simulated galaxy based on their physical properties. In this work, we assign attenuation curves based on , , and the EDA parameters, as well as randomly sampled galaxy inclinations that introduces stochasticity. The EDA parameters set the strength of the and dependence in the amplitude and slope of the attenuation curves. Unlike radiative transfer models, the EDA does not seek to produce realistic dust attenuation for individual galaxies. However, as we later demonstrate, it produces realistic distributions of dust attenuation for galaxy populations. The EDA provides an empirical framework for dust attenuation, analogous to the halo occupation framework in galaxy formation (for a review see Wechsler & Tinker, 2018).
With a forward modeling approach, we compare simulations to observations entirely in observational space, so we are not impacted by the inconsistencies of observational methods for measuring galaxy properties. Forward models can also directly include the selection functions and observational systematic effects so they can account for these effects to exploit the full observational data set. Furthermore, since we use the EDA in our forward model, we can apply a wide range of realistic dust attenuation curves to simulated galaxies in a matter of seconds, unlike radiative transfer models. This means we can easily explore and sample the dust parameter space and infer the relationship between dust attenuation and galaxy properties. That is the focus of this paper. Beyond investigating dust, the EDA also provides a framework where we can treat dust as nuisance parameters and tractably marginalize over dust attenuation. In the subsequent paper of the IQ series, Starkenburg et al. (in preparation), we will use the EDA framework to compare star formation quenching in cosmological galaxy formation models after marginalizing over dust attenuation.
In Section 2, we describe the three large-scale cosmological hydrodynamical simulations (SIMBA, IllustrisTNG, and EAGLE) that we use in our forward model along with the observed SDSS galaxy sample used for comparison. Next, we present the EDA prescription used in this work (Section 3) and the likelihood-free inference method used to compare the simulations to observations (Section 4). Finally, in Section 5, we present the results of our comparison and discuss their implications on dust attenuation and its connection to galaxy properties.
2 Data
In this paper, we present the Empirical Dust Attenuation (EDA) model and demonstrate how it can be used in a forward modeling approach to compare galaxy populations in simulations and observations. For our simulations, we use three large-scale cosmological hydrodynamical simulations: the IllustrisTNG (hereafter TNG), EAGLE, and SIMBA. For our observations, we use a galaxy sample derived from SDSS. Below, we briefly describe the simulations and the SDSS observations used throughout this work.
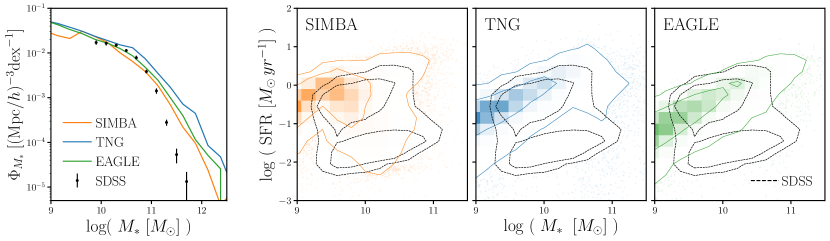
In Figure 1, we present the stellar mass functions, (left-most panel), and relations (right panels) of galaxies in SIMBA (orange), TNG (blue), and EAGLE (green). For reference, we include and the relation for SDSS observations. For the simulations, is the total stellar mass within the subhalo and is the instantaneous in the dense and cold star-forming gas. We do not impose any selection cuts on the simulations in Figure 1. For SDSS, we use assuming a Chabrier (2003) initial mass function (Blanton & Roweis, 2007) and from the current release of Brinchmann et al. (2004)111http://www.mpa-garching.mpg.de/SDSS/DR7/. The uncertainties for the SDSS SMF are derived from jackknife resampling. Although, we find striking differences between the relation of SDSS and the simulations, the and of simulations are theoretical predictions while the SDSS values are measurements, which are subject to, for instance, measurement limits, inconsistencies among tracers, and aperture effects. This inconsistency prevents a meaningful direct comparison. However, with a forward modeling approach of constructing synthetic observations, the simulations can be directly compared to observations (see e.g. Dickey et al., 2020, Starkenburg et al. in prep.). Figure 1 also illustrates that the hydrodynamical simulations predict significantly different SMFs and relations from each other. This difference, which was also recently highlighted in Hahn et al. (2019c), demonstrates that the hydrodynamical simulations predict galaxy populations with significantly different physical properties from one another.
2.1 IllustrisTNG100
The IllustrisTNG100 simulation222https://www.tng-project.org/ is a cosmological hydrodynamic simulation of comoving volume , with a particle mass resolution of for dark matter and for baryonic particles (Nelson et al., 2018; Pillepich et al., 2018; Springel et al., 2018; Marinacci et al., 2018; Naiman et al., 2018). It improves on the original Illustris simulation333http://www.illustris-project.org (Vogelsberger et al. 2014; Genel et al. 2014; public data release by Nelson et al. 2015), by including magneto-hydrodynamics and updated treatments for galactic winds, metal enrichment, and AGN feedback. Most notably, TNG uses a new implementation for feedback from SMBH, where feedback energy is injected in the form of a kinetic AGN-driven wind at low SMBH accretion rates (Weinberger et al., 2018). This new implementation has been shown to alleviate discrepancies found between the original Illustris and observations for massive halos.
2.2 EAGLE
The Virgo Consortium’s EAGLE project444http://www.eaglesim.org (Schaye et al., 2015; Crain et al., 2015; McAlpine et al., 2016) is a publicly available suite of cosmological hydrodynamic simulations constructed using Anarchy (Dalla Vecchia et al. in prep.; see also Appendix A of Schaye et al. 2015), a modified version of the GADGET-3 code (Springel, 2005). We use the L0100Ref simulation, which has a comoving volume of , and a baryonic mass resolution of . EAGLE has subgrid models for star formation, stellar mass loss, metal enrichment and stellar feedback that stochastically inject thermal energy in the ISM as in Dalla Vecchia & Schaye (2012). The feedback energy from AGN is also added to surrounding gas stochastically (Booth & Schaye, 2009). Parameters of the stellar feedback and SMBH accretion are calibrated to broadly reproduce the stellar mass function and galaxy stellar size-stellar mass relation. Meanwhile, the AGN feedback efficiency is calibrated to match the SMBH-galaxy mass relation.
2.3 SIMBA
The Simba simulation suite (Davé et al., 2019), the successor to Mufasa (Davé et al., 2016; Davé et al., 2017a, b), is a cosmological hydrodynamical simulation constructed using the Gizmo meshless finite mass hydrodynamics code (Hopkins, 2015; Hopkins et al., 2017). Of the suite, we use ‘m100n1024’, which has a box size of and baryonic mass resolution of . The simulation uses some of the same subgrid models as Mufasa for based star formation, decoupled two-phase winds for star formation driven galactic winds with velocity and mass loading calibrated to reproduce the FIRE simulations (Muratov et al., 2015; Anglés-Alcázar et al., 2017b), and feedback from Type I supernovae and AGB stars. Simba uses a two-mode SMBH accretion model, torque-limited accretion for cold gas (Anglés-Alcázar et al., 2017a) and Bondi-based accretion for hot gas, and AGN feedback in jet, radiative, and X-ray modes.
2.4 SDSS Galaxies
For our observations, we begin with the volume-limited Tinker et al. (2011) sample derived from the SDSS DR7 (Abazajian et al., 2009) NYU Value-Added Galaxy Catalog (VAGC; Blanton et al., 2005), which has a completeness limit. However, rather than , we focus on observables that can be consistently defined and derived in both simulations and observations: the -band absolute magnitude, , the optical color, and the color. We use , , and band absolute magnitudes from the NASA-Sloan Atlas555http://nsatlas.org/ (NSA), which is a re-reduction of SDSS DR8 (Aihara et al., 2011) that includes an improved background subtraction (Blanton et al., 2011) and near and far UV photometry from GALEX. These absolute magnitudes are derived using (Blanton & Roweis, 2007), assuming a Chabrier (2003) initial mass function.
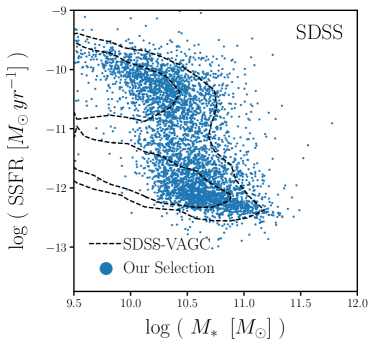
We impose a completeness limit on the Tinker et al. (2011) sample as well as completeness limits in the and bands. UV absolute magnitudes are poorly constrained for galaxies with low UV fluxes. We compare the reconstructed and fluxes from to the measured fluxes and determine the flux limits above which the fluxes are in good agreement. The flux limits correspond to completeness limits of and . In Figure 2, we present the -SSFR relation of our observational sample (blue). We include the original Tinker et al. (2011) SDSS sample (black dash) for comparison. In total, our SDSS sample has 4,451 star-forming and quiescent galaxies with .
2.5 Forward Modeling Observations
One of the main goals of this work is to conduct an “apples-to-apples” comparison between the simulations and observations. A crucial step in this comparison is to forward model the observables from the simulations. The simulations can then be directly compared to observations in observational-space, instead of relying on measured galaxy properties, which are impacted by variations, inconsistencies, and biases of different methods (Dickey et al., 2020). The comparison can also include selection functions and observational systematic effects through the forward model. In this work, we use -band luminosity (), optical color (), and UV color () as our observables.
First, we construct SEDs for all of the simulated galaxies based on their star formation and metallicity histories (SFH and ZH) using the Flexible Stellar Population Synthesis model (; Conroy et al., 2009, 2010) with the MILES spectral library (Sánchez-Blázquez et al., 2006), MIST isochrones (Paxton et al., 2011; Paxton et al., 2013, 2015; Choi et al., 2016; Dotter, 2016), and Chabrier (2003) initial mass function. For each simulated galaxy, we bin the total stellar mass formed by age () and metallicity (). We use the same , grid for all of the simulations to account for the variable time and mass resolutions. We assume each bin is a single stellar population and generate a spectrum assuming using and take the mass-weighted linear combination of them to produce the galaxy SED. For further details on how we construct the SEDs, we refer readers to Starkenberg et al. (in prep.).
Next, we apply dust attenuation to the SEDs using the EDA prescription, which assigns dust attenuation curves to each simulated galaxy based on its physical properties and EDA model parameters (Section 3). We then convolve the attenuated SEDs with the transmission curves of the GALEX , GALEX , SDSS , and SDSS broadband filter to construct the observables. We add realistic noise to , , and by sampling from the observed uncertainty distributions of the NASA Sloan-Atlas. Lastly, we apply the same , , and absolute magnitude completeness limits of our SDSS sample to the simulated galaxies.
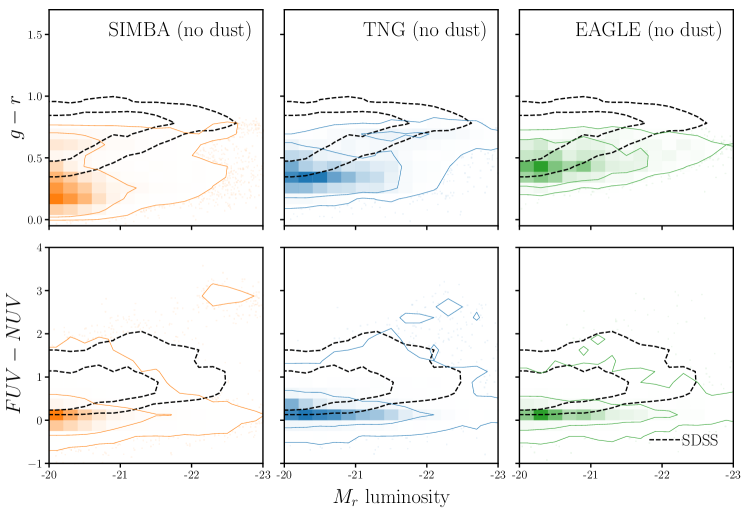
In Figure 3, we present the forward modeled optical and UV color-magnitude relations, (top) and (bottom), for simulated galaxies in SIMBA (left), TNG (center) and EAGLE (right) assuming no dust attenuation. We mark the 68 and 95% contours and include, for reference, the optical and UV color-magnitude relations of our SDSS sample (black dashed). The comparison to SDSS observations clearly demonstrates that without dust attenuation, the hydrodynamical simulations do not reproduce the observed optical or UV color-magnitude relations.
3 The Empirical Dust Attenuation Framework
In this section, we describe the Empirical Dust Attenuation (EDA) framework and present the EDA prescription used in this work to apply dust attenuation to our simulated galaxies. We begin by defining the dust attenuation curve, , as
| (1) |
where is the observed flux and is the intrinsic flux. We normalize the attenuation to the band attenuation,
| (2) |
so that determines the amplitude of the attenuation, while determines the wavelength dependence. The EDA assigns a and for each simulated galaxy. For , we use the slab model (e.g. Somerville & Primack, 1999; Somerville et al., 2012), where is a function of galaxy inclination, , and galaxy properties:
| (3) |
is the -band optical depth that depends linearly on and :
| (4) |
, , and represent the dependence, the dependence, and amplitude of . Since is optical depth, we impose a limit. For each galaxy, we uniformly sample from 0 to 1 to introduce stochasticity. This produces significant variance in so galaxies with the same properties do not have identical dust attenuation.
Our parameterization is based on correlations between dust attenuation and galaxy properties that have been established by observations (e.g. Garn & Best, 2010; Battisti et al., 2016; Salim & Narayanan, 2020). Previous works have parameterized dust attenuation based on other galaxy properties such as gas density, gas metallicity, or star-gas geometry, motivated by the fact that dust attenuation on small scales depends on local stellar and gas properties (e.g. Somerville & Primack, 1999; Somerville et al., 2012; Steinacker et al., 2013; Camps & Baes, 2015; Narayanan et al., 2018; Trayford et al., 2020; Vogelsberger et al., 2020). Galaxies in the SIMBA, TNG, and EAGLE, however, have substantially different gas masses and metallicites (Davé et al., 2020, Maller et al. in prep.). If we were to parameterize using these properties, their differences would dominate any comparison of dust attenuation. In Appendix A, we confirm the correlation between and the properties and in the Salim et al. (2018) GSWLC2 sample (Figure 14).
In our EDA, we use the slab model because it provides a simple prescription for generating a distribution of that depends on randomly sampled , with loose physical motivations. For star-forming galaxies, which typically have disc-like morphologies, the slab model produces that is correlated with in a way consistent with observations: edge-on galaxies have higher than face-on galaxies (e.g. Conroy et al., 2010; Wild et al., 2011; Battisti et al., 2017; Salim & Narayanan, 2020). Nevertheless, the slab model is a simplification. In reality, depends on the detailed star-to-dust geometry. Furthermore, we assign to all galaxies, not just star-forming. For quiescent galaxies, which typically have elliptical morphologies, the slab model serves only as an empirical prescription for statistically sampling . The EDA seeks to assign an accurate distribution of dust attenuation curves for an ensemble of galaxies — not to accurately model dust attenuation for individual galaxies. In this regard, we demonstrate in Appendix A that the slab model can match the observed distribution of , even for samples that include quiescent galaxies.
For the wavelength dependence of the attenuation curve, , we use Noll et al. (2009) parameterization:
| (5) |
Here is the Calzetti (2001) curve:
where is the band wavelength and is the slope offset of the attenuation curve from . Since correlates with galaxy properties (e.g. Wild et al., 2011; Battisti et al., 2016; Leja et al., 2017; Salim et al., 2018, see also Appendix A), we parameterize with a similar and dependence as :
| (6) |
in Eq. 5 is the UV dust bump, which we parameterize using the standard Lorentzian-like Drude profile:
| (7) |
where , , and are the central wavelength, full width at half maximum, and strength of the bump, respectively. We include the UV dust bump since we use UV color as one of our observables. Kriek & Conroy (2013) and Tress et al. (2018) find that correlates with for star-forming galaxies at . Narayanan et al. (2018) confirmed this dependence in simulations. Hence, we assume a fixed relation between and : (Kriek & Conroy, 2013). Allowing the slope and amplitude of the and relation to vary does not impact our results; however, we also do not derive any meaningful constraints on them. In Table 1, we list and describe all of the free parameters of our EDA prescription.
of galaxies are used to calculate and in Eqs. 4 and 6. However, due to mass and temporal resolution limits, some galaxies in the simulations have — i.e. an unmeasurably low SFR (Hahn et al., 2019c). They account for 17, 19, 9% of galaxies in SIMBA, TNG, and EAGLE, respectively. Since Eqs. 4 and 6 depend on , they cannot be used in the equations to derive and for these galaxies. To account for this issue, we assign , the minimum non-zero in each simulation, to galaxies when calculating and . For SIMBA, TNG, and EAGLE, , , and , respectively. Although this assumes that galaxies have similar dust properties as the galaxies with , since the simulations have very low we expect galaxies with to have little recent star-formation and low gas mass, similar to galaxies.
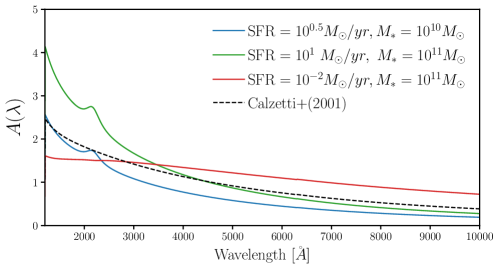
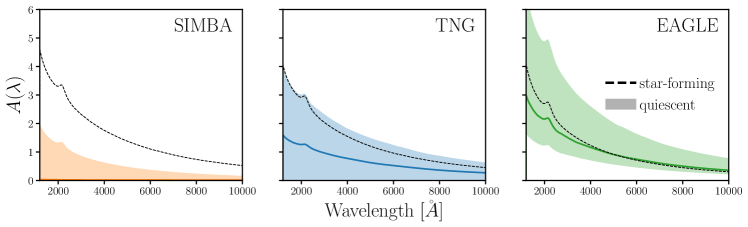
In summary, to apply the EDA to a simulated galaxy population, we first assign a randomly sampled to each galaxy ( uniformly sampled from 0 to 1). and are calculated for the galaxy based on its , and the EDA parameters. We then calculate and to determine for each galaxy. Afterwards, we attenuate the galaxy SEDs using Eq. 1 and use the attenuated SEDs to calculate the observables: , and absolute magnitudes. In Figure 4, we present attenuation curves, , generated by the EDA for galaxies with different and values. We present star-forming galaxies with (blue), (green) and a quiescent galaxy with (red). We use an arbitrary set of EDA parameters () within the prior range listed in Table 1. We set (edge-on) for all in Figure 4 for simplicity. For comparison, we include the Calzetti (2001) attenuation curve. The EDA produces attenuation curves with a wide range of amplitudes and slopes for galaxies based on their physical properties.
| Parameter | Definition | prior |
|---|---|---|
| dependence of the optical depth, | flat | |
| dependence of | flat | |
| amplitude of | flat | |
| dependence of , the attenuation curve slope offset | flat | |
| dependence of | flat | |
| amplitude of | flat |
4 Likelihood-Free Inference: Approximate Bayesian Computation
With our forward model, which includes the EDA prescription for dust attenuation, we can now generate synthetic observations for simulated galaxies and make an “apples-to-apples” comparison to SDSS. Next, we want to use this comparison to infer the posterior probability distribution of the EDA parameters. Typically in astronomy, this inference is done assuming a Gaussian likelihood to compare the “summary statistic” (e.g. SMF) of the model to observations and some sampling method (e.g. Markov Chain Monte Carlo) to estimate the posterior distribution. The functional form of the likelihood, however, depends on the summary statistic and assuming an incorrect form of the likelihood can significantly bias the inferred posteriors (e.g. Hahn et al., 2019b). In this work, we use the optical and UV color-magnitude relations as our summary statistic. Since this statistic is a three-dimensional histogram, the likelihood is not Gaussian. Furthermore, since the bins are not independent, the true likelihood is difficult to analytically write down.
Rather than incorrectly assuming a Gaussian likelihood or attempting to estimate the true likelihood of the optical and UV color-magnitude relations, we use Approximate Bayesian Computation (hereafter ABC; Diggle & Gratton, 1984; Tavare et al., 1997; Pritchard et al., 1999; Beaumont et al., 2009; Del Moral et al., 2012) for our inference. ABC is a likelihood-free (or “simulation-based”) parameter inference framework that approximates the posterior probability distribution, , without requiring evaluations of the likelihood. Instead, ABC only requires a forward model of the observed data, a prior that can be sampled, and a distance metric that quantifies the “closeness” to the observed data. Since ABC does not require evaluating the likelihood, it does not assume any functional form of the likelihood so we avoid any biases from such assumptions. It also expands the summary statistics we can use to infer the posteriors and, therefore, provides a general inference framework for a forward modeling approach.
In the simplest version of ABC, with rejection sampling (Pritchard et al., 1999), a proposal set of parameter values are drawn from the prior. The forward model is run with the proposal parameter values. The output of the forward model is then compared to the observed data using a distance metric. If the distance is within some small threshold, we keep the proposed parameters; otherwise, we discard them. Proposals are drawn until enough pass the threshold to sample the posterior. A rejection sampling framework requires a large number of evaluations of the forward model, which can be computationally costly. Many variations of ABC with more efficient sampling strategies have now been applied to astronomy and cosmology (e.g. Cameron & Pettitt, 2012; Weyant et al., 2013; Ishida et al., 2015; Lin et al., 2016; Alsing et al., 2018). Among these methods, we use ABC with Population Monte Carlo (PMC) importance sampling (Hahn et al., 2017a; Hahn et al., 2017b, 2019a).
ABC-PMC begins with an arbitrarily large threshold and proposals sampled from the prior distribution. Each proposal is assigned a weight . Then for subsequent iterations (), the threshold, , is set to the median distance of the previous iteration’s proposals. New proposals are drawn from the previous iteration’s proposals perturbed by a kernel and kept if their distance is below . This is repeated until we assemble a new set of proposals . The entire process is repeated for the next iteration until convergence is confirmed. We use the Python implementation of Akeret et al. (2015)666https://abcpmc.readthedocs.io/en/latest/index.html. For further details on the ABC-PMC implementation, we refer readers to Hahn et al. (2017b) and Hahn et al. (2019a).
In this work, we use ABC-PMC with uninformative uniform priors on each of the EDA parameters and choose ranges that encompass constraints in the literature. The prior ranges of include the range and and dependence of Narayanan et al. (2018) and Salim & Narayanan (2020). Meanwhile, the prior ranges of include the range and and dependence of Leja et al. (2017) and Salim et al. (2018). We list the range of the priors in Table 1. We use the forward model described in Section 2.5, where we construct SEDs for every simulated galaxy from SIMBA, TNG, and EAGLE, apply dust attenuation with our EDA, calculate the observables (, , and ), add realistic noise, and apply a completeness limit. We use the optical and UV color-magnitude relation, and as our summary statistic to fully exploit the observational-space. We measure the color-magnitude relations by calculating the number density in bins of with widths . For our distance metric, , we use the L2 norm between the number density of the SDSS observation, and of our forward model, :
| (8) |
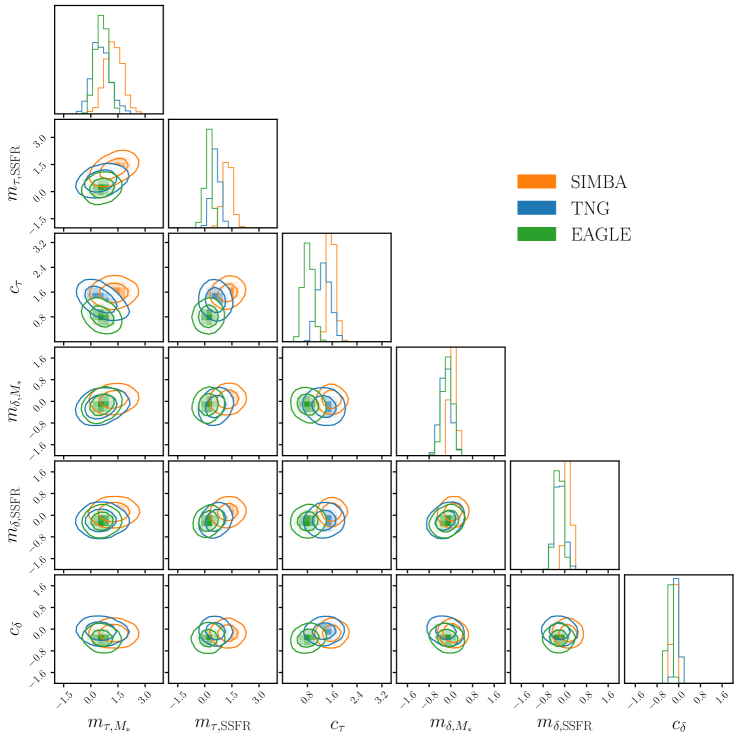
In Figure 5, we present the posterior distributions of the EDA parameters derived using ABC-PMC for the SIMBA (orange), TNG (blue), and EAGLE (green). The contours mark the and percentiles of the distributions.
5 Results
Without dust attenuation, all of the hydrodynamical simulations struggle to reproduce the and relations of SDSS (Figure 3). Both in the optical and UV, the simulations predict galaxies significantly bluer than SDSS galaxies. The simulations also predict optically blue luminous galaxies with that are not found in the observations; this is particularly noticeable for SIMBA and TNG. Simulated galaxies in SIMBA also have a significantly broader distribution of colors than SDSS galaxies. Meanwhile, all of the simulations predict a broader distribution of color than SDSS. In fact, SIMBA and TNG predict a significant number of luminous galaxies, , with colors, beyond SDSS observations.
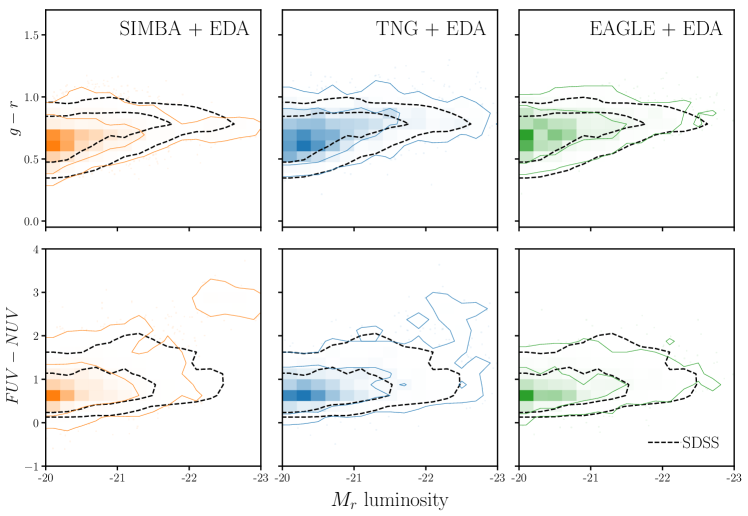
With our EDA prescription, all three simulations produce color-magnitude relations that are highly consistent with SDSS observations. In Figure 6, we present the optical and UV color-magnitude relations predicted by the EDA for the SIMBA (orange), TNG (blue), and EAGLE (green) simulations. For the EDA parameters, we use the median values of the inferred posterior distributions (Figure 5). We include the color-magnitude relations of SDSS observations (black-dashed) for comparison. The contours mark the and percentiles of the distributions.
Dust dramatically impacts the observables of simulations. The EDA affects the optical and UV color-magnitude relations in three major ways to produce good agreement with SDSS. First, the EDA significantly reddens the simulated galaxies in the optical: colors are redder than the optical color-magnitude relation in Figure 3 and match the distribution of SDSS. Second, the EDA reddens non-quiescent () galaxies in the UV by . While quiescent galaxies have intrinsically red UV colors that generally agree with SDSS (), the rest of the galaxies are intrinsically bluer in the UV than observations. Lastly, the EDA attenuates non-quiescent galaxies so there are no longer luminous galaxies that are blue in the optical or UV — consistent with observations.
Despite the substantial improvement in the color-magnitude relation agreement with the EDA, there is still one significant discrepancy: the presence of luminous galaxies that are UV-red, not found in observations (). This galaxy population consists of quiescent galaxies with and is especially pronounced in the UV color-magnitude of SIMBA but also found in TNG. They are also present in the UV color-magnitude predictions without dust attenuation (Figure 3). Since they are the most luminous galaxies in our sample, dust attenuation cannot remove them from our sample. Furthermore, dust reddening would only increase the discrepancies with observations since they have intrinsic . In other words, the excess luminous UV-red galaxies predicted by SIMBA and TNG are irreconcilable with dust attenuation.
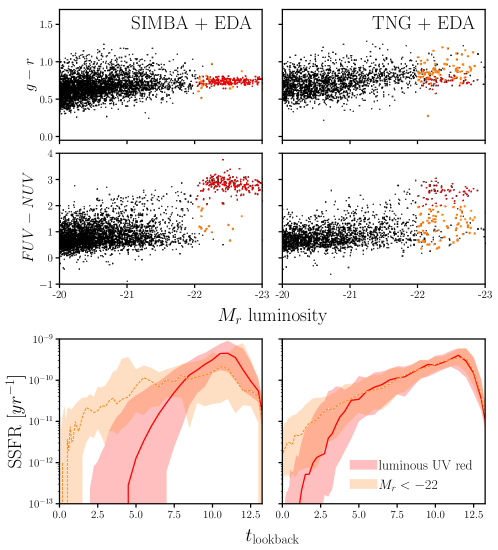
In order to understand the origin of the luminous UV-red galaxies in SIMBA (left) and TNG (right), we examine their star formation histories in Figure 7. The top and center panels mark the luminous UV-red galaxies on the optical and UV color-magnitude relations predicted by the EDA (red). The bottom panels present the median specific SFH (SSFH), as a function of lookback time, , with the shaded regions representing the 68 percentile. For comparison, we include the SSFHs of other quiescent galaxies with matching luminosities, and (orange). The SSFHs reveal that, unlike other quiescent galaxies, the luminous UV-red galaxies of SIMBA and TNG have almost no star formation within the last Gyr. With no recent star formation contributing to the SED in wavelengths, these galaxies have red color. These luminous UV-red galaxies in SIMBA and TNG suggest that star formation quenching is too efficient in the most massive queiscent galaxies.
The SSFHs in Figure 7 also reveal that luminous UV-red galaxies in SIMBA have a substantially different SSFH than other quiescent galaxies. In addition to the lack of recent star formation, the luminous UV-red galaxies also have significantly shorter star-forming timescales. They peak their star formation earlier than other quiescent galaxies, at Gyr, and have a more rapid decline in star formation. In contrast, the luminous UV-red galaxies in TNG have overall similar SSFHs to other quiescent galaxies. This difference in SFH suggests that a distinct star formation quenching mechanism is responsible for the luminous red galaxies in SIMBA. In another paper of the IQ series (Choi et al. in prep), we examine this SFH difference in further detail and present its impact on the quiescent fraction evolution over .
In principle, the simulations could remove the luminous UV-red galaxies from the sample if star formation quenching in these galaxies was even more efficient. With absolutley no recent star formation, their UV SED would fall below our or completeness limits and would not be included in the comparison. However, a large portion of the luminous quiescent galaxies are UV-red, so the simulations, especially SIMBA, would struggle to reproduce the luminous end of the SDSS red sequence and the luminosity function of the observations. Furthermore, reducing the total number of massive quiescent galaxies that pass the selection function would conflict with our observations, which include a significant number of massive quiescent galaxies (Figure 2).
Previous works in the literature have also compared simulations with different dust prescriptions to observations in color-magnitude space. For EAGLE, Trayford et al. (2015) calculated colors and luminosities with the Galaxev population synthesis models and a two-component screen model for dust. More recently, Trayford et al. (2017) calculated optical colors for EAGLE using Skirt, a Monte Carlo radiative transfer code (Camps & Baes, 2015), to model the dust. At stellar masses and luminosities comparable to our SDSS sample, both Trayford et al. (2015) and Trayford et al. (2017) produce red sequences bluer than in GAMA observations. Also, Trayford et al. (2015) predict an excess of luminous blue galaxies. Although a detailed comparison is difficult since both works compare to different observations, we note that with the EDA, EAGLE is able to successfully reproduce the position of the SDSS red sequence and does not predict a significant excess of luminous blue galaxies. Also using EAGLE and Skirt, Baes et al. (2019) find that they overestimate the observed cosmic SED (CSED) in the UV regime and produce significantly higher color than GAMA. The EDA for EAGLE predicts in good agreement with SDSS. For TNG, Nelson et al. (2018) calculate optical colors using a dust model that includes attenuation due to dense gas birth clouds surrounding young stellar populations and also due to simulated distribution of neutral gas and metals. They find bluer red sequence peaks and a narrower blue cloud compared to SDSS. We find neither of these discrepancies for the TNG+EDA. The EDA provides a simpler empirical framework for applying dust attenuation than the dust models in these works. Yet, with its flexibility and low computation cost, we are able to fully explore our dust parameters and produce optical and UV color-magnitude relations that are in good agreement with observations.

5.1 Comparison to Dust Observations
In addition to reproducing observations, the EDA assigns dust attenuation curves to each simulated galaxy so we can compare the EDA attenuation curves to dust attenuation measured from observations. We begin with the well-established attenuation-slope relation: star-forming galaxies with higher dust attenuation have shallower attenuation curves. This relation is a consequence of dust scattering dominating absorption at low attenuation while dust absorption dominates at high attenuation (Gordon et al., 1994; Witt & Gordon, 2000; Draine, 2003; Chevallard et al., 2013). In Figure 8, we present the attenuation-slope relation of star-forming galaxies with using the dust attenuation curves predicted by the EDA for the median posteriors of SIMBA (left), TNG (center) and EAGLE (right). For comparison, we include the observed attenuation-slope relations of GSWLC2 galaxies (grey shaded; Salim & Narayanan, 2020). For attenuation, we use ; for slope, we use the UV-optical slope, . The contours mark the 68 and 95 percentiles.
Most noticably, we find that the EDA does not predict for star-forming galaxies. This is a consequence of SIMBA, TNG, and EAGLE predicting star-forming galaxies that are intrinsically more luminous than observations. All of the simulations have star-forming galaxies with intrinsic and (Figure 3). This is further corroborated by the relations in Figure 1, where the simulations all have star-forming galaxies with , not found in SDSS. To reproduce the SDSS optical color-magnitude relation these galaxies would need to be significantly reddened and attenuated so any dust prescription would need to assign high to star-forming galaxies. Nevertheless, for , we find good agreement between the attenuation-slope relation predicted by the EDA and observations. We refrain from further scrutinizing on values, since they can vary significantly between different observational measurements — even for the same galaxy. SDSS star-forming galaxies, for instance, have significantly higher according to the Brinchmann et al. (2004) measurements (Appendix A).
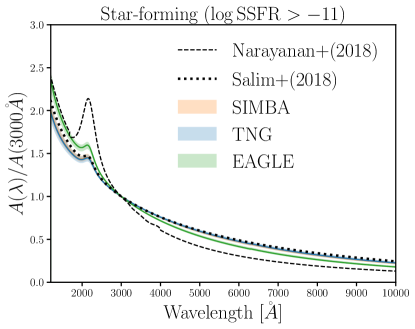
In addition to the attenuation-slope relation, we can also directly compare the attenuation curves predicted by the EDA to measurements from observations for star-forming galaxies. In Figure 9, we present the normalized attenuation curves of star-forming galaxies predicted by the EDA for the median posterior parameter values of SIMBA(orange), TNG (blue), and EAGLE (green). We again define galaxies with as star-forming. The attenuation curves are normalized at and we present the variation in the attenuation curves in the shaded region, 68 percentile. For comparison, we include from the Narayanan et al. (2018) radiative transfer simulation (dashed) and observations (Salim et al., 2018, dotted). The attenuation curve from Salim et al. (2018) corresponds to star-forming galaxies with , a similar range as our forward modeled samples. Since we do not vary the UV bump in our EDA prescription, we ignore any discrepancies in the amplitudes of the bump. Overall, we find good agreement between the EDA attenuation curves for star-forming galaxies and the attenuation curves from observations and simulations.
5.2 The Attenuation Curves of Quiescent Galaxies
In addition to star-forming galaxies, the EDA also predicts dust attenuation of quiescent galaxies. This is particularly valuable since dust attenuation in quiescent galaxies is still poorly constrained by observations due to challenges in directly measuring it from observations. For instance, methods that rely on IR luminosities can be contaminated by MIR emission from AGN heating nearby dust (Kirkpatrick et al., 2015). SED fitting methods must also account for AGN MIR emission (Salim et al., 2016; Leja et al., 2018; Salim et al., 2018). They also struggle to tightly constrain dust attenuation for quiescent galaxies due to the degeneracies with star formation history and metallicity. With a forward modeling approach, we circumvent these challenges. Instead, we derive the attenuation curves necessary for the simulated quiescent population to reproduce the observed optical and UV photometry.
In Figure 10, we present the attenuation curves of quiescent galaxies predicted by the EDA for the median posterior parameter values of SIMBA (left), TNG (center), and EAGLE (right). Quiescent galaxies are classified using a cut. Unlike Figure 9, we do not normalize the attenuation curves at . For comparison, we include of star-forming galaxies predicted by the EDA for the corresponding simulation in each panel (dotted). In all three simulations, quiescent galaxies have attenuation curves with lower amplitudes and shallower slopes than star forming galaxies.
We predict with lower amplitude because quiescent galaxies in SIMBA, TNG, and EAGLE are intrinsically only slightly more luminous than observations. In the top panels of Figure 3, we see that the most luminous galaxies with the highest color is brighter than the tip of the red sequence in the SDSS color-magnitude relation. For SIMBA+EDA, where we predict , the most luminous and optically red galaxies have comparable as the tip of the SDSS red sequence. In contrast, the most luminous blue, star-forming, galaxies are brighter than the luminous end of the SDSS blue cloud. Despite having lower attenuation than star-forming galaxies, in TNG and EAGLE we predict significant dust attenuation in quiescent galaxies, . Although this could be because TNG and EAGLE produce quiescent galaxies that are intrinsically too luminous, the prescence of dust attenuation in quiescent galaxies, which is typically neglected, has significant implications. For instance, it strengthens the evidence for the UV upturn phenomenon, the unexpected detections of UV flux in quiescent galaxies (e.g. Code, 1969; O’Connell, 1999; Le Cras et al., 2016; Ali et al., 2018; Dantas et al., 2021). Constraints on the attenuation in quiescent galaxies may help discern among the different hypotheses: residual star formation activity (e.g. Kaviraj et al., 2007), post-main-sequence stellar evolutionary phases (e.g. Yi et al., 1997), or binary systems (e.g. Han et al., 2007). Since the attenuation curves of quiescent galaxies are difficult to measure from observations, the EDA predictions highlight the advantages of forward modeling and its complementarity with standard approaches.
In Figure 10, we also find that quiescent galaxies have shallower attenuation curves than star-forming galaxies. This is because SIMBA, TNG, and EAGLE all predict intrinsically UV-red galaxies that do not require significant reddening. This is especially true for SIMBA and TNG, which predict significant number of galaxies with intrinsic (Figure 3 and 7). These galaxies are quiescent () and have high due to a lack of recent star formation contributing to the SED. When we examine their SFHs, we find that, although they have more star formation than the luminous UV-red galaxies discussed earlier, they have little star formation in the last 1 Gyr. This implies that SIMBA, whose quiescent galaxies have the shallowest attenuation curve, has the most efficient star-formation quenching among the simulations.
The mass resolution of the simulations can impact the SFHs of quiescent galaxies and, thus, their observables. The SFHs of simulated galaxies cannot include any star formation below the resolution limit, which can affect the SEDs we compute from them. For recent star formation, this can have a significant impact on the SED, especially in the FUV and NUV (Leja et al., 2017). SIMBA, TNG, and EAGLE have mass resolutions of , , and , respectively. Even if we were to include a old stellar population with total mass of in their SFHs, the impact on is small: for SIMBA and for TNG and EAGLE. Hence, mass resolution does not significantly impact the dust attenuation we predict for quiescent galaxies.
Despite the advantages of our forward modeling approach in deriving dust attenuation curves for quiescent galaxies, we caution readers that we only vary the EDA parameters in this work. The EDA predictions we present assume that the simulations accurately model the star formation and metallicity histories of quiescent galaxies. Shortcomings in the galaxy formation models, and not the dust attenuation, may be responsible for some of the differences between the simulations and observations. For instance, we already find that quenching is too efficient in certain SIMBA and TNG quiescent galaxies, which produce luminous UV-red galaxies not found in SDSS (Section 5). TNG and EAGLE may also be producing quiescent galaxies that are overall intrinsically too luminous, which then requires significant dust attenuation to match observations. In principle, we can vary both the EDA parameters and the parameters of the galaxy formation models and infer them simultaneously with a foward modeling approach. We will explore this in future work.
5.3 The Galaxy – Dust Connection
In this section, we examine the connection between dust attenuation and galaxy properties in more detail. First, we examine the galaxy-dust connection using the and dependent parameterization of our EDA prescription (Eqs 4 and 6). In Table 2, we list the median values and the 68% confidence interval of the inferred EDA parameter posteriors for the three simulations. We find significant dependence, , consistent with what we found in the previous section: quiescent galaxies have lower dust attenuation than star-forming galaxies. We also find significant dependence in : . -band dust attenuation is higher for more massive galaxies. There is, however, little dependence in the slope of the dust attenuation.
| SIMBA | ||||||
|---|---|---|---|---|---|---|
| TNG | ||||||
| EAGLE |
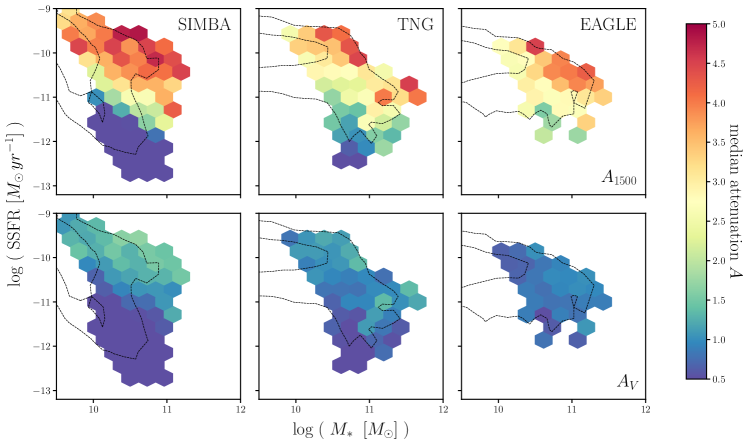
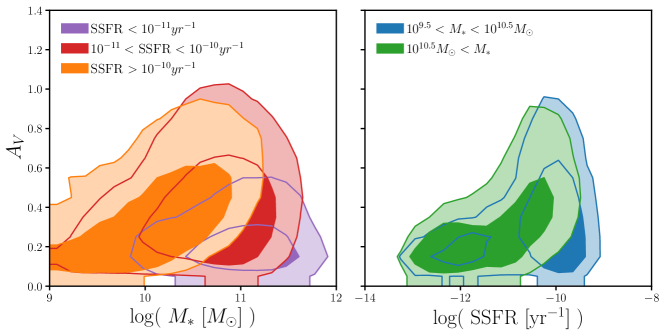
We take a closer look at the and dependence of the attenuation curve in Figure 11, where we present dust attenuation at (; top) and (; bottom) as a function of and predicted by the EDA for SIMBA (left), TNG (center) and EAGLE (right). For each hexbin, the colormap represents the median attenuation for all simulated galaxies in the bin. We only include bins with more than 10 galaxies. We include, for reference, the relation of all galaxies in the simulations in black dashed contours, which mark the 68 and 95 percentiles. We do not include a direct comparison with observations because there are large variations between different measurements (Appendix A, see also Figure 15).
In each panel, we find that SIMBA, TNG, and EAGLE galaxies with higher have higher dust attenuation at constant SSFR — consistent with the literature. Burgarella et al. (2005), for instance, found significant positive dependence in attenuation in NUV-selected and FIR-selected samples. Garn & Best (2010) and Battisti et al. (2016) also found higher attenuation in more massive SDSS star-forming galaxies. Most recently, Salim et al. (2018) found higher and attenuation for more massive star-forming galaxies in GSWLC2. For the dependence, we find that galaxies with higher have higher (top) and (bottom) as well as steeper slopes. The dependence is not as prominent in EAGLE (see also Table 2), which has a narrower distribution than SIMBA and TNG with no starburst galaxies or quiescent galaxies with . EAGLE has fewer intrinsically luminous star-forming galaxies or UV-red galaxies (Figure 3) and a narrower intrinsic and color distributions. To reproduce observations, it requires an overall attenuation and reddenning without a significant dependence. Nevertheless, in all simulations, star-forming galaxies have slopes that are consistent with observations (Section 5.1) while quiescent galaxies with the lowest have nearly flat attenuation curves. In summary, we find that SIMBA, TNG, and EAGLE galaxies with higher require overall higher dust attenuation and galaxies with higher require steeper attenuation curves.
5.4 Discussion
We make a number of assumptions and choices in our EDA prescription. First, we use the slab model (Eq. 3) to assign as a function of and randomly sampled . This choice is motivated by the fact that the slab model reproduces the correlation between attenuations and inclination found in star-forming galaxies from observations (Conroy, 2010; Wild et al., 2011; Battisti et al., 2017; Salim & Narayanan, 2020) and simulations (e.g. Chevallard et al., 2013; Narayanan et al., 2018; Trayford et al., 2020). More importantly, we use the slab model because it is flexible enough to reproduce a wide range of distributions. In Appendix A, we demonstrate that we can reproduce of SDSS star-forming galaxies as well as the GSWLC2 sample, which includes quiescent galaxies. We also use a parameterization of and that depend linearly on and . While the and dependence of is well-motivated and is found in, for instance, the Salim et al. (2018) GSWLC2 catalog (Appendix A), the linear dependence was chosen primarily for its simplicity. The EDA framework can be easily extended to more flexible parameterizations. Though we already find good agreement with SDSS observations, a more flexible parameterization can produce even better agreement with the SDSS color-magnitude relations. The main challenges for a more flexible parameterization would be model selection and finding a better motivated parameterization.
We demonstrate in this work that accounting for dust attenuation is essential when comparing simulations to observations. After all, none of the simulations reproduce the UV and optical color-magnitude relation without dust (Figure 3). Moreover, this work also demonstrates that our current lack of understanding of dust limits our ability to closely compare galaxy formation models. Our EDA prescription is built on what we currently know about dust attenuation in galaxies: e.g. the Noll et al. 2009 parameterization, the UV bump, the , dependence, etc. Yet with the EDA, simulations that predict galaxy populations with significantly different physical properties (Figure 1) can reproduce the same SDSS observations. For instance, SIMBA has significantly fewer massive galaxies above than TNG or EAGLE (see SMFs in Figure 1). It also has starburst galaxies with (see also Davé et al. 2019 Figures 5 and 6) that are not found in TNG or EAGLE (Figure 11). Meanwhile, star-forming galaxies in TNG have significantly higher s than in EAGLE. Despite all these differences, by adjusting dust attenuation, the simulations consistently reproduce the observations.
All this suggests that dust is highly degenerate with the differences between simulations. Put another way — if we were to marginalize over dust in our comparison to observations, we would not be able to differentiate between the different galaxy physics prescriptions in the simulations. Hence, current limitations in our understanding of dust are a major bottleneck for investigating galaxy formation with simulations. In the next paper of the series, Starkenburg et al. (in preparation), we will examine whether we can compare the prescriptions for star formation quenching in different galaxy formation models once we include the EDA framework.
Fortunately, there are many avenues for improving our understanding of dust with a forward modeling approach. In this work, we used a restrictive SDSS galaxy sample with a , , and completeness limit. This selection excludes star-forming galaxies below and quiescent galaxies below (Figure 11). Instead of imposing this completeness limit, we can include the actual SDSS selection function in the forward model (e.g. Dickey et al., 2020). This would allow us to compare the simulations with EDA to the entire SDSS sample, a substantially larger sample with a wider range of galaxies. Upcoming surveys, such as the Bright Galaxy Survey (BGS) of the Dark Energy Spectroscopic Instrument (DESI; DESI Collaboration et al., 2016; Ruiz-Macias et al., 2020) and the galaxy evolution survey of the Prime Focus Spectrograph (PFS; Takada et al., 2014; Tamura et al., 2016), will vastly expand galaxy observations. BGS, for instance, will measure the number of galaxy spectra as SDSS out to and with its magnitude limit will probe a broader range of galaxies. Such observations will allow us to place tighter constraints on the EDA parameters, which may enable comparisons of the underlying galaxy formation models and shed light on dust in a broader range of galaxies.
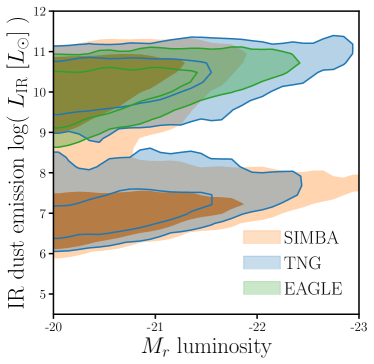
In this work, we only use observables derived from UV and optical photometry, which means that we have only examined one side of the impact that dust has on galaxy spectra. While dust attenuates light in the optical and UV, it emits light in IR. In fact, even though the simulations reproduce the same SDSS UV and optical color-magnitude relations with the EDA, they predict significantly different dust emission in the IR. In Figure 12, we present IR dust emission luminosity, , predicted by the EDA with median parameter values of the SIMBA (orange), TNG (blue), and EAGLE (green) posteriors as a function of the -band absolute magnitude, . The dust emissions are estimated using the standard energy balance assumption — i.e. all starlight attenuated by dust is reemitted in the IR (da Cunha et al., 2008). Most noticably, SIMBA and TNG have bimodal distributions of dust emission while EAGLE only has luminous IR dust emissions. This is because EAGLE requires significant dust attenuation in all galaxies while SIMBA and TNG require quiescent galaxies to have substantially lower dust attenuation than star-forming galaxies (Figure 10). The luminous mode of the distributions, however, are in good agreement for all simulations, since they all predict comparable dust attenuation in star-forming galaxies (Figures 8 and 10). When we compare the IR dust emission of SIMBA+EDA and TNG+EDA further, we find that TNG+EDA produces more luminous galaxies with high IR dust emission ( and ) since it has more intrinsically luminous star-forming galaxies (Figure 3). On the other hand SIMBA+EDA has more luminous galaxies with fainter IR dust emissions, which correspond to the anomolous luminous UV-red galaxies highlighted in Figure 7.
While dust attenuation can be adjusted to reproduce UV and optical observations, since IR dust emission measures the total attenuation, IR observations can place a limit on the total impact of dust and thereby break the degeneracies between dust and the galaxy physics in simulations. While some upcoming surveys, such as BGS, will have existing near-IR photometry from NEOWISE (Meisner et al., 2018), future observations will dramatically expand the information we have in IR. Nancy Grace Roman Space Telescope and James Webb Space Telescope, for instance, will provide valuable near and mid-IR observations. Meanwhile, IR observations at even longer wavelengths will come from Atacama Large Millimeter/submillimeter Array or future facilities such as the Next-Generation Very Large Array and Origins Space Telescope.
6 Summary
In this work, we present the EDA, a framework for applying dust attenuation to simulated galaxy populations. It uses a parameterization of the attenuation curves motivated from observations (Noll et al., 2009) and assigns attenuation curves to simulated galaxies based on their physical properties ( and SSFR). We apply the EDA to three state-of-the-art hydrodynamical simulations (SIMBA, TNG, and EAGLE) and forward model the optical and UV color-magnitude relations. We then compare the forward modeled simulations to a complete SDSS galaxy sample using likelihood-free inference. Based on this comparison, we find the following results:
-
•
Dust attenuation is essential for our hydrodynamical simulations to reproduce observations. Without dust, SIMBA, TNG, and EAGLE all struggle to reproduce the observed UV and optical color-magnitude relation. They predict galaxies that are intrinsically much bluer and more luminous in the optical and with broader distributions of colors than SDSS.
-
•
With the EDA, each of the simulations are able to produce UV and optical color-magnitude relations in good agreement with SDSS observations. However, we find that star formation quenching is too efficient for some of the most massive quiescent galaxies in SIMBA and TNG. When forward modeled, these galaxies appear as luminous UV-red galaxies outside the observed UV color-magnitude relation that cannot be reconciled by dust.
-
•
The attenuation curves of star-forming galaxies predicted by the EDA for the simulations are in good agreement with the observed attenuation-slope relation. They also closely reproduce the observed attenuation curves of star-forming galaxies. The simulations, however, predict star-forming galaxies that are intrinsically more luminous than observations. Hence, the EDA does not predict star-forming galaxies with , found in the literature.
-
•
Lastly, we predict the attuenation curves of quiescent galaxies, which observations struggle to directly measure. We find that quiescent galaxies have curves with lower amplitudes and shallower slopes than star-forming galaxies. Over the entire population, we find that more massive galaxies have higher overall dust attenuation while galaxies with higher SSFR have steeper attenuation curves.
Our results clearly demonstrate that the EDA and a forward modeling approach provides key insights into dust attenuation. For those uninterested in dust, the EDA also provides a computationally feasible framework for marginalizing over dust when comparing simulations to observations. However, we find that dust attenuation is highly degenerate with differences in their galaxy physics prescriptions. Even though the simulations predict galaxy populations with significantly different physical properties, there is enough uncertainty in our understanding of dust that by adjusting attenuation they can all reproduce the same SDSS observations. This also suggests that any comparisons across simulations must marginalize over dust attenuation or run the risk of overinterpretation. Therefore, our current understanding of dust, or lack of, limit our ability to distinguish between the various hydrodynamical models and is a major bottleneck for investigating galaxy formation using simulations.
The forward modeling approach we present offers many avenues for improving on our understanding of dust. In this paper, we used a restrictive observational galaxy sample from SDSS. Comparison to a larger observed sample will place tighter constraints on EDA parameters and enable better differentiation between the simulations. One way to expand the observed galaxy sample would be to remove the completeness limits and include the SDSS survey selection in our forward model. Upcoming surveys, such as the DESI Bright Galaxy Survey and the PFS Galaxy Evolution Survey, will also soon provide much larger observational galaxy samples. Furthermore, IR observations, which measure dust emission and trace the total dust attenuation, have the potential to tightly constrain the EDA parameters and therefore break degeneracies between dust and the galaxy physics in simulations. In the next paper of the series, we will use the forward modeling approach with the EDA to investigate star formation quenching in galaxy formation models. In other future works, we will apply the EDA and a forward modeling approach to more statistically powerful samples and include IR observables in order to tightly constrain and reveal new insights into dust attenuation.
Acknowledgements
It’s a pleasure to thank Michael Blanton, Nicholas T. Faucher, Marla Geha, Shy Genel, Jenny E. Green, Daniel Kelson, Mariska Kriek, Peter Melchior, Desika Narayanan, Samir Salim, and Katherine Suess for valuable discussions and comments. This material is based upon work supported by the U.S. Department of Energy, Office of Science, Office of High Energy Physics, under contract No. DE-AC02-05CH11231. CH is supported by the AI Accelerator program of the Schmidt Futures Foundation.
We thank the Illustris collaboration and the Virgo Consortium for making their simulation data publicly available, and the SIMBA collaboration for sharing their data with us. The EAGLE and SIMBA simulations were performed using the DiRAC-2 facility at Durham, managed by the ICC, and the PRACE facility Curie based in France at TGCC, CEA, Bruyères-le-Châtel.
This research was supported in part through the computational resources and staff contributions provided by the Quest high performance computing facility at Northwestern University, which is jointly supported by the Office of the Provost, the Office for Research, and Northwestern University Information Technology.
The data used in this work were, in part, hosted on facilities supported by the Scientific Computing Core at the Flatiron Institute, a division of the Simons Foundation, and the analysis was largely done using those facilities. The IQ (Isolated & Quiescent) Collaboratory thanks the Flatiron Institute for hosting the collaboratory and its meetings. The Flatiron Institute is supported by the Simons Foundation. Funding for the Sloan Digital Sky Survey IV has been provided by the Alfred P. Sloan Foundation, the U.S. Department of Energy Office of Science, and the Participating Institutions. SDSS acknowledges support and resources from the Center for High-Performance Computing at the University of Utah. The SDSS web site is www.sdss.org. The SDSS is managed by the Astrophysical Research Consortium for the Participating Institutions.
Appendix A The Slab Model Based EDA
In our EDA prescription, we use the slab model to determine , the amplitude of attenuation, as a function of a randomly sampled inclination, , and (see Eq. 3 in Section 3). The slab model is based on the assumption that dust in galaxies have slab-like geometry and are illuminated by the stellar radiation source (Somerville & Primack, 1999). For a given , the attenuation depends solely on the orientation of the galaxy. While this simplification reproduces the correlation between and found in observed star-forming galaxies (e.g. Conroy et al., 2010; Wild et al., 2011; Battisti et al., 2017; Salim & Narayanan, 2020), it ignores the detailed star-to-dust geometry that impacts the attenuation curve. It also does not provide a physically-motivated prescription for quiescent galaxies, which typically have elliptical morphologies. Despite its limitations, the slab model provides a robust empirical prescription that allows us to produce realistic distributions of .
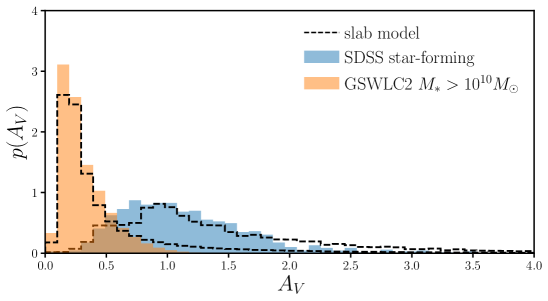
In Figure 13, we compare the distributions, , of star-forming galaxies in SDSS (blue) and galaxies in the Salim et al. (2018) GSWLC2 sample (orange) to generated from the slab model (black dashed). The values of the SDSS are derived using SED fitting from the Brinchmann et al. (2004) MPA-JHU catalog. The GSWLC2 values are also derived from SED fitting UV and optical photometry from GALEX and SDSS observations as well as mid-IR photometry from WISE. The GSWLC2 includes all galaxies, including quiescent ones, above . We generate two with the slab model for the SDSS and GSWLC2 samples separately. For each SDSS/GSWLC2 galaxy, we determine by uniformly sampling from 0 to 1 and derive (Eq. 4) with the galaxy’s measured and . We pick values within the prior range (Table 1) by hand to roughly reproduce the SDSS and GSWLC2 distributions.
Galaxies in SDSS and GSWLC2 have substantially different . While the galaxy populations only partially overlap, this difference is mostly due to inconsistencies in the measurements of MPA-JHU and GSWLC2 — even for the same galaxy. This difference in illustrates the challenges in directly measuring dust attenuation. Despite the dramatic differences between the two, the slab model can produce in good agreement with both observed distributions. We therefore conclude that the slab model provides a sufficiently flexible prescription to sample a realistic distribution of .
In addition to the slab model, in the EDA, we also use a linear dependence on and in the band optical depth, (see Eq. 4). This parameterization is motivated by observations that find significant correlation between and and (e.g. Garn & Best, 2010; Battisti et al., 2016; Salim & Narayanan, 2020). We take a closer look at this correlation using the GWSLC2 sample in Figure 14. We present the dependence of on (left panel) and (right panel). In the left panel, we divide the GSWLC2 galaxies by : (purple), (red), and (orange). For each of the bins, we find significant dependence in : more massive galaxies have higher . In the right panel, we divide the galaxies by : (blue) and (green). In both bins, galaxies with higher have higher . The dependence is stronger stronger for galaxies with , which roughly corresponds limit of our forward model (see Figure 11). Overall, the and dependence we find in from the GSWLC2 sample is consistent with previous observations and further motivates our EDA prescription.
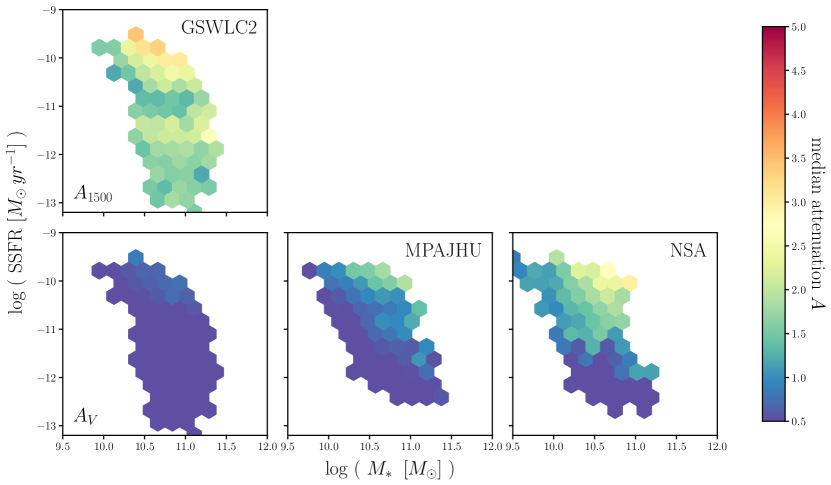
In Figure 15, we present the and dependence of dust attenuation in SDSS galaxies, which contains 2361 galaxies that pass our selection cut and are also in the GSWLC2 and MPA-JHU samples. In the top panel, we present from GSWLC2 as a function of and . In the bottom panels, we present from GSWLC2 (left), MPA-JHU (center), and NSA (right). The NSA measurements are derived assuming intrinsic Balmer decrement of 2.85, and O’Donnell (1994) extinction. The colormap in each hexbin represents the median attenuation for galaxies in the bin, same as in Figure 11. Bins with less than 5 galaxies are omitted. For each observational sample (column), we use and from the respective samples for consistency. We find the same and dependence of as Figure 14 even after our selection cut (bottom left). The bottom panels highlight that evven for the same galaxies, from GSWLC2, MPA-JHU, and NSA have significant differently amplitudes. and are also significantly different across the samples. Since observations have large discrepancies among dust attenuation measurements and a detailed comparison is beyond the scope of this work, we refrain from comparing our EDA predicted dust attenuation (Section 5) to observations.
References
- Abazajian et al. (2009) Abazajian K. N., et al., 2009, The Astrophysical Journal Supplement Series, 182, 543
- Aihara et al. (2011) Aihara H., et al., 2011, The Astrophysical Journal Supplement Series, 193, 29
- Akeret et al. (2015) Akeret J., Refregier A., Amara A., Seehars S., Hasner C., 2015, Journal of Cosmology and Astroparticle Physics, 2015, 043
- Ali et al. (2018) Ali S. S., Bremer M. N., Phillipps S., De Propris R., 2018, Monthly Notices of the Royal Astronomical Society, 476, 1010
- Alsing et al. (2018) Alsing J., Wandelt B., Feeney S., 2018, arXiv:1801.01497 [astro-ph]
- Anglés-Alcázar et al. (2017a) Anglés-Alcázar D., Davé R., Faucher-Giguère C.-A., Özel F., Hopkins P. F., 2017a, Monthly Notices of the Royal Astronomical Society, 464, 2840
- Anglés-Alcázar et al. (2017b) Anglés-Alcázar D., Faucher-Giguère C.-A., Kereš D., Hopkins P. F., Quataert E., Murray N., 2017b, MNRAS, 470, 4698
- Baes et al. (2019) Baes M., Trčka A., Camps P., Nersesian A., Trayford J., Theuns T., Dobbels W., 2019, arXiv:1901.08878 [astro-ph]
- Battisti et al. (2016) Battisti A. J., Calzetti D., Chary R.-R., 2016, The Astrophysical Journal, 818, 13
- Battisti et al. (2017) Battisti A. J., Calzetti D., Chary R.-R., 2017, The Astrophysical Journal, 840, 109
- Beaumont et al. (2009) Beaumont M. A., Cornuet J.-M., Marin J.-M., Robert C. P., 2009, Biometrika, 96, 983
- Blanton & Roweis (2007) Blanton M. R., Roweis S., 2007, The Astronomical Journal, 133, 734
- Blanton et al. (2005) Blanton M. R., et al., 2005, The Astronomical Journal, 129, 2562
- Blanton et al. (2011) Blanton M. R., Kazin E., Muna D., Weaver B. A., Price-Whelan A., 2011, The Astronomical Journal, 142, 31
- Booth & Schaye (2009) Booth C. M., Schaye J., 2009, Monthly Notices of the Royal Astronomical Society, 398, 53
- Brinchmann et al. (2004) Brinchmann J., Charlot S., White S. D. M., Tremonti C., Kauffmann G., Heckman T., Brinkmann J., 2004, Monthly Notices of the Royal Astronomical Society, 351, 1151
- Burgarella et al. (2005) Burgarella D., Buat V., Iglesias-Páramo J., 2005, Monthly Notices of the Royal Astronomical Society, 360, 1413
- Calzetti (2001) Calzetti D., 2001, New Astronomy Reviews, 45, 601
- Cameron & Pettitt (2012) Cameron E., Pettitt A. N., 2012, Monthly Notices of the Royal Astronomical Society, 425, 44
- Camps & Baes (2015) Camps P., Baes M., 2015, Astronomy and Computing, 9, 20
- Carnall et al. (2018) Carnall A. C., Leja J., Johnson B. D., McLure R. J., Dunlop J. S., Conroy C., 2018, arXiv:1811.03635 [astro-ph]
- Chabrier (2003) Chabrier G., 2003, Publications of the Astronomical Society of the Pacific, 115, 763
- Chevallard et al. (2013) Chevallard J., Charlot S., Wandelt B., Wild V., 2013, Monthly Notices of the Royal Astronomical Society, 432, 2061
- Choi et al. (2016) Choi J., Dotter A., Conroy C., Cantiello M., Paxton B., Johnson B. D., 2016, ApJ, 823, 102
- Cochrane et al. (2019) Cochrane R. K., et al., 2019, MNRAS, 488, 1779
- Code (1969) Code A. D., 1969, Publications of the Astronomical Society of the Pacific, 81, 475
- Conroy (2010) Conroy C., 2010, Monthly Notices of the Royal Astronomical Society, 404, 247
- Conroy (2013) Conroy C., 2013, Annual Review of Astronomy and Astrophysics, 51, 393
- Conroy et al. (2009) Conroy C., Gunn J. E., White M., 2009, The Astrophysical Journal, 699, 486
- Conroy et al. (2010) Conroy C., White M., Gunn J. E., 2010, The Astrophysical Journal, 708, 58
- Crain et al. (2015) Crain R. A., et al., 2015, Monthly Notices of the Royal Astronomical Society, 450, 1937
- DESI Collaboration et al. (2016) DESI Collaboration et al., 2016, arXiv:1611.00036 [astro-ph]
- Dalla Vecchia & Schaye (2012) Dalla Vecchia C., Schaye J., 2012, Monthly Notices of the Royal Astronomical Society, 426, 140
- Dantas et al. (2021) Dantas M. L. L., Coelho P. R. T., Sánchez-Blázquez P., 2021, Monthly Notices of the Royal Astronomical Society, 500, 1870
- Davé et al. (2016) Davé R., Thompson R., Hopkins P. F., 2016, Monthly Notices of the Royal Astronomical Society, 462, 3265
- Davé et al. (2017a) Davé R., Rafieferantsoa M. H., Thompson R. J., 2017a, arXiv:1704.01135 [astro-ph]
- Davé et al. (2017b) Davé R., Rafieferantsoa M. H., Thompson R. J., Hopkins P. F., 2017b, Monthly Notices of the Royal Astronomical Society, 467, 115
- Davé et al. (2019) Davé R., Anglés-Alcázar D., Narayanan D., Li Q., Rafieferantsoa M. H., Appleby S., 2019, Monthly Notices of the Royal Astronomical Society, 486, 2827
- Davé et al. (2020) Davé R., Crain R. A., Stevens A. R. H., Narayanan D., Saintonge A., Catinella B., Cortese L., 2020, MNRAS, 497, 146
- Del Moral et al. (2012) Del Moral P., Doucet A., Jasra A., 2012, Statistics and Computing, 22, 1009
- Dickey et al. (2020) Dickey C. M., et al., 2020, arXiv e-prints, 2010, arXiv:2010.01132
- Diggle & Gratton (1984) Diggle P. J., Gratton R. J., 1984, Journal of the Royal Statistical Society. Series B (Methodological), 46, 193
- Dotter (2016) Dotter A., 2016, ApJS, 222, 8
- Draine (2003) Draine B. T., 2003, The Astrophysical Journal, 598, 1017
- Fontanot et al. (2009) Fontanot F., Somerville R. S., Silva L., Monaco P., Skibba R., 2009, Monthly Notices of the Royal Astronomical Society, 392, 553
- Galliano et al. (2018) Galliano F., Galametz M., Jones A. P., 2018, Annual Review of Astronomy and Astrophysics, 56, 673
- Garn & Best (2010) Garn T., Best P. N., 2010, Monthly Notices of the Royal Astronomical Society, 409, 421
- Genel et al. (2014) Genel S., et al., 2014, Monthly Notices of the Royal Astronomical Society, 445, 175
- Gonzalez-Perez et al. (2013) Gonzalez-Perez V., Lacey C. G., Baugh C. M., Frenk C. S., Wilkins S. M., 2013, Monthly Notices of the Royal Astronomical Society, 429, 1609
- Gordon et al. (1994) Gordon K. D., Witt A. N., Carruthers G. R., Christensen S. A., Dohne B. C., 1994, The Astrophysical Journal, 432, 641
- Granato et al. (2000) Granato G. L., Lacey C. G., Silva L., Bressan A., Baugh C. M., Cole S., Frenk C. S., 2000, The Astrophysical Journal, 542, 710
- Hahn et al. (2017a) Hahn C., Vakili M., Walsh K., Hearin A. P., Hogg D. W., Campbell D., 2017a, Monthly Notices of the Royal Astronomical Society, 469, 2791
- Hahn et al. (2017b) Hahn C., Tinker J. L., Wetzel A. R., 2017b, The Astrophysical Journal, 841, 6
- Hahn et al. (2019a) Hahn C., Tinker J. L., Wetzel A., 2019a, arXiv:1910.01644 [astro-ph]
- Hahn et al. (2019b) Hahn C., Beutler F., Sinha M., Berlind A., Ho S., Hogg D. W., 2019b, Monthly Notices of the Royal Astronomical Society, 485, 2956
- Hahn et al. (2019c) Hahn C., et al., 2019c, The Astrophysical Journal, 872, 160
- Han et al. (2007) Han Z., Podsiadlowski P., Lynas-Gray A. E., 2007, Monthly Notices of the Royal Astronomical Society, 380, 1098
- Hayward & Smith (2015) Hayward C. C., Smith D. J. B., 2015, Monthly Notices of the Royal Astronomical Society, 446, 1512
- Hopkins (2015) Hopkins P. F., 2015, Monthly Notices of the Royal Astronomical Society, 450, 53
- Hopkins et al. (2017) Hopkins P. F., et al., 2017, arXiv:1707.07010 [astro-ph]
- Hou et al. (2017) Hou K.-C., Hirashita H., Nagamine K., Aoyama S., Shimizu I., 2017, Monthly Notices of the Royal Astronomical Society, 469, 870
- Ishida et al. (2015) Ishida E. E. O., et al., 2015, Astronomy and Computing, 13, 1
- Jonsson (2006) Jonsson P., 2006, Monthly Notices of the Royal Astronomical Society, 372, 2
- Katsianis et al. (2020) Katsianis A., et al., 2020, Monthly Notices of the Royal Astronomical Society, 492, 5592
- Kaviraj et al. (2007) Kaviraj S., et al., 2007, The Astrophysical Journal Supplement Series, 173, 619
- Kirkpatrick et al. (2015) Kirkpatrick A., Pope A., Sajina A., Roebuck E., Yan L., Armus L., Díaz-Santos T., Stierwalt S., 2015, The Astrophysical Journal, 814, 9
- Kriek & Conroy (2013) Kriek M., Conroy C., 2013, The Astrophysical Journal Letters, 775, L16
- Le Cras et al. (2016) Le Cras C., Maraston C., Thomas D., York D. G., 2016, Monthly Notices of the Royal Astronomical Society, 461, 766
- Leja et al. (2017) Leja J., Johnson B. D., Conroy C., van Dokkum P. G., Byler N., 2017, The Astrophysical Journal, 837, 170
- Leja et al. (2018) Leja J., Johnson B. D., Conroy C., van Dokkum P., 2018, The Astrophysical Journal, 854, 62
- Leja et al. (2019) Leja J., Carnall A. C., Johnson B. D., Conroy C., Speagle J. S., 2019, ApJ, 876, 3
- Li et al. (2019) Li Q., Narayanan D., Davé R., 2019, MNRAS, 490, 1425
- Lin et al. (2016) Lin C.-A., Kilbinger M., Pires S., 2016, Astronomy and Astrophysics, 593, A88
- Marinacci et al. (2018) Marinacci F., et al., 2018, MNRAS, 480, 5113
- McAlpine et al. (2016) McAlpine S., et al., 2016, Astronomy and Computing, 15, 72
- Meisner et al. (2018) Meisner A. M., Lang D., Schlegel D. J., 2018, Research Notes of the American Astronomical Society, 2, 1
- Muratov et al. (2015) Muratov A. L., Kereš D., Faucher-Giguère C.-A., Hopkins P. F., Quataert E., Murray N., 2015, MNRAS, 454, 2691
- Naiman et al. (2018) Naiman J. P., et al., 2018, MNRAS, 477, 1206
- Narayanan et al. (2018) Narayanan D., Conroy C., Davé R., Johnson B. D., Popping G., 2018, The Astrophysical Journal, 869, 70
- Natale et al. (2015) Natale G., Popescu C. C., Tuffs R. J., Debattista V. P., Fischera J., Grootes M. W., 2015, Monthly Notices of the Royal Astronomical Society, 449, 243
- Nelson et al. (2015) Nelson D., et al., 2015, Astronomy and Computing, 13, 12
- Nelson et al. (2018) Nelson D., et al., 2018, Monthly Notices of the Royal Astronomical Society, 475, 624
- Nelson et al. (2019) Nelson D., et al., 2019, Computational Astrophysics and Cosmology, 6, 2
- Noll et al. (2009) Noll S., Burgarella D., Giovannoli E., Buat V., Marcillac D., Muñoz-Mateos J. C., 2009, Astronomy and Astrophysics, 507, 1793
- O’Connell (1999) O’Connell R. W., 1999, Annual Review of Astronomy and Astrophysics, 37, 603
- O’Donnell (1994) O’Donnell J. E., 1994, ApJ, 422, 158
- Paxton et al. (2011) Paxton B., Bildsten L., Dotter A., Herwig F., Lesaffre P., Timmes F., 2011, ApJS, 192, 3
- Paxton et al. (2013) Paxton B., et al., 2013, ApJS, 208, 4
- Paxton et al. (2015) Paxton B., et al., 2015, ApJS, 220, 15
- Pillepich et al. (2018) Pillepich A., et al., 2018, Monthly Notices of the Royal Astronomical Society, 473, 4077
- Popping et al. (2017) Popping G., Somerville R. S., Galametz M., 2017, Monthly Notices of the Royal Astronomical Society, 471, 3152
- Pritchard et al. (1999) Pritchard J. K., Seielstad M. T., Perez-Lezaun A., Feldman M. W., 1999, Molecular Biology and Evolution, 16, 1791
- Reddy et al. (2015) Reddy N. A., et al., 2015, The Astrophysical Journal, 806, 259
- Rocha et al. (2008) Rocha M., Jonsson P., Primack J. R., Cox T. J., 2008, Monthly Notices of the Royal Astronomical Society, 383, 1281
- Rodriguez-Gomez et al. (2019) Rodriguez-Gomez V., et al., 2019, MNRAS, 483, 4140
- Ruiz-Macias et al. (2020) Ruiz-Macias O., et al., 2020, arXiv:2007.14950 [astro-ph]
- Salim & Narayanan (2020) Salim S., Narayanan D., 2020, arXiv:2001.03181 [astro-ph]
- Salim et al. (2016) Salim S., et al., 2016, The Astrophysical Journal Supplement Series, 227, 2
- Salim et al. (2018) Salim S., Boquien M., Lee J. C., 2018, The Astrophysical Journal, 859, 11
- Sánchez-Blázquez et al. (2006) Sánchez-Blázquez P., et al., 2006, MNRAS, 371, 703
- Schaye et al. (2015) Schaye J., et al., 2015, Monthly Notices of the Royal Astronomical Society, 446, 521
- Seon & Draine (2016) Seon K.-I., Draine B. T., 2016, The Astrophysical Journal, 833, 201
- Somerville & Primack (1999) Somerville R. S., Primack J. R., 1999, Monthly Notices of the Royal Astronomical Society, 310, 1087
- Somerville et al. (2012) Somerville R. S., Gilmore R. C., Primack J. R., Domínguez A., 2012, Monthly Notices of the Royal Astronomical Society, 423, 1992
- Speagle et al. (2014) Speagle J. S., Steinhardt C. L., Capak P. L., Silverman J. D., 2014, The Astrophysical Journal Supplement Series, 214, 15
- Springel (2005) Springel V., 2005, Monthly Notices of the Royal Astronomical Society, 364, 1105
- Springel et al. (2018) Springel V., et al., 2018, Monthly Notices of the Royal Astronomical Society, 475, 676
- Steinacker et al. (2013) Steinacker J., Baes M., Gordon K. D., 2013, Annual Review of Astronomy and Astrophysics, 51, 63
- Takada et al. (2014) Takada M., et al., 2014, Publications of the Astronomical Society of Japan, 66, R1
- Tamura et al. (2016) Tamura N., et al., 2016, in Ground-Based and Airborne Instrumentation for Astronomy VI. eprint: arXiv:1608.01075, p. 99081M, doi:10.1117/12.2232103
- Tavare et al. (1997) Tavare S., Balding D. J., Griffiths R. C., Donnelly P., 1997, Genetics, 145, 505
- Tinker et al. (2011) Tinker J., Wetzel A., Conroy C., 2011, preprint, 1107, arXiv:1107.5046
- Trayford et al. (2015) Trayford J. W., et al., 2015, Monthly Notices of the Royal Astronomical Society, 452, 2879
- Trayford et al. (2017) Trayford J. W., et al., 2017, Monthly Notices of the Royal Astronomical Society, 470, 771
- Trayford et al. (2020) Trayford J. W., Lagos C. d. P., Robotham A. S. G., Obreschkow D., 2020, Monthly Notices of the Royal Astronomical Society, 491, 3937
- Tress et al. (2018) Tress M., et al., 2018, Monthly Notices of the Royal Astronomical Society, 475, 2363
- Vogelsberger et al. (2014) Vogelsberger M., et al., 2014, Monthly Notices of the Royal Astronomical Society, 444, 1518
- Vogelsberger et al. (2020) Vogelsberger M., et al., 2020, Monthly Notices of the Royal Astronomical Society, 492, 5167
- Walcher et al. (2011) Walcher J., Groves B., Budavári T., Dale D., 2011, Astrophysics and Space Science, 331, 1
- Wechsler & Tinker (2018) Wechsler R. H., Tinker J. L., 2018, preprint, 1804, arXiv:1804.03097
- Weinberger et al. (2018) Weinberger R., et al., 2018, Monthly Notices of the Royal Astronomical Society, 479, 4056
- Weyant et al. (2013) Weyant A., Schafer C., Wood-Vasey W. M., 2013, The Astrophysical Journal, 764, 116
- Wild et al. (2011) Wild V., Charlot S., Brinchmann J., Heckman T., Vince O., Pacifici C., Chevallard J., 2011, Monthly Notices of the Royal Astronomical Society, 417, 1760
- Wilkins et al. (2012) Wilkins S. M., Gonzalez-Perez V., Lacey C. G., Baugh C. M., 2012, Monthly Notices of the Royal Astronomical Society, 424, 1522
- Witt & Gordon (1996) Witt A. N., Gordon K. D., 1996, The Astrophysical Journal, 463, 681
- Witt & Gordon (2000) Witt A. N., Gordon K. D., 2000, The Astrophysical Journal, 528, 799
- Yi et al. (1997) Yi S., Demarque P., Kim Y.-C., 1997, The Astrophysical Journal, 482, 677
- Yung et al. (2019) Yung L. Y. A., Somerville R. S., Finkelstein S. L., Popping G., Davé R., 2019, Monthly Notices of the Royal Astronomical Society, 483, 2983
- da Cunha et al. (2008) da Cunha E., Charlot S., Elbaz D., 2008, Monthly Notices of the Royal Astronomical Society, 388, 1595