Strong correlation between Fe II/Mg II ratio and Eddington ratio of type 1 Active galactic nuclei
Abstract
The Fe II/Mg II line flux ratio has been used as an indicator of the Fe/Mg abundance ratio in
the broad line region (BLR) of active galactic nuclei (AGNs).
On the basis of archival rest-frame UV spectra obtained via the Hubble Space Telescope and
the Sloan Digital Sky Survey, we investigate the Fe II/Mg II ratios of type 1 AGNs at z ¡ 2.
Over wide dynamic ranges of AGN properties (i.e., black hole mass, AGN luminosity, and Eddington ratio),
we confirm that the Fe II/Mg II ratio strongly correlates with Eddington ratio but not with black hole mass,
AGN luminosity, or redshift. Our results suggest that the metallicity
in the BLR are physically related to the accretion activity of AGNs, but not to the global properties of galaxies
(i.e., galaxy mass and luminosity). With regard to the relation between
the BLR metallicity and the accretion rate of AGNs, we discuss that metal cooling may play an important
role in enhancing the gas inflow into the central region of host galaxies, resulting in the high accretion rate of AGNs.
Subject headings:
galaxies: active — galaxies: ISM — galaxies: nuclei — quasars: emission lines — ultraviolet: galaxies1. INTRODUCTION
In understanding galaxy evolution, the chemical properties of galaxies have been considered as one of the key parameters since they are closely related to the star formation history (see Maiolino & Mannucci 2019 for a review). For normal galaxies, gas metallicity exhibits tight scaling relations with galaxy properties (i.e., mass and luminosity) with these relations evolving as a function of redshift up to 3.5 (e.g., Erb et al., 2006; Maiolino et al., 2008; Mannucci et al., 2009; Yabe et al., 2012; Onodera et al., 2016), which indicates the cosmic evolution of galaxy metallicity. At a higher redshift (i.e., z ¿ 3.5), however, the characteristic of galaxy metallicity is poorly understood since it is challenging to measure the gas metallicity of normal galaxies at such redshift levels (but see e.g., Nagao et al., 2012; Shapley et al., 2017; Tadaki et al., 2019).
Alternatively, active galactic nuclei (AGNs) can be investigated thanks to their high luminosity. Through theoretical models (e.g., CLOUDY), several ultraviolet (UV) line flux ratios (e.g., N V1240/C IV1549; hereafter N V/C IV) have been proposed as indicators of the metallicity of the broad line region (BLR) of AGNs with these line ratios have exhibiting a correlation with AGN luminosity (e.g., Hamann & Ferland, 1992, 1993; Nagao et al., 2006). Since AGN luminosity is determined by the combination of the mass of supermassive black holes (SMBHs) and Eddington ratio, there were efforts to reveal the physical origin of the BLR metallicity – AGN luminosity relation between black hole mass and Eddington ratio.
On the one hand, it has been found that BLR metallicity correlates with black hole mass (Warner et al., 2004; Matsuoka et al., 2011). The mass of SMBHs shows scaling relations with the properties of their host galaxies (i.e., mass, luminosity and stellar velocity dispersion), implying the co-evolution of SMBHs and their host galaxies (Magorrian et al., 1998; Ferrarese & Merritt, 2000; Gebhardt et al., 2000; Marconi & Hunt, 2003; Häring & Rix, 2004; Kormendy & Ho, 2013; Woo et al., 2013, 2015). Therefore, based on the relation between the global properties (i.e., mass) and the gas metallicity of galaxies, BLR metallicity can be expected to be connected to the galaxy metallicity. On the other hand, Shemmer et al. (2004) reported a correlation between BLR metallicity and Eddington ratio, but not black hole mass. This finding was confirmed by Shin et al. (2013), who investigated low redshift AGNs over a larger dynamic range (e.g., 3 dex) of black hole mass and Eddington ratio. Based on the findings, they discussed a physical connection between the accretion activity of AGNs and the star formation history of the central region of galaxies.
Interestingly, no cosmic evolution of the BLR metallicity based on N V/C IV has been reported up to redshift6 (e.g., Nagao et al., 2006; Juarez et al., 2009), suggesting that the BLR metallicity was already enriched at a universe age of 1 Gyr (z6) and that the first star formation episode occurred at a redshift of higher than 10. This is inconsistent with the trend of galaxy metallicity, which clearly exhibits cosmic evolution (e.g., Maiolino et al., 2008; Troncoso et al., 2014).
In understanding the chemical properties of the BLR, another flux ratio between UV Fe II multiplet and Mg II2800 (hereafter Fe II/Mg II), has been investigated as a first-order proxy of the Fe/Mg abundance ratio in the BLR. Similar to the BLR metallicity indicator (i.e., N V/C IV), the Fe II/Mg II ratio also shows no dependency on redshift up to z7 (e.g., Barth et al., 2003; Maiolino et al., 2003; De Rosa et al., 2011; Mazzucchelli et al., 2017; Shin et al., 2019; Onoue et al., 2020; Sameshima et al., 2020; Schindler et al., 2020), which supports the idea of an absence of cosmic evolution in the chemical properties of the BLR. However, in contrast to the BLR metallicity indicators, the Fe II/Mg II ratio shows different relations with AGN properties since the Fe II/Mg II ratio correlates with Eddington ratio and black hole mass, but not with AGN luminosity (Dong et al., 2011; Shin et al., 2019, see also Sameshima et al. 2017).
In our previous study (Shin et al., 2019, hereafter Paper I), we discussed potential sample selection bias that likely led to the absence of a correlation between the Fe II/Mg II ratio and AGN luminosity. The limitation of the previous studies (i.e., Dong et al. 2011 and Paper I) is that only luminous and massive AGNs were investigated (i.e., log L46, MBH ¿ ). The enrichment of galaxy metallicity is found to be less significant in massive galaxies as a function of cosmic time, which may mean that massive galaxies are likely chemically matured (see e.g., Maiolino et al., 2008). Similarly, the luminous and massive AGNs can be likely chemically matured. This, in turn, may be a reason why no dependency of the Fe II/Mg II ratio on redshift and AGN luminosity was observed in the previous works.
Motivated by this consideration, we investigate the Fe II/Mg II ratio of type 1 AGNs at z ¡ 2 over wide dynamic ranges
of AGN properties (i.e., black hole mass, AGN luminosity, and Eddington ratio) to better understand the relation between
the Fe II/Mg II ratio and the AGN properties.
In section 2, we describe the sample and data. The analysis is described in section 3,
and our main results and discussion are presented in sections 4 and 5. We adopt a cosmology of
km s-1 Mpc-1, and .
2. Sample and Data
In this work, we investigate two type 1 AGN samples: (i) low redshift type 1 AGNs (z ¡ 0.4) with available archival UV spectra and (ii) Sloan Digital Sky Survey (SDSS) quasars at 0.46 ¡ z ¡ 2.02.
For the low redshift AGNs, we first selected 84,040 type 1 AGNs at z ¡ 0.75 from the Million Quasars (MILLIQUAS) catalog (Version 6.3, June 2019, Flesch 2015), with an object classification of either A (25,989) or Q (58,051). Among them, we found 77 objects with available archival Hubble Space Telescope (HST) spectroscopic data (i.e., COS, STIS, and FOS), which was searched within a radius of 3″, covering the wavelength range of 2600-3050Å in the rest frame. In previous works of Fe II/Mg II ratio, Fe II flux has been generally fitted and integrated over the wavelength range of 2200-3090Å (e.g., Maiolino et al. 2003; Sameshima et al. 2017; Paper I). However, the requirement of the wide wavelength range limits sample size. In Paper I, we demonstrated that a narrower wavelength range of 2600–3050Å is acceptable for the flux estimation of Fe II, albeit a non-negligible uncertainty could emerge. This wavelength range of 2600-3050 was thus adopted to expand the sample size.
We retrieved the single epoch spectra of the 77 objects that showed the best data quality (i.e., signal-to-noise ratio, SNR, at 3000Å continuum). We then finalized the sample of 29 type 1 AGNs using the following five criteria, (i) amplitude-to-noise ratio of Mg II, ANRMgII ¿ 5, (ii) ANR of Fe II, ANRFeII ¿ 3, (iii) SNR at 3000Å continuum, SNR3000 ¿3, (iv) no narrow or broad absorption lines (NAL or BAL) objects, and (v) no type 2 AGNs. The first, second, and third criteria were adopted to obtain reliable measurements of Mg II and Fe II fluxes and AGN luminosity. For the second criteria, we defined the ANRFeII as the ratio of the peak flux density of the best-fit iron model to the noise at 3000Å. There is one issue for measuring the ANRFeII that Fe II is blended with Mg II, the power-law continuum, and Balmer pseudo continuum. This means that deblending Fe II is required through multi-component fitting to measure the ANRFeII. Moreover, due to the blending with Mg II, the choice of Mg II line profile in the multi-component fitting can affect the value of the ANRFeII. In this work, we adopted the ANRFeII from the fitting with double Gaussian profile for Mg II. We refer to Section 3 for more details. We excluded three AGNs with prominent absorption features (NAL: NGC 4151 and NGC 3227, BAL: UGC 8058) since the absorption features can severely affect the line flux estimations of both Mg II and Fe II. Lastly, we found three type 2 AGNs (Mrk 348, Mrk 3, and NGC 1068), which are misclassified as type 1 AGNs in the MILLIQUAS catalog. Since type 2 AGNs do not present broad emission lines (i.e., Mg II and Fe II), which is our main area of interest, they were excluded. The information on the final sample is presented in Table 1. We note that 11 of the 29 type 1 AGNs (38%) cover the full wavelength range of Fe II, 2200-3090Å.
In addition, we included a number of SDSS quasars from the SDSS DR7 quasars catalog (Shen et al., 2011).
We selected 5,441 quasars in the redshift range of 0.46 ¡ z ¡ 2.02, whose spectrum covers the rest-frame wavelength range of 2600-3050Å,
and the SNR at 3000Å continuum is larger than 20.
Among them, we excluded 1,380 objects with strong absorption lines
(i.e., BAL and NAL) and/or weak emission lines (i.e., ANR ¡ 5 and ANR ¡ 3), leaving a final sample of 4,061 quasars.
Note that this sample includes the 3,164 quasars in a narrower redshift range (i.e., 0.75 ¡ z ¡ 1.96),
which were investigated in Paper I, and the majority (895) of the newly included 897 quasars are at low redshift (i.e., 0.46¡z¡0.75).
| Object | Redshift | Instrument | Grating | Obs. Date |
|---|---|---|---|---|
| (1) | (2) | (3) | (4) | (5) |
| KUG 0003+199 | FOS | G270H | 1994 Dec 16 | |
| FIRST J0012-1022 | STIS | G430L | 2011 May 14 | |
| PGC 87392 | FOS | G270H | 1996 Jul 30 | |
| ESO 113-45 | FOS | G270H | 1993 Jan 22 | |
| HE 0132-4313 | FOS | G270H, G400H | 1996 Sep 21 | |
| 3C 48.0 | STIS | G430L | 2011 Mar 3 | |
| SDSS J015530.02-085704.0 | STIS | G430L | 2011 Feb 2 | |
| AKN 120 | FOS | G270H | 1995 Jul 29 | |
| PG 0844+349 | FOS | G270H | 1992 Jan 10 | |
| KUG 0921+525 | STIS | G230L | 2017 Dec 25 | |
| SDSS J094603.94+013923.6 | STIS | G430L | 2011 Mar 24 | |
| NGC 3516 | FOS | G270H | 1996 Feb 21 | |
| MCG 10-16-111 | STIS | G230L | 2013 Jul 12 | |
| MCG 9-19-073 | STIS | G230L | 2013 Apr 29 | |
| CGCG 13-24 | STIS | G230L | 2013 Jun 7 | |
| MARK 50 | STIS | G230L | 2012 Feb 12 | |
| 3C 273 | STIS | G430L | 1999 Jan 31 | |
| RXS J12517+2404 | STIS | G430L | 2011 Apr 26 | |
| 3C 277.1 | FOS | G400H | 1991 Nov 2 | |
| NGC 5548 | FOS | G270H | 1992 Jul 5 | |
| UGC 10120 | STIS | G230L | 2017 Aug 29 | |
| SBS 1701+610 | STIS | G430L | 1999 May 2 | |
| SDSS J171448.50+332738.3 | STIS | G430L | 2010 Oct 15 | |
| CGCG 229-15 | STIS | G230L | 2013 Jul 23 | |
| NGC 6814 | STIS | G230L | 2013 May 7 | |
| MARK 509 | STIS | G230L | 2017 Oct 22 | |
| B2 2201+31A | FOS | G270H, G400H | 1991 Sep 6 | |
| MR 2251-178 | FOS | G270H | 1996 Aug 2 | |
| NGC 7469 | FOS | G270H | 1996 Jun 18 |
Note. — Col. (1): Target name from the MILLIQUAS catalog (Flesch, 2015).
3. Analysis
To measure the Fe II/Mg II ratios of the type 1 AGNs, we performed multi-component
fitting analysis using the components of Mg II, Fe II, the power-law continuum and Balmer pseudo
continuum, as performed in Paper I. For the fitting of Fe II, we adopted the iron template provided
by Tsuzuki et al. (2006). Note that we did not use the iron template of Vestergaard & Wilkes (2001) because
of the lack of iron information around Mg II (2770-2820Å), which may lead over- or under- estimation
of Mg II and Fe II fluxes, respectively (Dietrich et al. 2003; Woo et al. 2018; Paper I; Schindler et al. 2020).
In addition to the analysis method described in Paper I, we considered two more issues, 1) the line profile of Mg II,
and 2) the contribution of host galaxy in UV spectra, which will be described as follows.
3.1. Line profile of Mg II
In previous works, Mg II has been analyzed with various line profiles because of the complex line profile of Mg II. Among them, double Gaussian and Gauss-Hermite series have been widely adopted to reproduce the observed Mg II line profile showing a wing component (e.g., Marziani et al., 2013; Kovačević-Dojčinović & Popović, 2015; Woo et al., 2018; Bahk et al., 2019; Le & Woo, 2019; Popović et al., 2019; Le et al., 2020). On the other hand, for AGNs with high accretion rate, it has been reported that a Lorentzian profile gives better fitting result than the double Gaussian and Gaussian profiles (Marziani et al., 2013).
In Paper I, we adopted a single Gaussian profile for Mg II fitting due to the low data quality of high redshift quasars (i.e., at z3) in the work. As a comparison, we performed another fitting with a 6th order Gauss-Hermite profile for Mg II and found that the measured Fe II/Mg II ratios from fitting with the single Gaussian and Gauss-Hermite profiles are consistent within 7%. However, we did not test fitting with other line profiles (i.e., double Gaussian and Lorentzian).
To better understand whether the Mg II line profiles can affect the measurements the Fe II/Mg II ratio, we adopted various line profiles for Mg II, 1) single Gaussian, 2) double Gaussian, 3) 6th order Gauss-Hermite series, and 4) Lorentzian profiles in the multi-component fitting analysis.
3.2. Host galaxy continuum
In AGN spectra, there could be non-negligible contamination from their host galaxy. With the detection of several stellar absorption lines (i.e., Mgb, Fe5270, & Fe5335), the host galaxy contamination in optical window has been identified and removed for the reliable investigation of AGN properties (e.g., Park et al., 2012, 2015; Bon et al., 2020). Shen et al. (2011) statistically found that low luminous AGNs ( ¡ 45 or ¡ 46) are more likely contaminated by the host galaxy continuum (e.g., 20% for AGNs with 44.5 or 45.5). Moreover, Bon et al. (2020) reported that host galaxy continuum could affect the shape of Fe II in the optical window. Similarly, the host galaxy contamination can be expected at UV, especially due to young stellar population (e.g., Leitherer et al., 2011), which could affect the measurement of Fe II flux and AGN luminosity in the UV window.
However, it seems challenging to investigate the host galaxy contamination in this work due to the following reason.
In the wavelength of 2600–3050Å, strong absorption lines are Fe II 2600, Mg II, and
Mg I 2852, while we have no AGNs exhibiting prominent absorption features at those lines in our sample of
low redshift AGNs and SDSS quasars. During our sample selection process, we detected such AGNs
(e.g., NGC 4151 an NGC 3227, see Section 2). However, we discarded them based on the assumption that they are NAL AGNs.
We note that 15 targets out of our 29 low redshift AGNs exhibit prominent absorption line features, which are not
related to Fe II 2600, Mg II, and Mg I 2852. By considering the redshift of the 15 targets,
all of their absorption lines are likely Milky way absorption lines (Savage et al., 2000),
which are produced by gas in the disk and halo of the Milky Way. Therefore, the absorption lines
are not related to the host galaxy continuum.
Since we can not properly investigate the host galaxy contamination without
stellar absorption lines, we decided not to consider the host galaxy contamination in this work.
We note that AGNs with the nondetection of Mg II absorption line suggest that
their host galaxy contamination maybe not significant in their UV spectra.
To investigate the host galaxy contamination in UV, one can use high-quality spectra covering
wide wavelength range (i.e., UV to optical) and showing prominent absorption lines (Mgb, Fe5270, and Fe5335)
in future.
3.3. Fitting procedure and measurement
With the four line profiles for Mg II, we performed the multicomponent fitting analysis. We note that we accepted the fitting with the double Gaussian profile only if the ANR of each Gaussian component is all larger than three. Otherwise, we adopted the fitting with the single Gaussian line profile.
During the fitting process, we did not give any kinematic constraints between Mg II and Fe II to avoid any possible bias. This is different from Paper I, which gave constraints that Mg II and Fe II have the same velocity shift and similar velocity dispersion ( ¡ 10%). However, we note that the kinematic constraint does not significantly affect the measurements of Mg II and Fe II fluxes and the Fe II/Mg II ratio as discussed in Paper I (see their Figure 8).
From the best-fit model, we measured the flux and velocity dispersion of Mg II, whereas for the flux of Fe II, we integrated the best iron model over the wavelength range, 2600–3050Å. In Figure 1, we present the comparisons of the Mg II flux, Fe II flux, and Fe II/Mg II ratio, which were measured from the fitting with the four Mg II line profiles. From the comparisons, we found three trends. First, the measurements from the fitting with the double Gaussian and 6th order Gauss-Hermite line profiles are consistent. Second, the fitting with double Gaussian line profile gives larger Mg II fluxes but smaller Fe II fluxes and Fe II/Mg II ratios than those from the single Gaussian fitting. This would be because the wing component of Mg II can not be fitted with the single Gaussian profile. Third, the double Gaussian fitting provides smaller Mg II flux and larger Fe II flux and Fe II/Mg II ratio than the Lorentzian fitting, suggesting that the Lorentzian profile tends to more fit the wing component of MgII line than the double Gaussian. While their are non-negligible scatters and offsets described above, the measurements from the fitting with various Mg II line profiles, generally show strong linear relationships between each other.
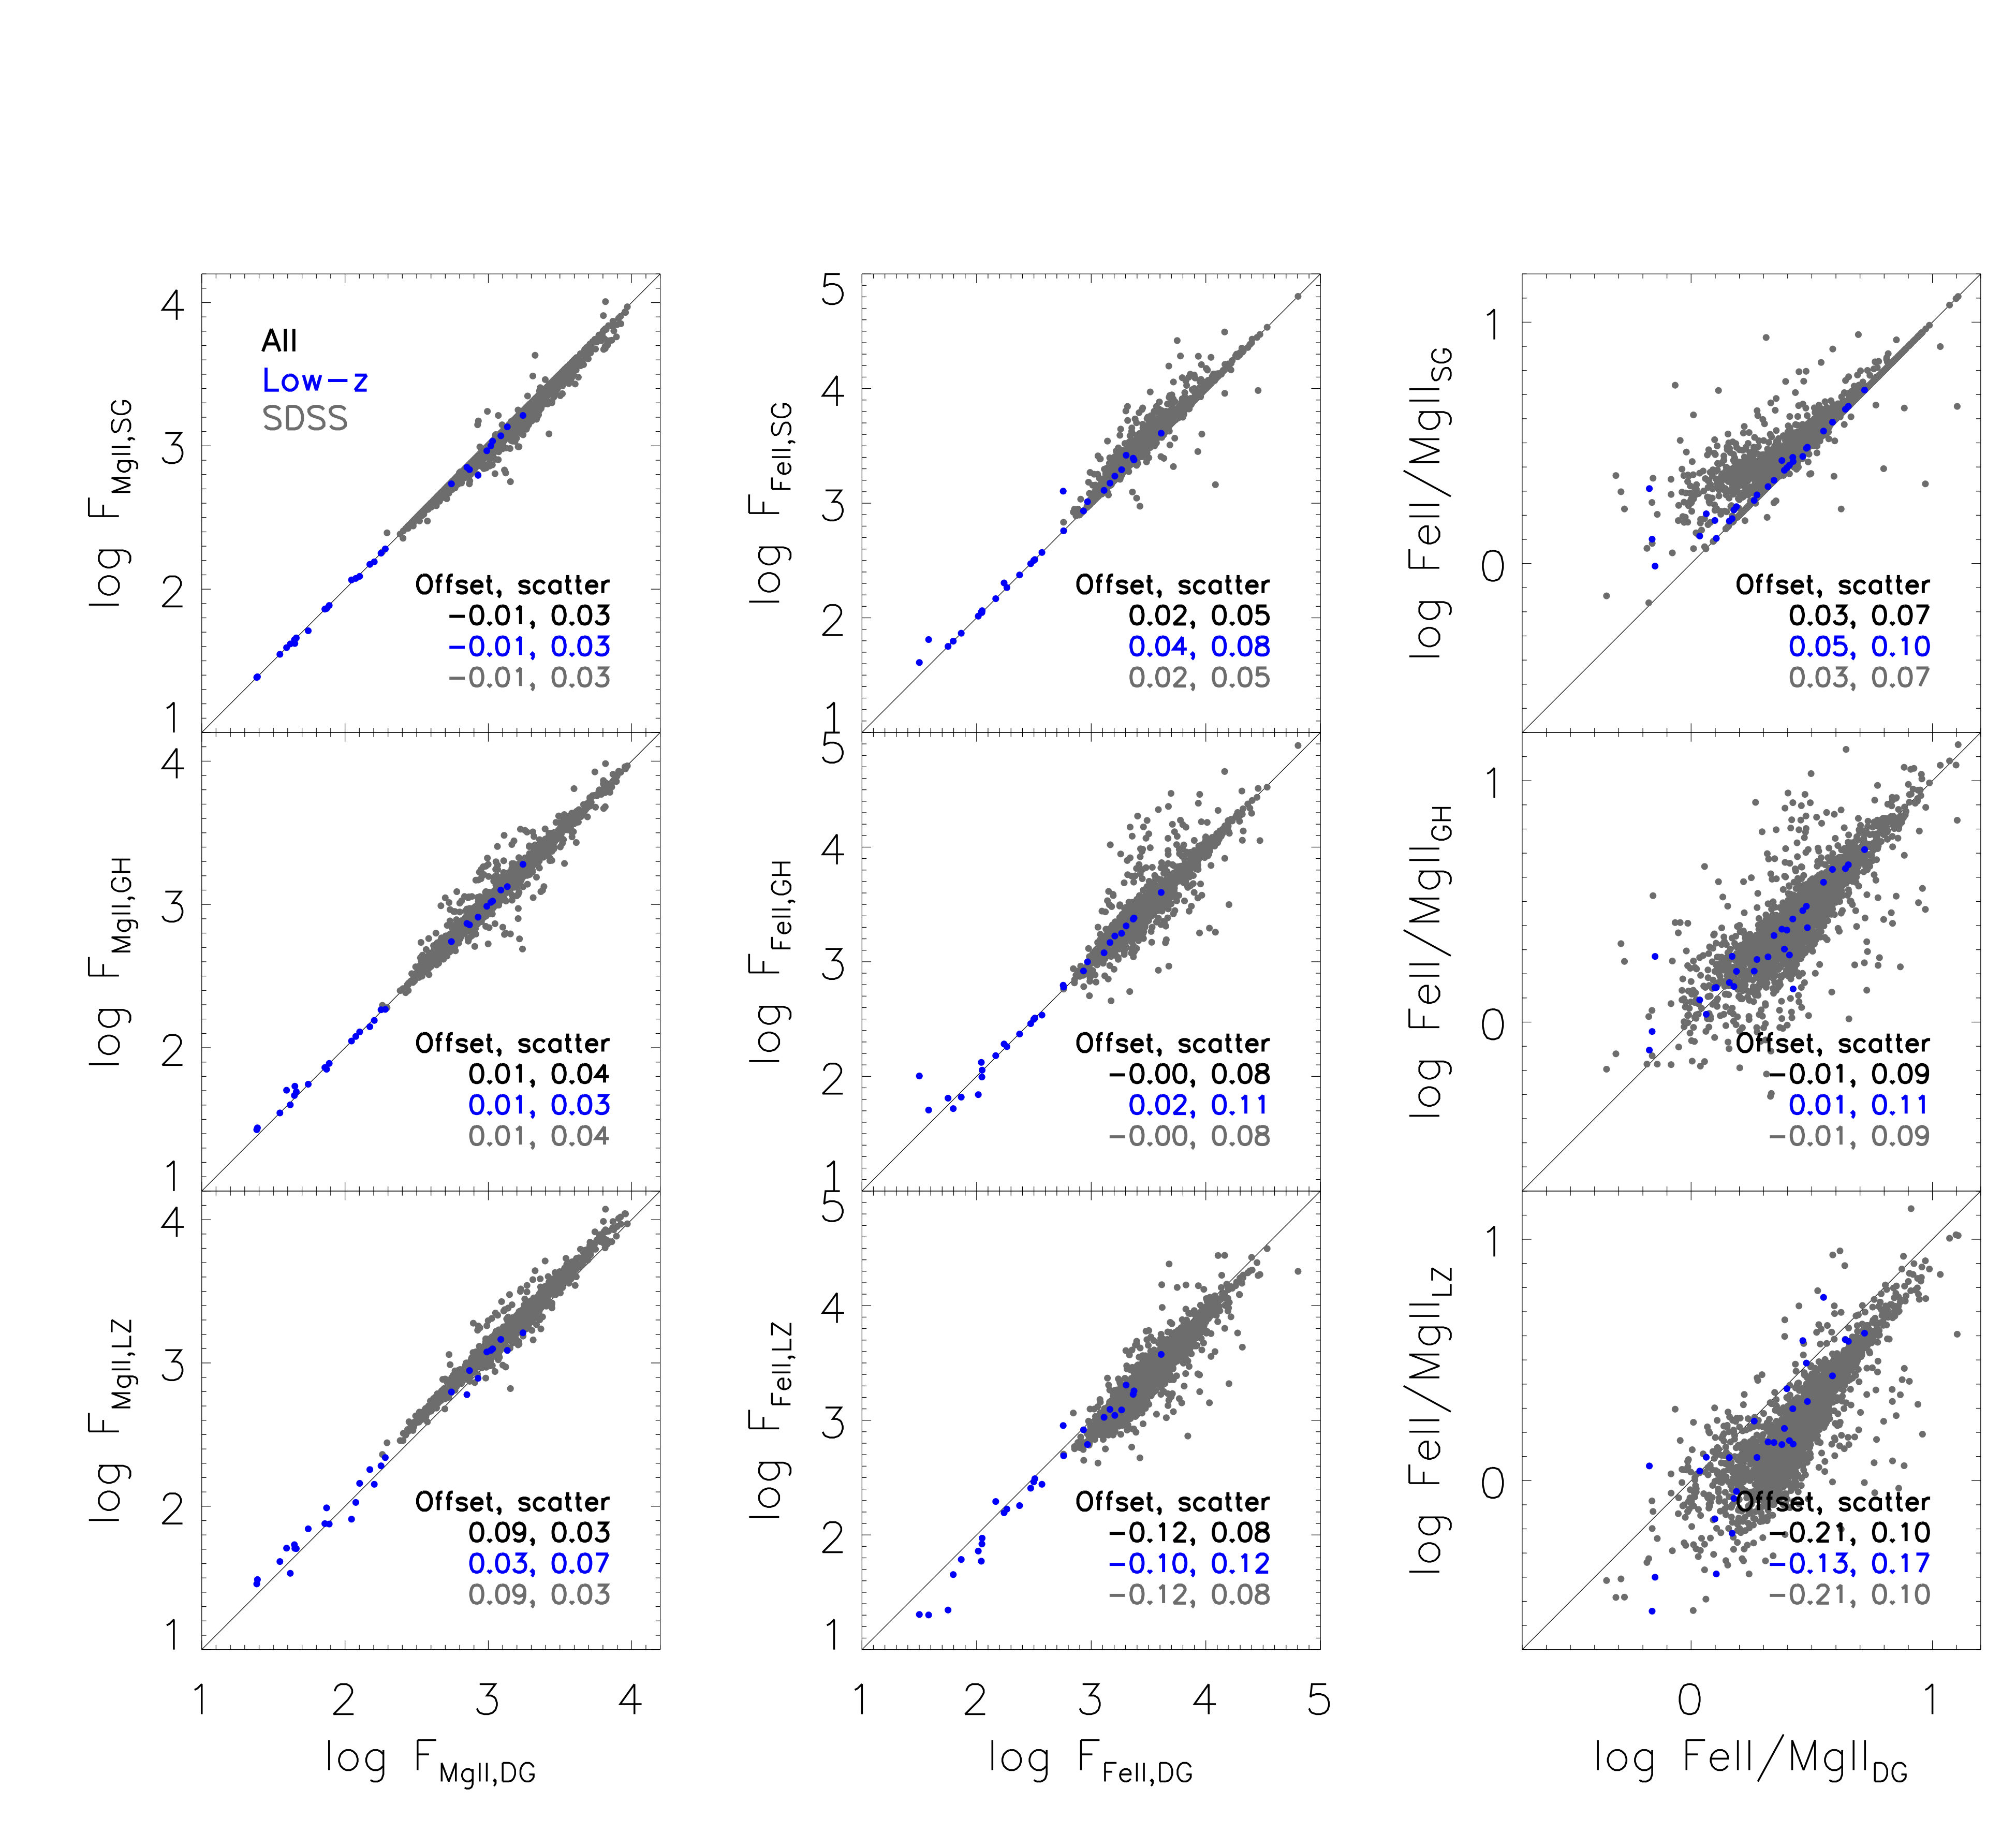
We also estimated the AGN properties (i.e., black hole mass, AGN luminosity, and Eddington ratio) using the velocity dispersion of Mg II and the monochromatic luminosity at 3000Å continuum. We calculated black hole mass using the equation given in Le et al. (2020, see also ) with the coefficients of their scheme 2. Note that the Mg II-based black hole mass measurement has an uncertainty of 0.4-0.7 dex due to various issues (i.e., the virial factor and AGN variability, see e.g., Le et al., 2020, and references therein). The bolometric luminosity was converted from the 3000Å monochromatic luminosity with a bolometric correction factor of 5.15 (Shen et al., 2008). Lastly, we calculated the Eddington ratio by dividing the bolometric luminosity by the Eddington luminosity, which is determined by black hole mass. We also estimated the uncertainties of the line fluxes and AGN properties using Monte-Carlo simulations with 1000 mock spectra created from randomizing flux within 1 error. We list the properties of emission lines and AGN with their uncertainties in Table 2.
We also checked whether the choice of the Mg II line profile affects the estimation of AGN properties. First of all, we found that AGN luminosities from fitting with the four different line profiles are consistent within 0.01 dex. Secondly, we obtained consistent black hole mass from the fitting with the line profiles of single Gaussian, double Gaussian, and 6th order Gauss-Hermite series within 0.1 dex, while they are significantly lower (20 times) than that from the Lorentzian fitting. Due to the consistent AGN luminosities, the difference in black hole mass is mainly from the different velocity dispersion of Mg II, meaning that the Mg II line width measured from fitting with the Lorentz function is higher than that from fitting with other profiles. However, when we consider the full width half maximum of Mg II, we have consistent black hole mass measurements from the fitting with all of the four line profiles. This issue may be due to the different ratios between the FWHM and velocity dispersion of the line profiles. For example, the ratio is 2.35 for single Gaussian but 1 for Lorentzian. The black hole mass estimation method using the velocity dispersion and FWHM of Mg II measured from fitting with the line profiles of double Gaussian and Gauss-Hermite is well calibrated based on the information of H (e.g., Le et al., 2020). Therefore, our test indicate that the velocity dispersion of Mg II from the Lorentzian fitting is not applicable for black hole mass estimation.
As described earlier, double Gaussian and Gauss-Hermite series have been widely adopted to estimate black hole mass. Based on our test, we found that any of them can be adopted because adopting both of them provide consistent measurements. However, by visual inspection, we checked Gauss-Hermite series give unsatisfactory fitting results for a number of AGN, which fitted noise. Therefore, we finally decided to adopt the fitting results based on the double Gaussian profile.
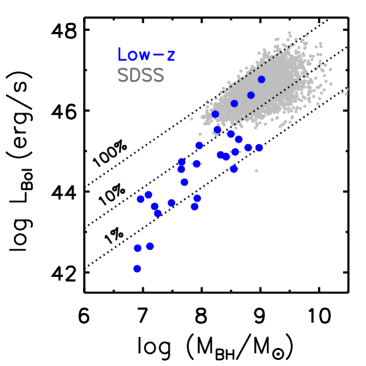
Figure 2 shows the bolometric luminosities of the low redshift AGNs and SDSS quasars as a function of black hole mass. Most of the AGNs in this work show an Eddington ratio ranging from 1% to 100%. As shown in Figure 2, the low redshift AGNs are on average far less massive and luminous (/M⊙ 8.0 and log LBol 44.6) compared with the SDSS quasars (/M⊙ 9.0 and log LBol 46.5). Especially, the low redshift AGN sample uniquely covers the low luminosity range of log LBol=42.1–45.4, which is 101-4 times fainter than the lower bound of the luminosity range of high redshift SDSS quasars and the low black hole mass (log MBH/M⊙= 6.9–8.0) regime. Together with the SDSS quasars, we can investigate the relations between the Fe II/Mg II ratio and AGN properties in the wide dynamic ranges of the AGN properties (i.e., 6 dex in luminosity and 3 dex in black hole mass).
Note that, the distributions of black hole mass and AGN bolometric luminosity of our SDSS quasars are extended by 0.5 dex to a lower mass and
luminosity, compared with those presented in Paper I. This is due to the inclusion of lower redshift SDSS quasars (0.46 ¡ z ¡ 0.75), which
are likely less massive and luminous than higher redshift SDSS quasars.
| Object | log | log | log | ||||
|---|---|---|---|---|---|---|---|
| () | (km s-1) | () | |||||
| (1) | (2) | (3) | (4) | (5) | (6) | (7) | (8) |
| KUG 0003+199 | |||||||
| FIRST J0012-1022 | |||||||
| PGC 87392 | |||||||
| ESO 113-45 | |||||||
| HE 0132-4313 | |||||||
| 3C 48.0 | |||||||
| SDSS J015530.02-085704.0 | |||||||
| AKN 120 | |||||||
| PG 0844+349 | |||||||
| KUG 0921+525 | |||||||
| SDSS J094603.94+013923.6 | |||||||
| NGC 3516 | |||||||
| MCG 10-16-111 | |||||||
| MCG 9-19-073 | |||||||
| CGCG 13-24 | |||||||
| MARK 50 | |||||||
| 3C 273 | |||||||
| RXS J12517+2404 | |||||||
| 3C 277.1 | |||||||
| NGC 5548 | |||||||
| UGC 10120 | |||||||
| SBS 1701+610 | |||||||
| SDSS J171448.50+332738.3 | |||||||
| CGCG 229-15 | |||||||
| NGC 6814 | |||||||
| MARK 509 | |||||||
| B2 2201+31A | |||||||
| MR 2251-178 | |||||||
| NGC 7469 | |||||||
4. Result
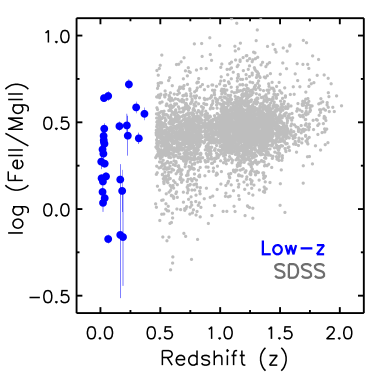
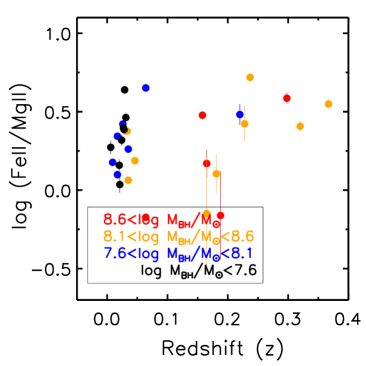
In Figure 3, we present the Fe II/Mg II ratios of the low redshift AGNs and SDSS quasars as a function of redshift. We find that there is no significant difference in Fe II/Mg II ratio between the low redshift AGNs (log Fe II/Mg II = 0.300.24) and SDSS quasars (log Fe II/Mg II = 0.450.15). This may indicate the lack of redshift dependence of Fe II/Mg II, which is consistent with the findings in previous works (e.g., Maiolino et al. 2003; De Rosa et al. 2011; Sameshima et al. 2017; Paper I; Onoue et al. 2020; Sameshima et al. 2020; Schindler et al. 2020).
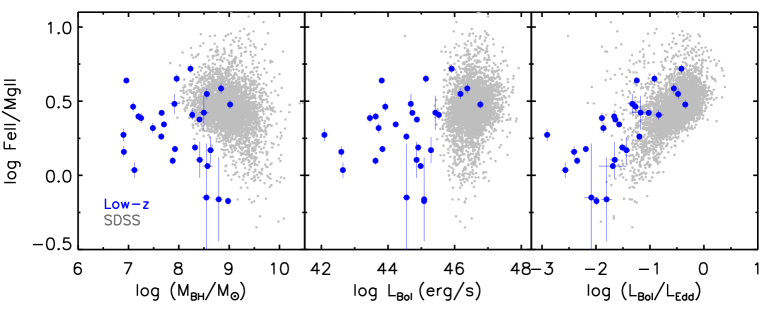
Comparisons of the Fe II/Mg II ratios and AGN properties are presented in Figure 4. We find that the Fe II/Mg II ratio correlates with AGN luminosity and Eddington ratio. Although the strong correlation between the Fe II/Mg II ratio and Eddington ratio has previously been reported (Dong et al. 2011; Sameshima et al. 2017; Paper I), the correlation between the Fe II/Mg II ratio and AGN luminosity has not yet been discovered. Meanwhile, the Fe II/Mg II ratio and black hole mass shows weak (SDSS quasars) or marginal (low-z AGNs) correlations, which is inconsistent with their anti-correlation found for other samples of SDSS quasars (e.g., Dong et al. 2011; Paper I).
For statistical assessment, we perform Spearman’s and Kendall’s correlation tests for both of the low redshift AGNs and
SDSS quasars (Table 3 and 4). As expected in Figure 4, we statistically confirm the strong (weak) correlation of the Fe II/Mg II ratio
with Eddington ratio (AGN luminosity). In addition, the correlation coefficients are found to be larger for
the low redshift AGNs than for the SDSS quasars. In terms of the relation between the Fe II/Mg II and black hole mass,
we find no correlation for the low redshift AGNs, but a weak anti-correlation for the SDSS quasars.
Overall, the statistical tests may indicate that the Fe II/Mg II ratio strongly correlates with Eddington ratio rather than
black hole mass and luminosity. In the appendix, we provide the fitting results of 5 SDSS quasars with low- and high- Eddington ratio,
respectively, to show how their spectra are different depending on Eddington ratio.
We find that the correlations between the Fe II/Mg II ratio and AGN properties shown for the SDSS quasars
are consistent with those in the literature (e.g., Dong et al. 2011; Paper I). Note that the AGN properties presented
in Dong et al. (2011) were calculated based on the line width of H and 5100Å continuum luminosity.
This means that the choice of emission lines between H and Mg II for black
hole mass estimation does not affect the main result.
| (1) | (2) | (3) | (4) |
|---|---|---|---|
| Fe II/Mg II (low-z) | = –0.121 | = 0.342 | = 0.776 |
| = 0.531 | = 0.069 | = 0.000 | |
| Fe II/Mg II (SDSS quasars) | = –0.250 | = 0.192 | = 0.502 |
| = 0.000 | = 0.000 | = 0.000 |
| (1) | (2) | (3) | (4) |
|---|---|---|---|
| Fe II/Mg II (low-z) | = –0.099 | = 0.212 | = 0.557 |
| = 0.453 | = 0.101 | = 0.000 | |
| Fe II/Mg II (SDSS quasars) | = –0.172 | = 0.130 | = 0.361 |
| = 0.000 | = 0.000 | = 0.000 |
5. Discussion
5.1. Lack of redshift dependence of Fe II/Mg II
Extending the redshift range down to 0, we confirm that the Fe II/Mg II ratio is independent of redshift up to z7 (Barth et al., 2003; Maiolino et al., 2003; De Rosa et al., 2011; Mazzucchelli et al., 2017; Shin et al., 2019; Onoue et al., 2020; Sameshima et al., 2020; Schindler et al., 2020). However, in Paper I, we discussed that the absence of cosmic evolution of the Fe II/Mg II ratio may be caused by biased samples in previous works, which investigated very luminous and massive AGNs. The black hole mass range of the SDSS quasars presented in Paper I is 10. With the assumption of a black hole mass–stellar mass ratio of 0.001–0.01 (e.g., Marconi & Hunt, 2003; Peng et al., 2006; Schramm et al., 2008), the corresponding mass of their host galaxies ranges 10. At such high stellar mass regimes, galaxy metallicity evolution is known to be non-significant as a function of redshift (e.g., Erb et al., 2006; Maiolino et al., 2008). For example, for galaxies with a stellar mass of 10, metallicity increases by only 0.2 dex between redshifts 0.4 and 2, which is the range of our SDSS quasars (see Figures 8 and 9 of Maiolino et al. 2008). Therefore, even if the cosmic evolution of the Fe II/Mg II ratio does exists, it may be difficult to detect the evolution due to the large scatter of the Fe II/Mg II ratio.
To better understand this issue, we investigate the low redshift AGNs since their black hole masses are down to
10, corresponding to a mass of their host galaxies of 10
(see Greene et al., 2020, and the references therein). As shown in Figure 3, the low redshift AGNs do not show any clear
redshift evolution of the Fe II/Mg II ratio, whereas the black hole masses of the low redshift AGNs span two
orders of magnitude. Since galaxy metallicity-redshift relations depend on stellar mass (see e.g., Maiolino et al., 2008),
we may need to take into account a black hole mass dependency in the Fe II/Mg II-redshift relation.
To this end, we divide the low redshift AGN sample into four groups on the basis of their black hole masses
and investigate the Fe II/Mg II–redshift relation for each subsample (Figure 5).
However, we find no significant evidence for the redshift evolution of the Fe II/Mg II ratio across all the
black hole mass bins. Although this result potentially confirms the absence of cosmic evolution in the Fe II/Mg II ratio,
it could have been due to the narrow redshift range of the low redshift AGN sample (i.e., z ¡ 0.4) and
the large scatter of Fe II/Mg II. It has been observed that galaxy metallicity increases
by less than 0.2 dex within the redshift range of 0-0.7 (see e.g., Figure 9 of Maiolino et al., 2008).
With this reason, it is possible that the redshift evolution of the Fe II/Mg II ratio of the low redshift AGNs
is concealed by the large scatter (i.e., 0.24 dex), which is similar to that of higher redshift AGNs.
5.2. Primary parameter: Eddington ratio?
In Section 4, we confirm that Fe II/Mg II shows a strong dependency on Eddington ratio using a sample of low redshift AGNs over large dynamic ranges of black hole mass and luminosity, which is consistent with previous works (Dong et al. 2011; Sameshima et al. 2017 and Paper I). However, in contrast to the previous works (Dong et al. 2011 and Paper I), we find that the Fe II/Mg II ratio exhibits different trends in terms of black hole mass and AGN luminosity.
We reveal, for the first time, the weak positive correlation between the Fe II/Mg II ratio and AGN luminosity, which is consistent with previous results for the BLR metallicity indicators (i.e., N V/C IV, Hamann & Ferland, 1993; Nagao et al., 2006; Matsuoka et al., 2011; Shin et al., 2013). It can be postulated that the correlation could have been revealed because of the wider dynamic range (6 dex) of the AGN luminosity than that adopted in the previous works (i.e., 1.5 dex, e.g., Dong et al. 2011; Paper I). If we take into account the large scatter of the Fe II/Mg II ratio (see Figure 4), it may be difficult to observe the correlation within a narrow dynamic range of luminosity. Our interpretation can be supported through the weaker correlation between the Fe II/Mg II ratio and AGN luminosity of the SDSS quasars, the luminosity range of which is 2 dex, compared with that of the low redshift AGNs (see Table 3).
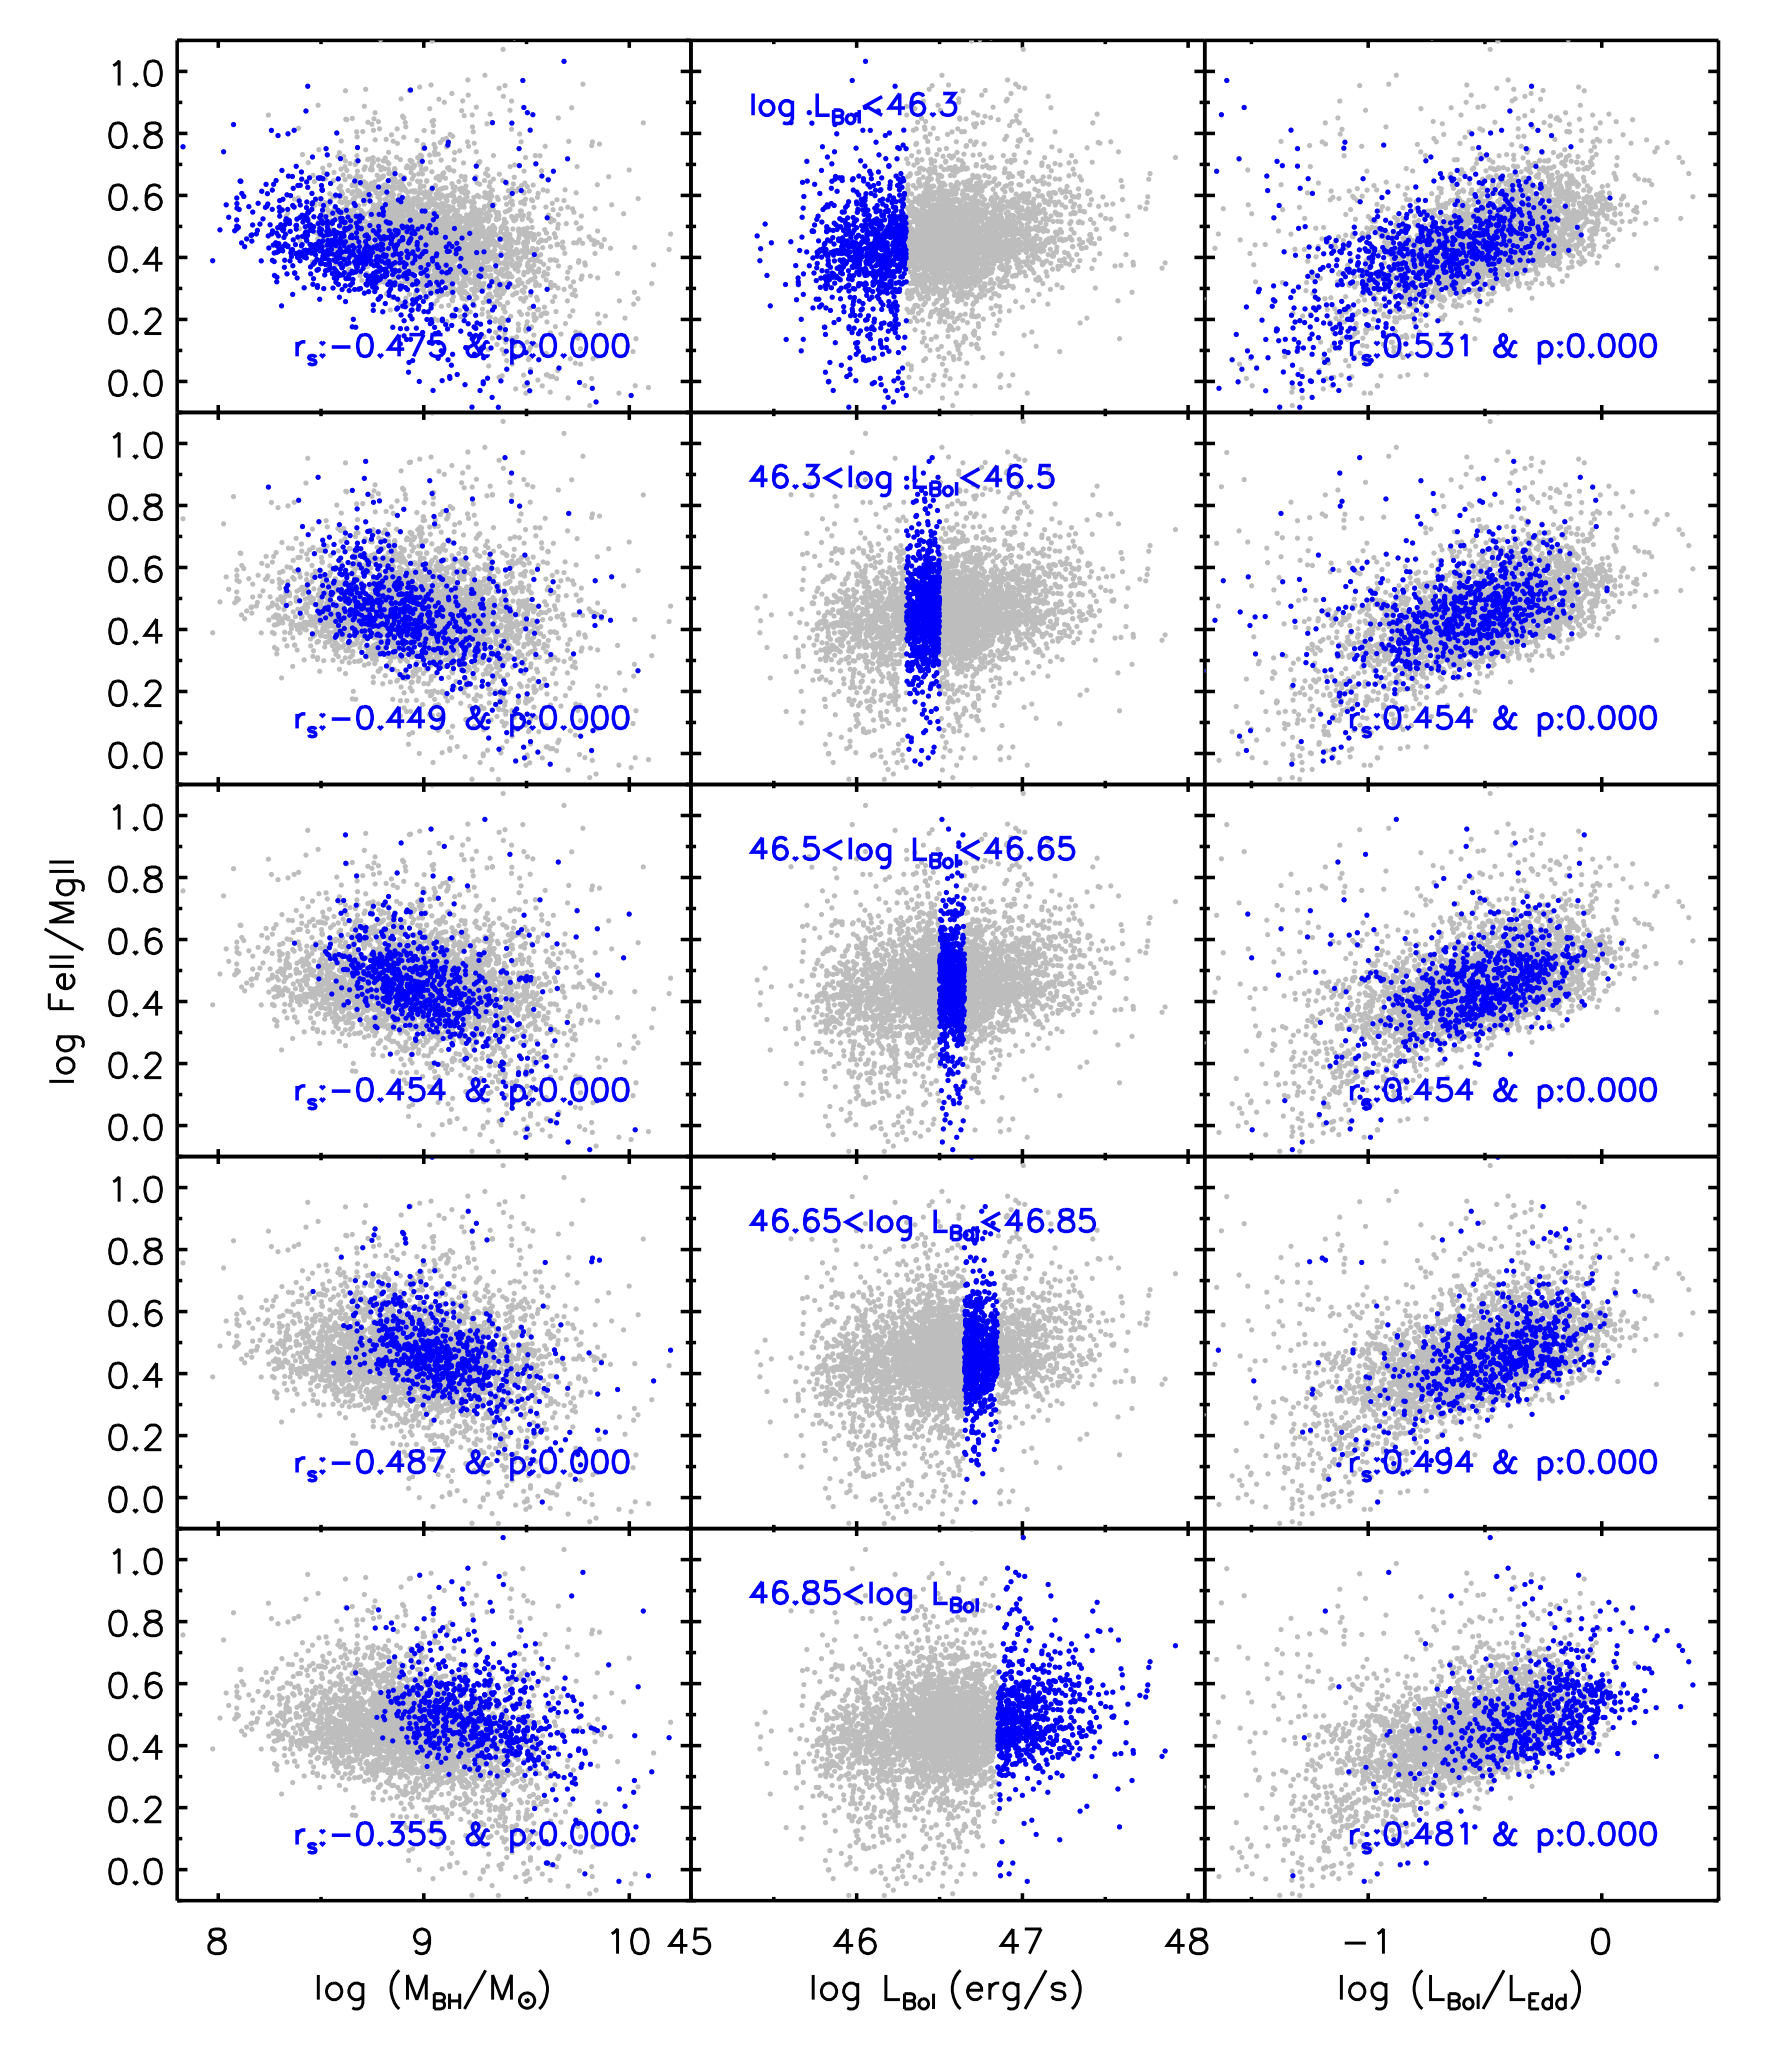
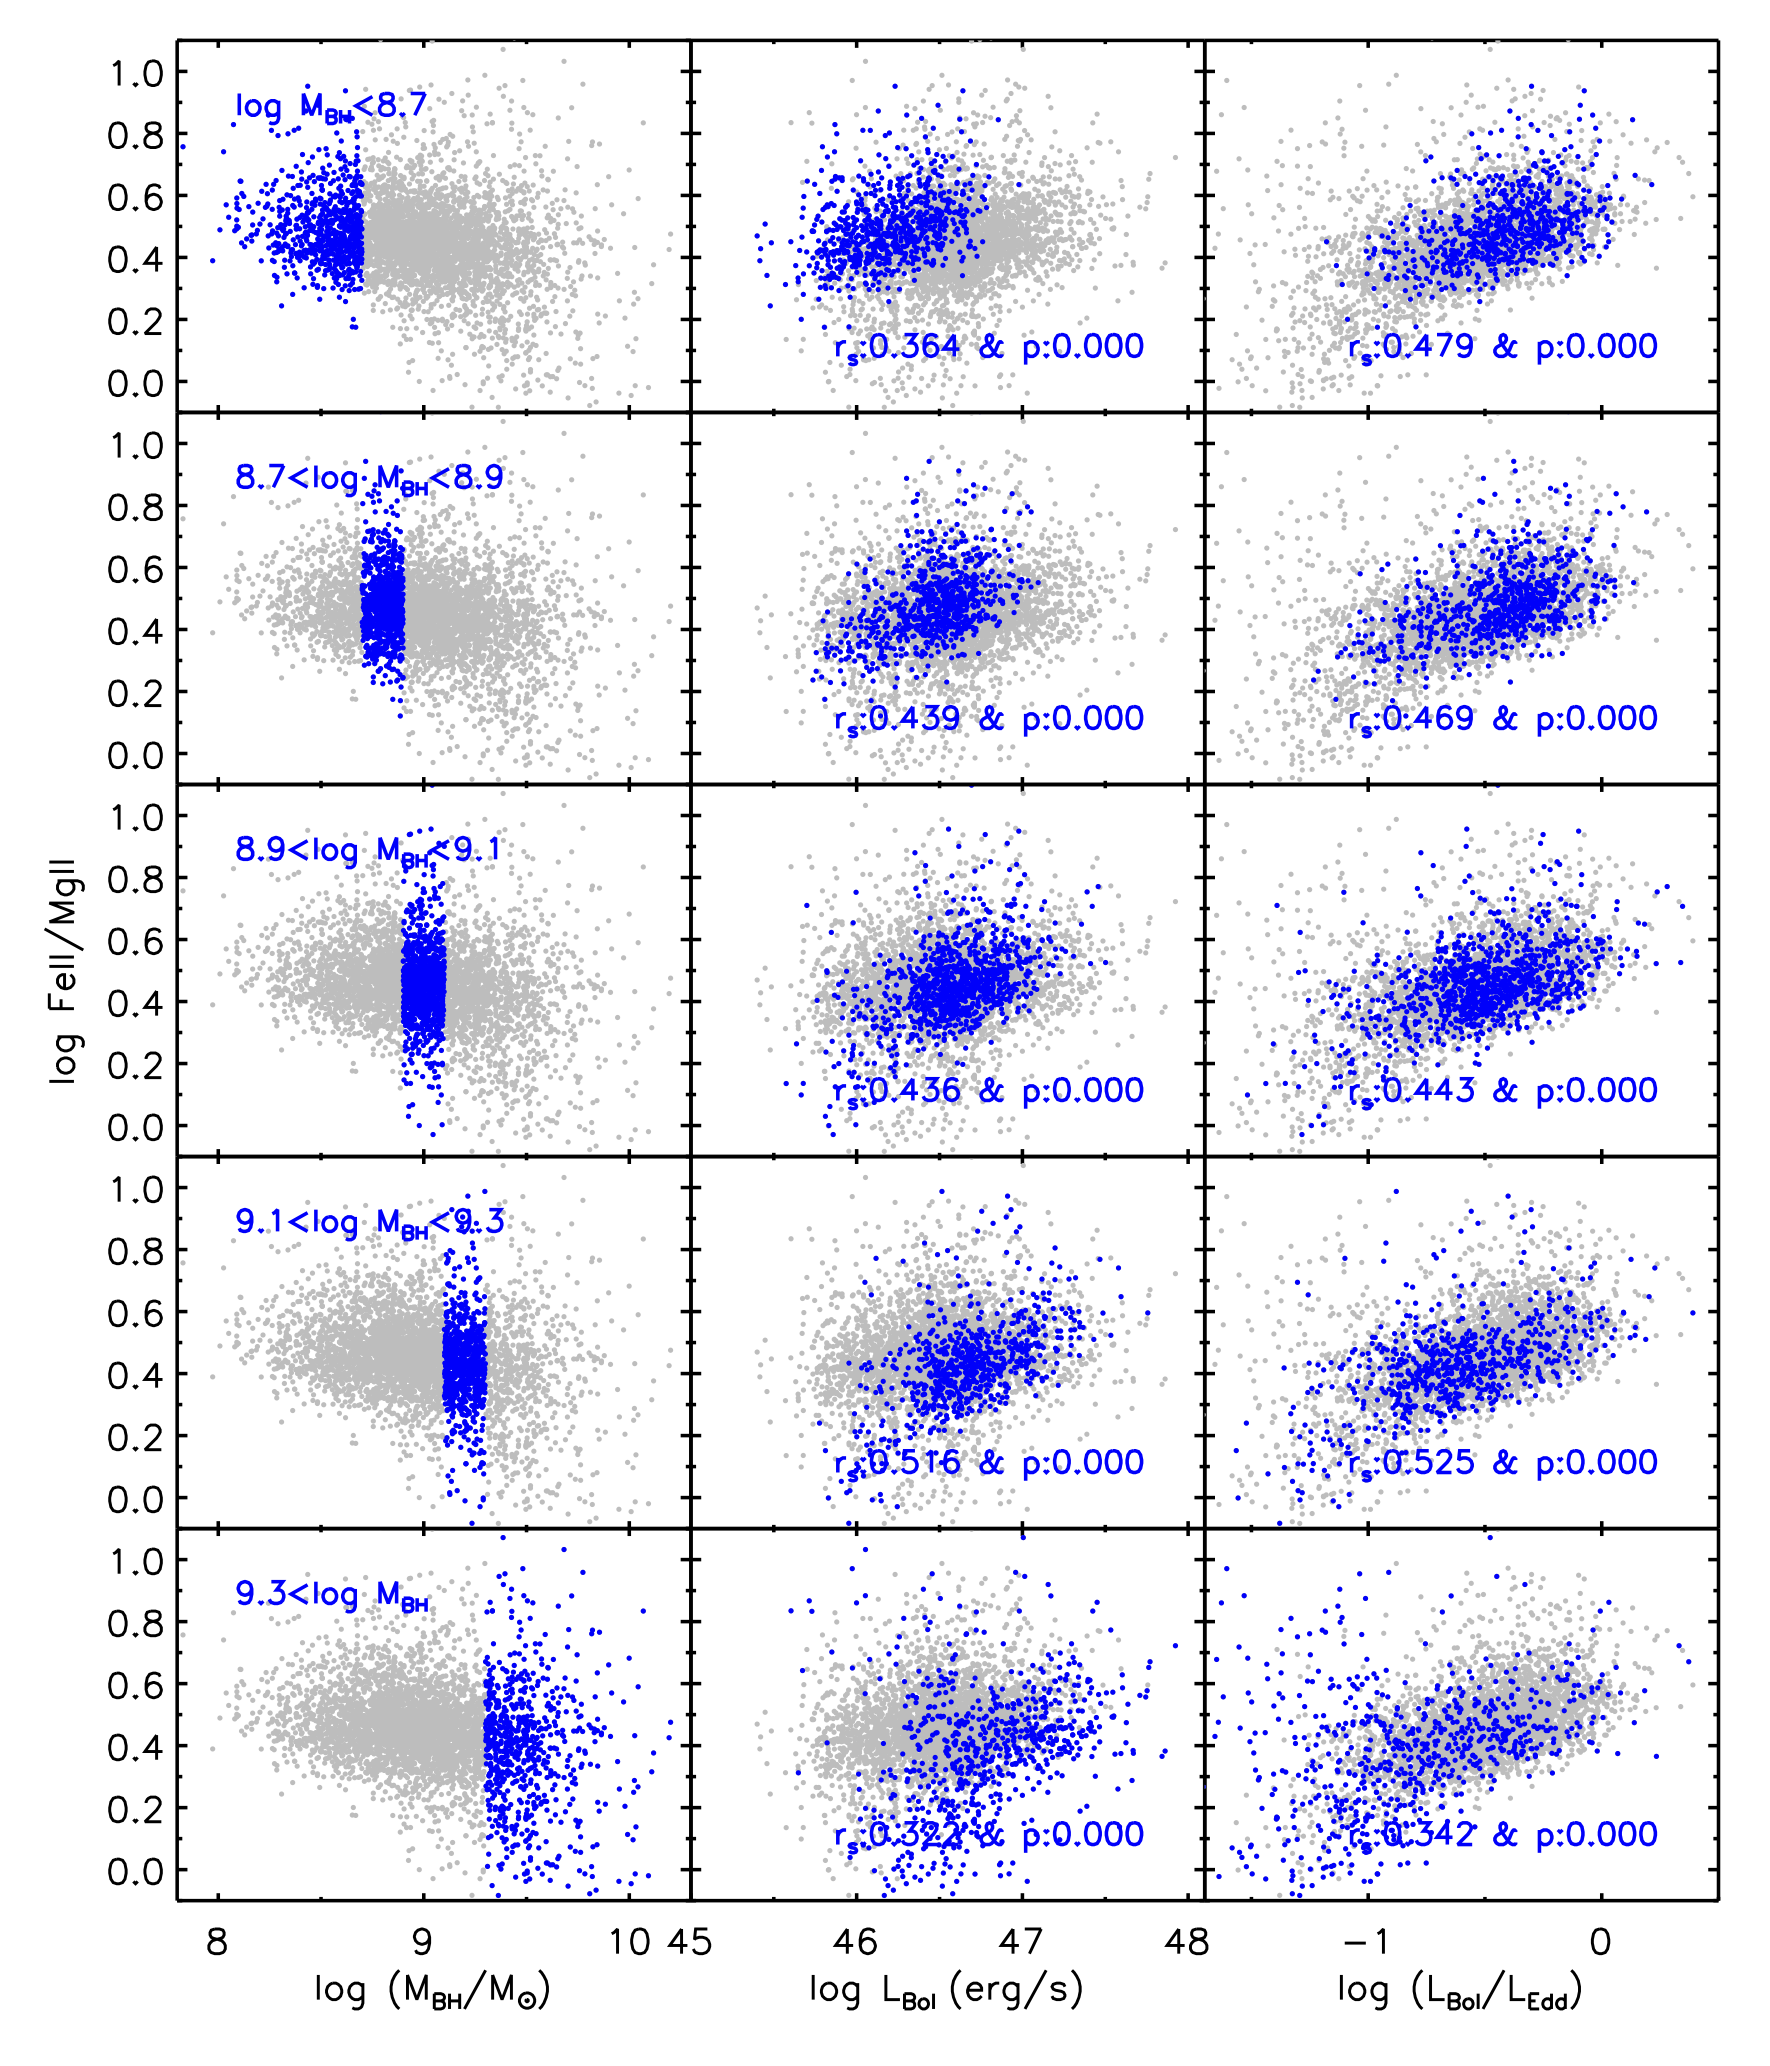
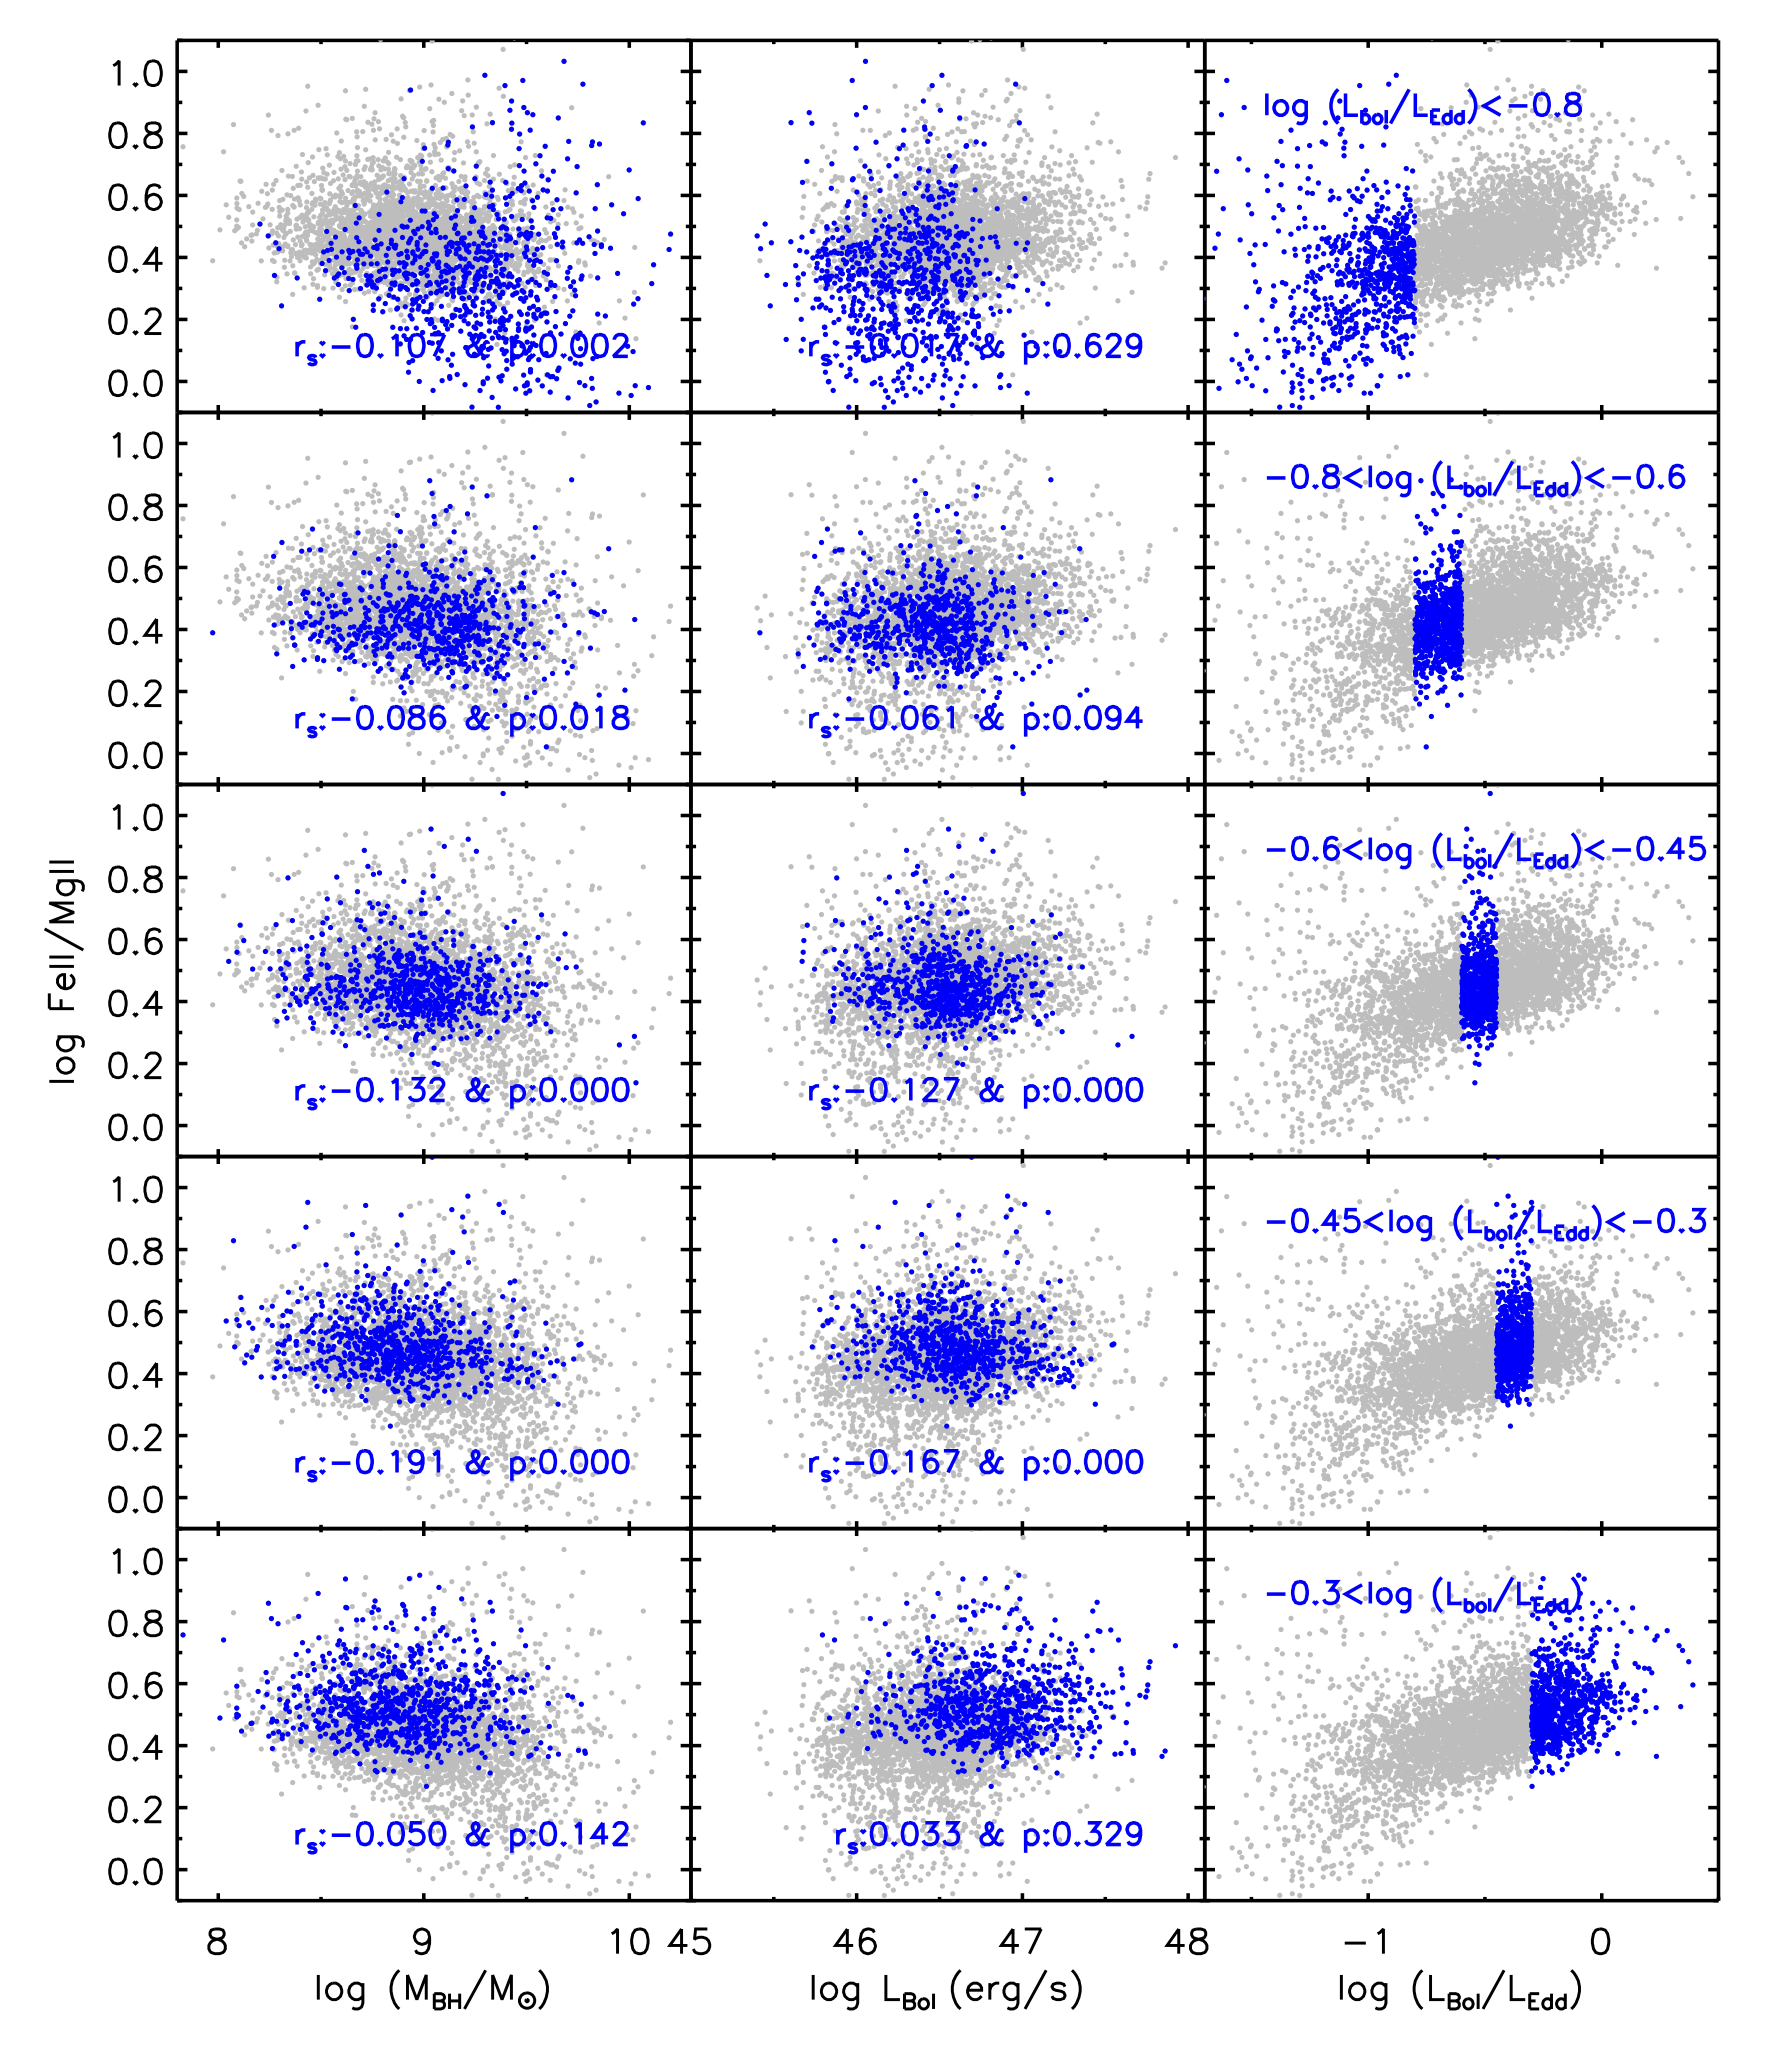
To better understand the relations between the Fe II/Mg II ratio and AGN properties, we divide our 4,061 SDSS quasars into 5 subsamples based on luminosity, mass, and Eddington ratio and investigate the relations. Note that we arbitrarily determine the physical ranges for each subsample to include 800 quasars.
First, as shown in Figure 6, the Fe II/Mg II ratio shows a strong correlation (anti-correlation) with Eddington ratio (black hole mass) within a narrow AGN luminosity range in each luminosity bin. Interestingly, the correlation coefficient between the Fe II/Mg II ratio and black hole mass for each subsamples is much larger than that for the whole sample of SDSS quasars and low redshift AGNs. On the other hand, the correlation coefficient between the Fe II/Mg II ratio and Eddington ratio are similar for the subsamples and whole samples of SDSS quasars. The different behaviors in the relation between the Fe II/Mg II ratio and black hole mass depending on samples may indicate the sample selection effect. At a given luminosity, Eddington ratio and black hole mass are inversely proportional. Therefore, if there is a strong correlation between the Fe II/Mg II ratio and Eddington ratio, it can lead the strong anti-correlation between the Fe II/Mg II ratio and black hole mass for each subsample within a narrow luminosity range.
Second, in each mass bin, there are strong correlations of the Fe II/Mg II ratio with both of AGN luminosity and Eddington ratio (Figure 7). At a given black hole mass, AGN luminosity and Eddington ratio are proportional. Therefore, the strong correlation between the Fe II/Mg II and AGN luminosity in each subsample can be also caused by the strong correlation between the Fe II/Mg II ratio and Eddington ratio.
Third, Figure 8 shows that the Fe II/Mg II ratio is marginally correlated with both of black hole mass and AGN luminosity in each Eddington ratio bin. These results potentially confirm that the Fe II/Mg II ratio–black hole mass and Fe II/Mg II ratio–AGN luminosity relations are subject to sample selection, suggesting that the reported anti-correlation between the Fe II/Mg II ratio and black hole mass may be artificial. Meanwhile, regardless of the sample selection, Eddington ratio shows a strong correlation with the Fe II/Mg II ratio.
In conclusion, the Fe II/Mg II ratio is primarily related to Eddington ratio,
and not black hole mass, which is related to the global properties of galaxies (i.e., galaxy mass).
This trend is consistent with previous results for the BLR metallicity indicators (e.g., Shemmer et al., 2004; Shin et al., 2013) and
other emission line ratios (i.e., Fe II/H, e.g., Netzer & Trakhtenbrot, 2007; Dong et al., 2011),
implying the physical connection between the metal enrichment at the nuclear region of galaxies and the accretion activity of AGNs
(e.g., Dong et al. 2011; Shin et al. 2013, 2017; Paper I).
5.3. Physical meaning of the Fe II/Mg II ratio
Several line ratios (i.e., N V/C IV and Fe II/H) including the Fe II/Mg II ratio, correlate with Eddington ratio. Interestingly, the Fe II/H ratio (Panda et al., 2018, 2019a) and N V/C IV ratio (Hamann & Ferland, 1992, 1993; Nagao et al., 2006) have been suggested to be associated with BLR metallicity. Therefore, the correlation between the Fe II/Mg II ratio and Eddington ratio may suggest that the Fe II/Mg II ratio is also related to BLR metallicity, also supported by theoretical studies (Verner et al., 2003; Sarkar et al., 2021).
A physical connection between the Fe II/Mg II ratio and BLR metallicity can be understood in terms of metal enrichment from star formation. As a proxy of the Fe/Mg abundance ratio, we can track the change of the Fe II/Mg II ratio as a function of time from the onset of star formation based on an enrichment delay (tens of Myr to a few Gyrs, Matteucci & Recchi, 2001) between alpha elements and iron which are produced mainly from Type II and Type Ia supernovae, respectively. If we simply consider a single episode of star formation, the Fe II/Mg II will be constant from the onset of star formation until Type II SNe explode. Once Type II SNe begin to explode (a few tens of Myrs from the onset of star formation), the Fe II/Mg II will decrease due to the enrichment of alpha elements during other few tens of Myrs until all of Type II SNe explode. After then, iron will be enriched by Type Ia SNe; hence the Fe II/Mg II ratio will increase as a function of time for a few Gyrs. Therefore, except for a short time period (a few tens of Myr), it can be expected that the Fe II/Mg II ratio increases as a function of time.
On the other hand, metallicity increases as a function of time from the onset of star formation due to the enrichment of metals from stellar evolution. In this sense, the possible connection between the Fe II/Mg II ratio and BLR metallicity can be considered. We note that there were reports that the Fe II/Mg II ratio is not only determined by the Fe/ abundance ratio but also other physical parameters of BLR cloud (i.e., gas density and microturbulence Verner et al., 2003; Sameshima et al., 2017). With this reason, the Fe II/Mg II may not be a direct indicator of metallicity, while it can still be an indirect indicator of metallicity as we discussed.
In conclusion, the correlation between several line flux ratios tracing the chemical properties of the BLR and
Eddington ratio can be considered as the relation between the BLR metallicity and accretion activity of AGN.
In the next section, we further discuss the origin for the relation between the BLR metallicity and Eddington ratio.
5.4. Physical implication of the relation between the BLR metallicity and Eddington ratio
For the last few decades, the connection between the BLR metallicity and Eddington ratio has long been discussed, while it has not been fully understood. From a number of optical studies on AGN (e.g., Boroson & Green, 1992; Sulentic et al., 2000a, b; Marziani et al., 2001; Boroson, 2002; Shen & Ho, 2014), the Fe II/H ratio and Eddington ratio are known to be related to the AGN Eigenvector 1. It means that the BLR metallicity and Eddington ratio can play important roles in AGN physics since the Fe II/H ratio is associated with the BLR metallicity. Understanding physical connection between the BLR metallicity and Eddington ratio can therefore shed light on the AGN physics.
In previous works, nuclear starburst has been discussed as the origin for the relation because it can enrich BLR metallicity as well as increase accretion rate of AGNs (Shemmer et al., 2004; Netzer & Trakhtenbrot, 2007; Shin et al., 2013, 2017; Panda et al., 2019b). Indeed, the connection between nuclear starburst and the accretion activity of AGNs has been discussed (e.g., Imanishi & Wada, 2004; Woo et al., 2012; Esquej et al., 2014) with a delay time of 50–100 Myr between the two activities (Davies et al., 2007). However, no strong correlation was found between the nuclear star formation rate and Eddington ratio (Davies et al., 2007; Woo et al., 2012). For example, in Davies et al. (2007), Circinus galaxy, NGC 3783, and IRAS 05189-2524 show similar nuclear star formation rates (30-70 M⊙/yr) and starburst ages (i.e., 60–80 Myr), while their Eddington ratios are quiet different by factors of up to 50. This result suggests that star formation rate and the accretion rate of AGNs may be not directly related, meaning that the nuclear starburst may not be the origin for the correlation between the chemical properties in the BLR and Eddington ratio. We note that, however, it is also possible that the no clear relation between the nuclear star formation rate and Eddington ratio is due to AGN variability (e.g., Hickox et al., 2014).
Alternatively, we can discuss metal cooling as a possible mechanism to explain the connection between
the chemical properties in the BLR and Eddington ratio.
Since the efficiency of radiative cooling is a function of metallicity (e.g., Sutherland & Dopita, 1993; Wang et al., 2014),
more efficient radiative cooling due to higher BLR metallicity (and also the Fe/ abundance ratio,
see e.g., Hamann & Ferland 1993) can cause stronger gas inflows (i.e., higher gas density) in the BLR
as well as higher accretion rate of AGNs.
This scenario is supported by a simulation based study (Mayer et al., 2015), finding
that the metal cooling enhances the gas inflows into the central pc scale region of galaxies.
We note that, based on CLOUDY photoionization modeling (Ferland et al., 2017), Sameshima et al. (2017)
discussed an anti-correlation between hydrogen gas density of BLR clouds and Eddington ratio,
which is opposite to our scenario. However, their modeled emission line strengths of Fe II and Mg II are found to be
largely inconsistent (1 dex) with the observed line strengths (see Figures 4 and 9 of Sameshima et al. 2017),
which indicates that their result may not be reliable. The inconsistency can be because their adopted atomic 371-level
Fe+ model (Verner et al., 1999) may be not accurate (see e.g., Verner et al., 2003; Smyth et al., 2019; Sarkar et al., 2021)
and/or their parameter space may not reflect the nature of the BLR. Therefore, to confirm the relation between gas
density and Eddington ratio, further investigations are required.
6. Summary
In this work, we investigate the relations between the Fe II/Mg II ratio and AGN properties of type 1 AGNs at z ¡ 2
in a large dynamic range of AGN properties. The main results are summarized below.
The Fe II/Mg II ratios of the low redshift AGNs (z ¡ 0.4) show no clear dependence on redshift, which is consistent with
previous results for higher redshift AGNs (up to z7), suggesting no cosmic evolution of the Fe II/Mg II ratios.
In contrast to previous works, we reveal a weak positive correlation between
the Fe II/Mg II ratio and AGN luminosity over a wide dynamic range of AGN luminosity ( 6 dex).
This result is consistent with the previous studies of BLR metallicity indicators (i.e., N V/C IV).
We find a marginal correlation between the Fe II/Mg II ratio and black hole mass, which
is inconsistent with the anti-correlation found for SDSS quasars in the literature.
Based on a test using various subsamples of SDSS quasars, we interpret that the
previous finding of the anti-correlation was caused by the narrow luminosity range and
there may be no physical relation between the Fe II/Mg II ratio and black hole mass.
Consistent with previous results, we find a strong correlation between the Fe II/Mg II ratio
and Eddington ratio. With regard to this, we discuss metal cooling, which can enhance gas inflows
as well as high accretion rate of AGNs.
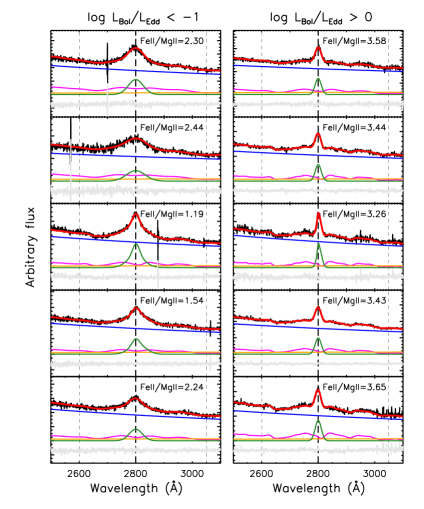
In Figure A1, we provide fitting results of five randomly selected SDSS quasars with low (log LBol/LEdd¡-1) and high Eddington ratio (log LBol/LEdd¿0), respectively (Figure A1). As expected from Figure 4, the high Eddington ratio quasars show larger Fe II/Mg II ratios than the low Eddington ratio quasars. We find one difference between the two groups that low Eddington ratio AGNs show much broader Mg II line than high Eddington ratio AGNs. This trend can be expected from i) a strong anti-correlation between the line width of H and Eddington ratio Netzer & Trakhtenbrot (2007); Xu et al. (2012) and ii) a linear relationship between the linewidths of H and Mg II (e.g., McGill et al., 2008; Woo et al., 2018; Le et al., 2020). This trend also can be analytically explained. Based on the single epoch method, black hole mass is proportional to L. Since Eddington ratio is determined by the ratio between bolometric luminosity and black hole mass, it is proportional to L, which means a strong inverse dependency of Eddington ratio on the line width of H or Mg II.
References
- Bahk et al. (2019) Bahk, H., Woo, J.-H., & Park, D. 2019, ApJ, 875, 50
- Barth et al. (2003) Barth, A. J., Martini, P., Nelson, C. H., & Ho, L. C. 2003, ApJ, 594, L95
- Bon et al. (2020) Bon, N., Marziani, P., Bon, E., et al. 2020, A&A, 635, A151
- Boroson (2002) Boroson, T. A. 2002, ApJ, 565, 78
- Boroson & Green (1992) Boroson, T. A., & Green, R. F. 1992, ApJS, 80, 109
- Davies et al. (2007) Davies, R. I., Müller Sánchez, F., Genzel, R., et al. 2007, ApJ, 671, 1388
- De Rosa et al. (2011) De Rosa, G., Decarli, R., Walter, F., et al. 2011, ApJ, 739, 56
- Dietrich et al. (2003) Dietrich, M., Hamann, F., Appenzeller, I., & Vestergaard, M. 2003, ApJ, 596, 817
- Dong et al. (2011) Dong, X.-B., Wang, J.-G., Ho, L. C., et al. 2011, ApJ, 736, 86
- Erb et al. (2006) Erb, D. K., Shapley, A. E., Pettini, M., et al. 2006, ApJ, 644, 813
- Esquej et al. (2014) Esquej, P., Alonso-Herrero, A., González-Martín, O., et al. 2014, ApJ, 780, 86
- Ferland et al. (2017) Ferland, G. J., Chatzikos, M., Guzmán, F., et al. 2017, Rev. Mexicana Astron. Astrofis., 53, 385
- Ferrarese & Merritt (2000) Ferrarese, L., & Merritt, D. 2000, ApJ, 539, L9
- Flesch (2015) Flesch, E. W. 2015, PASA, 32, 10
- Gebhardt et al. (2000) Gebhardt, K., Bender, R., Bower, G., et al. 2000, ApJ, 539, L13
- Greene et al. (2020) Greene, J. E., Strader, J., & Ho, L. C. 2020, ARA&A, 58, 257
- Hamann & Ferland (1992) Hamann, F., & Ferland, G. 1992, ApJ, 391, L53
- Hamann & Ferland (1993) —. 1993, ApJ, 418, 11
- Häring & Rix (2004) Häring, N., & Rix, H.-W. 2004, ApJ, 604, L89
- Hasinger et al. (2005) Hasinger, G., Miyaji, T., & Schmidt, M. 2005, A&A, 441, 417
- Hickox et al. (2014) Hickox, R. C., Mullaney, J. R., Alexander, D. M., et al. 2014, ApJ, 782, 9
- Ikeda et al. (2011) Ikeda, H., Nagao, T., Matsuoka, K., et al. 2011, ApJ, 728, L25
- Imanishi & Wada (2004) Imanishi, M., & Wada, K. 2004, ApJ, 617, 214
- Juarez et al. (2009) Juarez, Y., Maiolino, R., Mujica, R., et al. 2009, A&A, 494, L25
- Kormendy & Ho (2013) Kormendy, J., & Ho, L. C. 2013, ARA&A, 51, 511
- Kovačević-Dojčinović & Popović (2015) Kovačević-Dojčinović, J., & Popović, L. Č. 2015, ApJS, 221, 35
- Le & Woo (2019) Le, H. A. N., & Woo, J.-H. 2019, ApJ, 887, 236
- Le et al. (2020) Le, H. A. N., Woo, J.-H., & Xue, Y. 2020, ApJ, 901, 35
- Leitherer et al. (2011) Leitherer, C., Tremonti, C. A., Heckman, T. M., & Calzetti, D. 2011, AJ, 141, 37
- Magorrian et al. (1998) Magorrian, J., Tremaine, S., Richstone, D., et al. 1998, AJ, 115, 2285
- Maiolino et al. (2003) Maiolino, R., Juarez, Y., Mujica, R., Nagar, N. M., & Oliva, E. 2003, ApJ, 596, L155
- Maiolino & Mannucci (2019) Maiolino, R., & Mannucci, F. 2019, A&A Rev., 27, 3
- Maiolino et al. (2008) Maiolino, R., Nagao, T., Grazian, A., et al. 2008, A&A, 488, 463
- Mannucci et al. (2009) Mannucci, F., Cresci, G., Maiolino, R., et al. 2009, MNRAS, 398, 1915
- Marconi & Hunt (2003) Marconi, A., & Hunt, L. K. 2003, ApJ, 589, L21
- Marziani et al. (2013) Marziani, P., Sulentic, J. W., Plauchu-Frayn, I., & del Olmo, A. 2013, A&A, 555, A89
- Marziani et al. (2001) Marziani, P., Sulentic, J. W., Zwitter, T., Dultzin-Hacyan, D., & Calvani, M. 2001, ApJ, 558, 553
- Matsuoka et al. (2011) Matsuoka, K., Nagao, T., Marconi, A., Maiolino, R., & Taniguchi, Y. 2011, A&A, 527, A100
- Matteucci & Recchi (2001) Matteucci, F., & Recchi, S. 2001, ApJ, 558, 351
- Mayer et al. (2015) Mayer, L., Fiacconi, D., Bonoli, S., et al. 2015, ApJ, 810, 51
- Mazzucchelli et al. (2017) Mazzucchelli, C., Bañados, E., Venemans, B. P., et al. 2017, ApJ, 849, 91
- McGill et al. (2008) McGill, K. L., Woo, J.-H., Treu, T., & Malkan, M. A. 2008, ApJ, 673, 703
- McLure & Dunlop (2004) McLure, R. J., & Dunlop, J. S. 2004, MNRAS, 352, 1390
- Nagao et al. (2012) Nagao, T., Maiolino, R., De Breuck, C., et al. 2012, A&A, 542, L34
- Nagao et al. (2006) Nagao, T., Marconi, A., & Maiolino, R. 2006, A&A, 447, 157
- Netzer & Trakhtenbrot (2007) Netzer, H., & Trakhtenbrot, B. 2007, ApJ, 654, 754
- Onodera et al. (2016) Onodera, M., Carollo, C. M., Lilly, S., et al. 2016, ApJ, 822, 42
- Onoue et al. (2020) Onoue, M., Bañados, E., Mazzucchelli, C., et al. 2020, ApJ, 898, 105
- Panda et al. (2018) Panda, S., Czerny, B., Adhikari, T. P., et al. 2018, ApJ, 866, 115
- Panda et al. (2019a) Panda, S., Czerny, B., Done, C., & Kubota, A. 2019a, ApJ, 875, 133
- Panda et al. (2019b) Panda, S., Marziani, P., & Czerny, B. 2019b, ApJ, 882, 79
- Park et al. (2015) Park, D., Woo, J.-H., Bennert, V. N., et al. 2015, ApJ, 799, 164
- Park et al. (2012) Park, D., Woo, J.-H., Treu, T., et al. 2012, ApJ, 747, 30
- Peng et al. (2006) Peng, C. Y., Impey, C. D., Rix, H.-W., et al. 2006, ApJ, 649, 616
- Popović et al. (2019) Popović, L. Č., Kovačević-Dojčinović, J., & Marčeta-Mandić, S. 2019, MNRAS, 484, 3180
- Sameshima et al. (2017) Sameshima, H., Yoshii, Y., & Kawara, K. 2017, ApJ, 834, 203
- Sameshima et al. (2020) Sameshima, H., Yoshii, Y., Matsunaga, N., et al. 2020, ApJ, 904, 162
- Sarkar et al. (2021) Sarkar, A., Ferland, G. J., Chatzikos, M., et al. 2021, ApJ, 907, 12
- Savage et al. (2000) Savage, B. D., Wakker, B., Jannuzi, B. T., et al. 2000, ApJS, 129, 563
- Schindler et al. (2020) Schindler, J.-T., Farina, E. P., Bañados, E., et al. 2020, ApJ, 905, 51
- Schramm et al. (2008) Schramm, M., Wisotzki, L., & Jahnke, K. 2008, A&A, 478, 311
- Shapley et al. (2017) Shapley, A. E., Sanders, R. L., Reddy, N. A., et al. 2017, ArXiv e-prints
- Shemmer et al. (2004) Shemmer, O., Netzer, H., Maiolino, R., et al. 2004, ApJ, 614, 547
- Shen et al. (2008) Shen, Y., Greene, J. E., Strauss, M. A., Richards, G. T., & Schneider, D. P. 2008, ApJ, 680, 169
- Shen & Ho (2014) Shen, Y., & Ho, L. C. 2014, Nature, 513, 210
- Shen et al. (2011) Shen, Y., Richards, G. T., Strauss, M. A., et al. 2011, ApJS, 194, 45
- Shin et al. (2017) Shin, J., Nagao, T., & Woo, J.-H. 2017, ApJ, 835, 24
- Shin et al. (2019) Shin, J., Nagao, T., Woo, J.-H., & Le, H. A. N. 2019, ApJ, 874, 22
- Shin et al. (2013) Shin, J., Woo, J.-H., Nagao, T., & Kim, S. C. 2013, ApJ, 763, 58
- Smyth et al. (2019) Smyth, R. T., Ramsbottom, C. A., Keenan, F. P., Ferland , G. J., & Ballance, C. P. 2019, MNRAS, 483, 654
- Sulentic et al. (2000a) Sulentic, J. W., Marziani, P., & Dultzin-Hacyan, D. 2000a, ARA&A, 38, 521
- Sulentic et al. (2000b) Sulentic, J. W., Zwitter, T., Marziani, P., & Dultzin-Hacyan, D. 2000b, ApJ, 536, L5
- Sutherland & Dopita (1993) Sutherland, R. S., & Dopita, M. A. 1993, ApJS, 88, 253
- Tadaki et al. (2019) Tadaki, K.-i., Iono, D., Hatsukade, B., et al. 2019, ApJ, 876, 1
- Troncoso et al. (2014) Troncoso, P., Maiolino, R., Sommariva, V., et al. 2014, A&A, 563, A58
- Tsuzuki et al. (2006) Tsuzuki, Y., Kawara, K., Yoshii, Y., et al. 2006, ApJ, 650, 57
- Ueda et al. (2014) Ueda, Y., Akiyama, M., Hasinger, G., Miyaji, T., & Watson, M. G. 2014, ApJ, 786, 104
- Verner et al. (2003) Verner, E., Bruhweiler, F., Verner, D., Johansson, S., & Gull, T. 2003, ApJ, 592, L59
- Verner et al. (1999) Verner, E. M., Verner, D. A., Korista, K. T., et al. 1999, ApJS, 120, 101
- Vestergaard & Wilkes (2001) Vestergaard, M., & Wilkes, B. J. 2001, ApJS, 134, 1
- Wang et al. (2014) Wang, Y., Ferland, G. J., Lykins, M. L., et al. 2014, MNRAS, 440, 3100
- Warner et al. (2004) Warner, C., Hamann, F., & Dietrich, M. 2004, ApJ, 608, 136
- Woo et al. (2012) Woo, J.-H., Kim, J. H., Imanishi, M., & Park, D. 2012, AJ, 143, 49
- Woo et al. (2018) Woo, J.-H., Le, H. A. N., Karouzos, M., et al. 2018, ApJ, 859, 138
- Woo et al. (2013) Woo, J.-H., Schulze, A., Park, D., et al. 2013, ApJ, 772, 49
- Woo et al. (2015) Woo, J.-H., Yoon, Y., Park, S., Park, D., & Kim, S. C. 2015, ApJ, 801, 38
- Xu et al. (2012) Xu, D., Komossa, S., Zhou, H., et al. 2012, AJ, 143, 83
- Yabe et al. (2012) Yabe, K., Ohta, K., Iwamuro, F., et al. 2012, PASJ, 64, 60