ALMA discovery of a dual dense probably rotating outflow from a massive young stellar object G18.88MME
Abstract
We report the discovery of a very dense jet-like fast molecular outflow surrounded by a wide-angle wind in a massive young stellar object (MYSO) G18.88MME (stellar mass 8 M⊙) powering an Extended Green Object G18.890.47. Four cores MM1–4 are identified in the Atacama Large Millimeter/submillimeter Array (ALMA) 1.3 mm continuum map (resolution 0.′′8) toward G18.88MME, and are seen at the center of the emission structure (extent 0.3 pc 0.2 pc) detected in the ALMA map. G18.88MME is embedded in the core MM1 (mass 13–18 M⊙), where no radio continuum emission is detected. The molecular outflow centered at MM1 is investigated in the SiO(5–4), HC3N(24–23) and 13CO(2–1) lines. The detection of HC3N in the outflow is rare in MYSOs and indicates its very high density. The position-velocity diagrams display a fast narrow outflow (extent 28000 AU) and a slower wide-angle more extended outflow toward MM1, and both of these components show a transverse velocity gradient indicative of a possible rotation. All these observed features together make G18.88MME as a unique object for studying the unification of the jet-driven and wind-driven scenarios of molecular outflows in MYSOs.
keywords:
ISM: jets and outflows – HII regions – ISM: clouds – ISM: individual object (SDC18.888-0.476) – stars: formation – stars: pre–main sequence1 Introduction
Our understanding of the physical processes involved in the formation of massive stars ( 8 M⊙) is still incomplete (e.g., Zinnecker & Yorke, 2007; Motte et al., 2018; Rosen et al., 2020). Most recent high-resolution studies of massive young stellar objects (MYSOs) suggest that massive stars form via infall from a surrounding envelope and disk-mediated accretion similar to their low-mass counterparts (see Rosen et al., 2020). In this relation, understanding accretion and jets/outflows in MYSOs is crucial for constraining the physics related to their birth and early evolution. The simultaneous detection of a highly collimated jet and a wide-angle outflow in low-mass stars has been known (e.g., Arce et al., 2007; Zapata et al., 2014) and theoretical models of such event have been developed. These are considered as two flavours of the same mass-ejection process in protostars. However, the study of connection between these two forms in MYSOs is still lacking (e.g., Arce et al., 2007; Frank et al., 2014) and very few observations of the simultaneous presence of a highly collimated jet and a wide-angle outflow in MYSOs exist (e.g., Torrelles et al., 2011; Zinchenko et al., 2020). No models predict the simultaneous existence of a jet and a wide-angle outflow as well as rotation of both the components together in MYSOs (e.g., Torrelles et al., 2011). Therefore, the observational study of such two flavours of ejection from MYSOs can provide vital inputs for constraining the accretion based models for massive star formation. In this context, the target of this paper is a genuine MYSO embedded in the infrared dark cloud (IRDC) SDC18.888–0.476 (hereafter SDC18). The target MYSO is associated with both the 6.7 GHz methanol maser emission (MME) and Extended Green Object (EGO).
Situated at a distance of 5.0 kpc, the IRDC SDC18 has been seen as a bright emission region in the submillimeter (sub-mm) maps (see Figure 2 in Dewangan et al., 2020). A massive dust clump at 870 m has been reported toward SDC18 ( 53.8 103 ; 4880 ; Urquhart et al., 2018; Dewangan et al., 2020), which is located at the edge of the W39 H ii region hosting several massive OB-stars (Westerhout, 1958; Kerton et al., 2013). Figure 1a displays the Spitzer 24 m image overlaid with the IRAM 1.2 mm continuum emission contours (beam size 13′′; Rigby et al., 2018), showing the mm emission peaks toward the clump at 870 m. In Figure 1a, we mark the positions of a water maser (Vlsr 65.1 km s-1; Walsh et al., 2011) and a 6.7 GHz MME (Vlsr 56.4 km s-1; Breen et al., 2015; Yang et al., 2019). The position of the 6.7 GHz MME coincides with the peak of 1.2 mm continuum emission and the EGO G18.890.47 (Cyganowski et al., 2008; Towner et al., 2019). Dewangan et al. (2020) identified a point-like source as an infrared counterpart (IRc) of the 6.7 GHz MME (hereafter G18.88MME). Previously, Kerton et al. (2013) characterized this source as a protostar (stellar mass 8 M⊙; see source ID #G18-2 in Table 3 in their paper) using the photometric data at 3.6–24 m. No radio counterpart of G18.88MME is reported in the literature (e.g., Towner et al., 2019; Dewangan et al., 2020). All these results allowed Dewangan et al. (2020) to propose the IRc G18.88MME as a genuine MYSO candidate in a very early evolutionary phase, just before the ultracompact (UC) H ii stage (see an arrow in Figure 1a).
In this letter, we analyzed the Atacama Large Millimeter/submillimeter Array (ALMA) 1.38 mm continuum map and data cubes of SiO, HC3N, and 13CO lines (resolution 0.′′8 or 4000 AU) of G18.88MME, which have enabled us to discover a dense fast narrow jet-like molecular outflow surrounded by a slower wide wind. Both components are found to be rotating.
2 Data sets
We downloaded the ALMA continuum map at 1.38 mm (resolution 0.′′82 0.′′6; P.A. = 66.6) and the processed cubes of three lines (i.e., SiO(5–4), HC3N(24–23), and 13CO(2–1); beam size 0.′′9 0.′′66) from the ALMA science archive. These observations were taken with the 12-m ALMA array in Band-6 under the project 2017.1.00983.S (PI: Brogan, Crystal). All these data sets were produced by the ALMA pipeline. The SiO(5–4), HC3N(24–23), and 13CO(2–1) lines were observed in spectral windows with frequency ranges (bandwidths) of 216.58–217.52 GHz (935 MHz), 217.55–218.49 GHz (468 MHz), and 220.24–220.71 GHz (468 MHz), respectively. The velocity resolutions (rms noise) of the SiO(5–4), HC3N(24–23), and 13CO(2–1) lines are 1.35 km s-1 (2.1 mJy beam-1), 0.33 km s-1 (2.1 mJy beam-1), and 0.33 km s-1 (4.1 mJy beam-1), respectively. Additionally, we used the Spitzer MIPS Inner Galactic Plane Survey (MIPSGAL; Carey et al., 2005) 24 m image (resolution 6′′) and the IRAM 1.2 mm continuum emission map (resolution 13′′; from Rigby et al., 2018) of SDC18.
3 Results
3.1 Continuum Emission
To further study the inner structures of the clump detected in the IRAM 1.2 mm continuum map (see Figure 1a), we present the ALMA 1.38 mm continuum map and contours in Figure 1b. In the direction of G18.88MME, four continuum sources (i.e., MM1, MM2, MM3, and MM4) are identified (see ellipses), and are spatially found at the center of the emission structure (extent 0.3 pc 0.2 pc; see the red contour in Figure 1b) traced in the ALMA map. The continuum sources were selected using the Python-based astrodendro-package111https://dendrograms.readthedocs.io/en/stable/index.html (see also Baug et al., 2020, for more details), which uses the dendrogram algorithm as described in Rosolowsky et al. (2008). In this context, a minimum flux level of 5 was adopted, where the background flux (i.e., 1) of 0.06 mJy beam-1 was estimated from the emission-free areas in the continuum map.
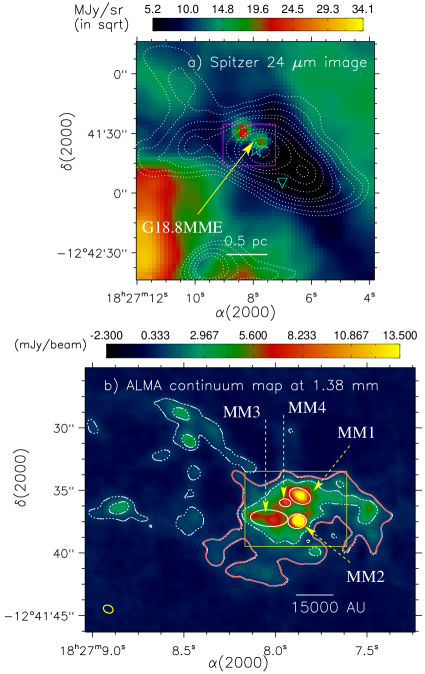
The flux densities (deconvolved angular sizes) of the continuum sources MM1, MM2, MM3, and MM4 are about 33.5 mJy (0.′′92 0.′′6), 37.3 mJy (0.′′75 0.′′58), 24.4 mJy (1.′′53 0.′′66), and 6.3 mJy (0.′′46 0.′′31), respectively. Towner et al. (2019) reported the dust temperature () and the kinetic temperature of the clump hosting G18.88MME to be 22 K and 28 K, respectively. The kinetic temperature was derived from the NH3 emission (Towner et al., 2019). The observed mm fluxes () can be utilized to compute the masses of continuum sources (e.g., Hildebrand, 1983). In the calculations, we adopted the dust opacity () = 0.9 cm2 g-1 at 1.3 mm (Ossenkopf & Henning, 1994), distance () = 5.0 kpc, and = [22, 28] K (see equation 1 in Dewangan et al., 2016). Using the values of and = 22(28) K, the masses of MM1, MM2, MM3, and MM4 are estimated to be 18(13), 20(15), 13(10), and 3.4(2.5) M⊙, respectively. The uncertainty in the mass calculation could be typically 20% to 50%, which includes various uncertainties in the assumed dust temperature, opacity, and measured flux. Among these sources, MM1 is found as a main core associated with the dense gas (see Section 3.2).
3.2 Molecular Line Emission
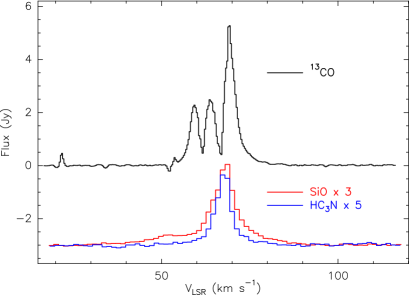
Figure 2 presents the profiles of the 13CO, HC3N and SiO emission toward MM1, indicating the existence of extended non-gaussian wings (indicative of high-velocity outflows) in all of these lines.
In Figures 3a and 3b, we show the integrated intensity emission contours of the red-shifted and blue-shifted components in the SiO, 13CO and HC3N emission superimposed on the ALMA 1.38 mm continuum map. For the blue-shifted 13CO emission we selected the velocity range in the far wing of the line ([44, 50] km s-1) free from the additional emission peaks, which are probably produced by some other components in this complex. All these molecular outflows (extent 28000 AU in SiO) are centered at the continuum source MM1. At the same time the morphology of the emission in different lines is somewhat different. In particular, the 13CO emission apparently surrounds the HC3N emission, especially in the blue lobe. It is worth mentioning that the outflows seem to be bent.
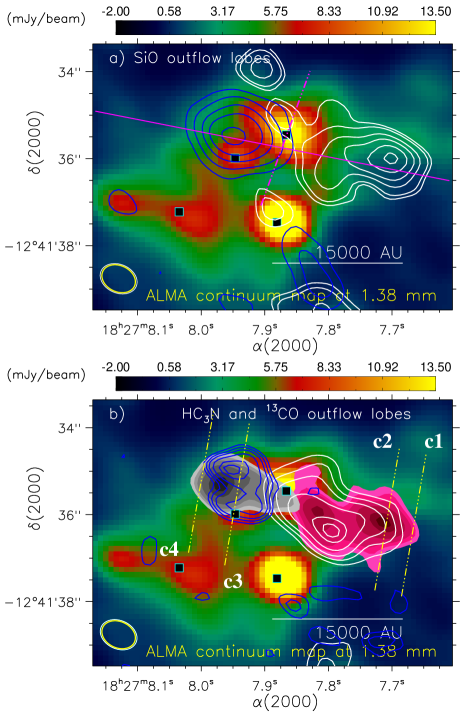
Figure 4 displays the position-velocity (PV) diagram in the HC3N line at the position angle of 160 across MM1 (perpendicular to the outflow), allowing to explore the kinematics of the continuum source. This PV diagram is consistent with a Keplerian-like rotation (although the red-shifted part of the emission is practically missing), which may refer to the probable disk in MM1 (unresolved in the present data). The dynamical central mass of the core is determined to be M⊙, where is the unknown disk inclination (with a high uncertainty due to the insufficient angular resolution).
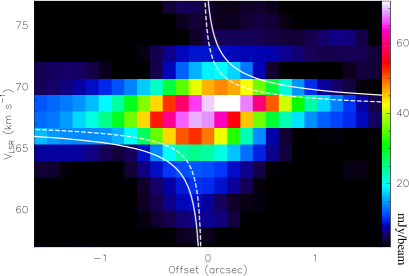
Figure 5a displays the PV diagram in the SiO line along the outflow (at the position angle of 81) across MM1. The PV diagram is also overlaid with the 13CO PV contours (in white). In Figure 5b, we present the overlay of the HC3N PV contours on the PV diagram in the SiO line. The PV diagrams indicate the existence of two components: a fast jet-like one (with a large extent in velocity) and a slower, more extended spatially component (see arrows and a dashed curve in Fig. 5a). The 13CO data may be consistent with a wide-angle wind picture for the slow component, which shows a structure similar to that expected in this case (for comparison see Figure 2 in Arce et al., 2007). The fast SiO outflow component coincides with the HC3N outflow. The PV diagram for this component is typical for the jet-driven bow shock model (Arce et al., 2007).
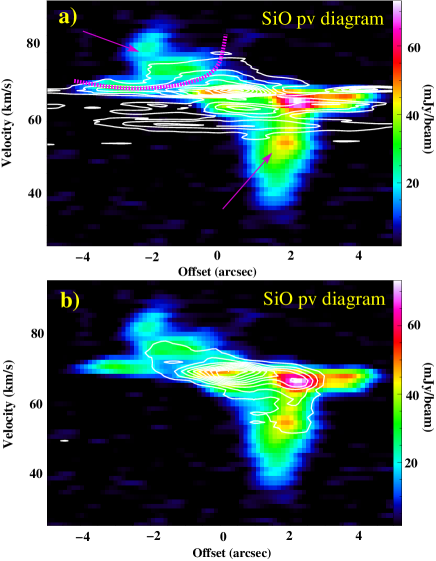
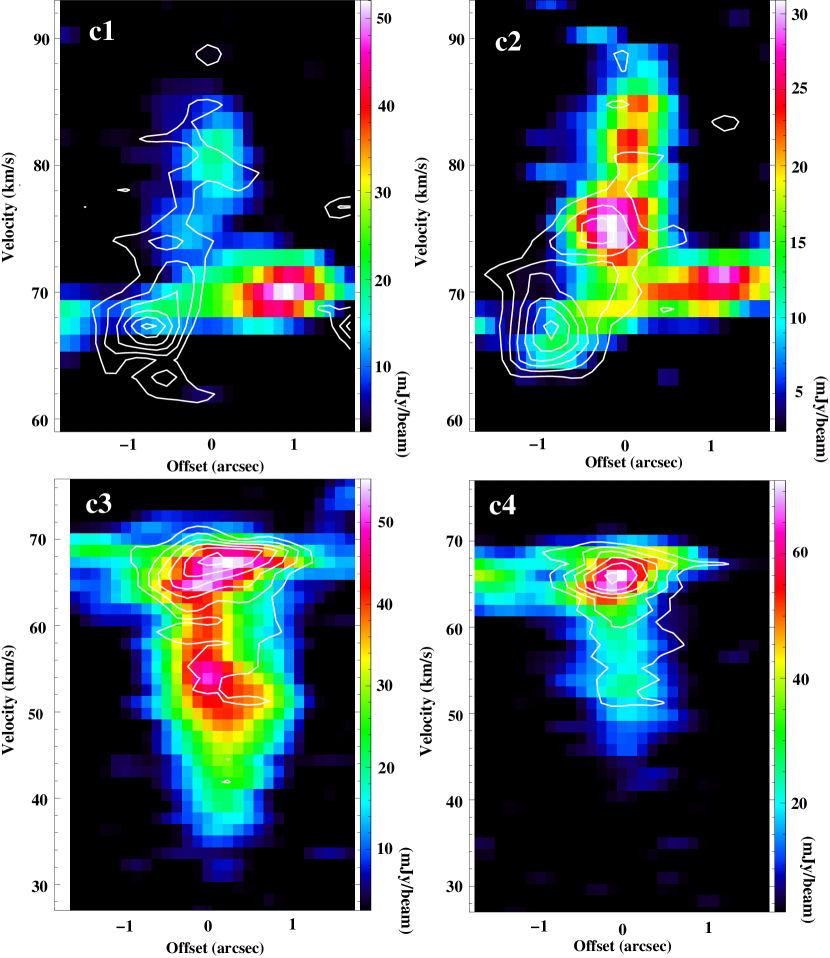
Figure 6 shows the PV diagrams in the SiO line at four cuts across the outflow lobes (i.e., c1–c4 in Figure 3b), allowing us to examine the transverse structure of the outflow. The cuts c1 and c2 are selected toward the red-shifted lobe, while the cuts c3 and c4 are chosen in the direction of the blue-shifted lobe. Each PV diagram is also overlaid with the HC3N PV contours. These PV diagrams show a narrow fast and a wide slow components in both lobes. One can see velocity gradients across the outflow lobes in both components. These gradients are especially clear in the red-shifted outflow lobe (see panels “c1" and “c2"). It has the same sign as in the core. In the blue-shifted fast lobe the gradient is either absent or slightly opposite (see panels “c3" and “c4").
4 Discussion and Conclusion
Outflows/jets are often explained by the X-wind model and disk-wind model (e.g., Arce et al., 2007; Frank et al., 2014). Previously, using the water maser observations, Torrelles et al. (2011) reported a two-wind outflow (i.e., a fast narrow jet and a slower wide-angle outflow) from a massive protostar Cep A HW2. A similar picture is observed in S255IR-SMA1 harboring a 20 M⊙ MYSO (Zinchenko et al., 2020). The observed two flavours of ejection from MYSOs are crucial inputs for unifying the jet-driven and wind-driven scenarios of molecular outflows in MYSOs, which is one of the open research topics in star formation. However, such event is rare in the literature. Hence, the most striking outcome of this work is the simultaneous detection of a wide-angle wind and a narrow jet-like outflow, which are driven by the MYSO G18.88MME embedded in the continuum core MM1 (mass 13–18 M⊙).
The mass of the red-shifted outflow lobe estimated from the 13CO spectrum is M⊙ assuming a normal 13CO abundance (we have no estimate of the 13CO excitation temperature ). The blue part of the 13CO spectrum is contaminated by the emission peaks which prevent such an estimate. The terminal line-of-sight velocity of the outflow as observed in the SiO line is km s-1 in the red lobe and km s-1 in the blue lobe. The SiO relative abundance estimated from the ratio of the SiO and 13CO line wing intensities toward the SiO emission peaks is in the red lobe and in the blue lobe under the assumption of low optical depth and equal LTE excitation of SiO and 13CO with . These values are among the highest SiO abundances observed in the outflows in HMSF regions (Zinchenko et al., 2020).
In general, the HC3N(24–23) line is known as a very good tracer of warm and dense gas in star-forming regions (Lis et al., 1993). The critical density of this transition is cm-3 using the collisional rates obtained by Faure et al. (2016). Its detection in outflows is very rare and indicates a very high density in the fast jet-like outflow. For the HC3N abundance we obtain the values of in the red lobe and a factor of 2 higher in the blue lobe (under the same assumptions as for SiO).
Our outcomes also show velocity gradients across the outflow lobes (see Figure 6), which can be interpreted as rotation. It is worth noting that such interpretation is not unique. Some asymmetries can produce similar velocity gradients (e.g., De Colle et al., 2016). The picture is complicated by the fact that our outflow is apparently bent. Such bending may hint at the disk precession, which can be a consequence of a binary nature of this system (Monin et al., 2007). In this case the rotation is combined with a helical motion which can produce a complicated velocity pattern. Perhaps this can explain the difference in the appearance of the red-shifted and blue-shifted outflow lobes with the absence or even an opposite sign of the velocity gradient in the fast component of the latter one.
If we interpret the velocity gradient in the red-shifted outflow lobe as a rotation, we can try to estimate the launching radius of the outflow following the approach suggested in Anderson et al. (2003). At the cut “c2" (Fig. 6) the total velocity span is about 20 km s-1 at the offset interval of about 0.4 arcsec, which corresponds to 2000 AU. This implies the specific angular momentum of AU km s-1. This is a very high value, much higher than observed in nearby low-mass objects (e.g., Zhang et al., 2018). According to this model the launching radius is about km s-1)-4/3 AU, where is the poloidal velocity. For the typical values of for jets from 100 km s-1 to 1000 km s-1 (e.g. Anglada et al., 2018) the launching radius varies from 30 AU to 1.4 AU. These estimates indicate the disk wind as a launching mechanism for the outflow. However, they should be considered as very preliminary since the data do not permit us to see the morphology of the outflow lobes and to judge whether the observed high-velocity gas is ejected from the disk or represents the entrained material. So fast rotation on such large scales needs a confirmation.
There is a question whether the two components have separate origins or perhaps we see a transformation of the fast outflow into a slower one. A larger extent of the slow component is an argument against the latter suggestion. In principle there can be episodic ejections but the data do not provide any support for such suggestion. The jet-driven bow shock model for the fast outflow implies an existence of the underlying ionized jet. It can be revealed by high resolution radio and/or IR observations.
Finally, we can conclude that G18.88MME represents a unique case of a massive YSO driving a very dense probably rotating fast jet-like molecular outflow surrounded by a slower wide-angle wind. This object deserves an investigation at a much higher angular resolution.
Data availability
The ALMA continuum data underlying this article are available from the publicly accessible JVO ALMA FITS archive222http://jvo.nao.ac.jp/portal/alma/archive.do/. The Spitzer 24 m continuum map underlying this article is available from the publicly accessible NASA/IPAC infrared science archive333https://irsa.ipac.caltech.edu/frontpage/. The published IRAM 1.2 mm continuum map underlying this article is available from the website of the VizieR Service444https://vizier.u-strasbg.fr/viz-bin/VizieR.
Acknowledgments
We are very grateful to the anonymous referee for the helpful comments. I.I.Z. acknowledges the support by the Russian Science Foundation (grant No. 17-12-01256). The research work at Physical Research Laboratory is funded by the Department of Space, Government of India. DKO acknowledges the support of the Department of Atomic Energy, Government of India, under project Identification No. RTI 4002. This work is based [in part] on observations made with the Spitzer Space Telescope, which is operated by the Jet Propulsion Laboratory, California Institute of Technology under a contract with NASA. This paper makes use of the following archival ALMA data: ADS/JAO.ALMA#2017.1.00983.S. ALMA is a partnership of ESO (representing its member states), NSF (USA) and NINS (Japan), together with NRC (Canada), MOST and ASIAA (Taiwan), and KASI (Republic of Korea), in cooperation with the Republic of Chile. The Joint ALMA Observatory is operated by ESO, AUI/NRAO and NAOJ.
References
- Anderson et al. (2003) Anderson J. M., Li Z.-Y., Krasnopolsky R., Blandford R. D., 2003, ApJ, 590, L107
- Anglada et al. (2018) Anglada G., Rodríguez L. F., Carrasco-González C., 2018, A&ARv, 26, 3
- Arce et al. (2007) Arce H. G., Shepherd D., Gueth F., Lee C. F., Bachiller R., Rosen A., Beuther H., 2007, in Reipurth B., Jewitt D., Keil K., eds, Protostars and Planets V. p. 245 (arXiv:astro-ph/0603071)
- Baug et al. (2020) Baug T., et al., 2020, ApJ, 890, 44
- Breen et al. (2015) Breen S. L., et al., 2015, MNRAS, 450, 4109
- Carey et al. (2005) Carey S. J., et al., 2005, in American Astronomical Society Meeting Abstracts. p. 63.33
- Cyganowski et al. (2008) Cyganowski C. J., et al., 2008, AJ, 136, 2391
- De Colle et al. (2016) De Colle F., Cerqueira A. H., Riera A., 2016, ApJ, 832, 152
- Dewangan et al. (2016) Dewangan L. K., Ojha D. K., Luna A., Anandarao B. G., Ninan J. P., Mallick K. K., Mayya Y. D., 2016, ApJ, 819, 66
- Dewangan et al. (2020) Dewangan L. K., Ojha D. K., Sharma S., Palacio S. d., Bhadari N. K., Das A., 2020, ApJ, 903, 13
- Faure et al. (2016) Faure A., Lique F., Wiesenfeld L., 2016, MNRAS, 460, 2103
- Frank et al. (2014) Frank A., et al., 2014, in Beuther H., Klessen R. S., Dullemond C. P., Henning T., eds, Protostars and Planets VI. p. 451 (arXiv:1402.3553), doi:10.2458/azu_uapress_9780816531240-ch020
- Hildebrand (1983) Hildebrand R. H., 1983, QJRAS, 24, 267
- Kerton et al. (2013) Kerton C. R., Arvidsson K., Alexander M. J., 2013, AJ, 145, 78
- Lis et al. (1993) Lis D. C., Goldsmith P. F., Carlstrom J. E., Scoville N. Z., 1993, ApJ, 402, 238
- Monin et al. (2007) Monin J.-L., Clarke C. J., Prato L., McCabe C., 2007, Protostars and Planets V, pp 395–409
- Motte et al. (2018) Motte F., Bontemps S., Louvet F., 2018, ARA&A, 56, 41
- Ossenkopf & Henning (1994) Ossenkopf V., Henning T., 1994, A&A, 291, 943
- Rigby et al. (2018) Rigby A. J., et al., 2018, A&A, 615, A18
- Rosen et al. (2020) Rosen A. L., Offner S. S. R., Sadavoy S. I., Bhandare A., Vázquez-Semadeni E., Ginsburg A., 2020, Space Sci. Rev., 216, 62
- Rosolowsky et al. (2008) Rosolowsky E. W., Pineda J. E., Kauffmann J., Goodman A. A., 2008, ApJ, 679, 1338
- Torrelles et al. (2011) Torrelles J. M., et al., 2011, MNRAS, 410, 627
- Towner et al. (2019) Towner A. P. M., Brogan C. L., Hunter T. R., Cyganowski C. J., Friesen R. K., 2019, ApJ, 875, 135
- Urquhart et al. (2018) Urquhart J. S., et al., 2018, MNRAS, 473, 1059
- Walsh et al. (2011) Walsh A. J., et al., 2011, MNRAS, 416, 1764
- Westerhout (1958) Westerhout G., 1958, Bull. Astron. Inst. Netherlands, 14, 215
- Yang et al. (2019) Yang K., et al., 2019, ApJS, 241, 18
- Zapata et al. (2014) Zapata L. A., Arce H. G., Brassfield E., Palau A., Patel N., Pineda J. E., 2014, MNRAS, 441, 3696
- Zhang et al. (2018) Zhang Y., et al., 2018, ApJ, 864, 76
- Zinchenko et al. (2020) Zinchenko I. I., Liu S.-Y., Su Y.-N., Wang K.-S., Wang Y., 2020, ApJ, 889, 43
- Zinnecker & Yorke (2007) Zinnecker H., Yorke H. W., 2007, ARA&A, 45, 481