Anomalous spin waves in CsFeCl3 and RbFeCl3
Abstract
We investigate magnetic excitations in the easy-plane-type triangular antiferromagnets CsFeCl3 and RbFeCl3 through a combination of inelastic neutron scattering measurements and spin-wave theory calculations based on an established exchange-coupling Hamiltonian. We show that in either material the model falls short of providing an adequate description of the measured intensities and for RbFeCl3 even fails to reproduce the measured dispersion relation. The most striking discrepancy is a very anisotropic azimuthal intensity distribution in the acoustic spin-wave branches in the long-wavelength limit, which is incompatible with spin-wave theory on a fundamental level. The observed anomalies are attributed to long-range dipolar interactions.
I Introduction
The alkali-metal trichloroferrates FeCl3 ( Cs and Rb) are prototypical triangular lattice antiferromagnets with strong planar magnetic anisotropy [1, 2, 3, 4, 5]. Under the influence of hydrostatic pressure [6, 7, 8] or chemical composition [9] they are known to exhibit quantum phase transitions between gapped quantum-paramagnetic and magnetically ordered states. Spin-wave excitations in both compounds have been extensively studied and interpreted based on a model Hamiltonian with short-range interactions [4, 10, 11, 8]. The latter includes easy-plane single-ion anisotropy, ferromagnetic chains, and antiferromagnetic coupling in the triangular lattice that the chains are arranged in. At the same time, it is well established that long-ranged magnetic dipolar interactions may also be relevant. In particular, these are seen as being responsible for additional narrow incommensurate magnetic phases found in RbFeCl3 between the classic 120∘ structure at low temperature and the high-temperature paramagnetic phases [12, 13, 14, 15]. What effect, if any, do these interactions have on the spin-wave excitations in these species?
To answer this question, we undertake a detailed quantitative analysis of the inelastic neutron scattering (INS) experiments briefly reported in our previous paper [9]. We utilize the so-called extended spin-wave theory (ESWT) [16, 17] based on a Hamiltonian with short-range interactions. For CsFeCl3, this approach seems to work reasonably well but requires the introduction of additional exchange constants not considered in the previous studies [4, 10, 11, 8]. Even so, some quantitative discrepancies between experiment and calculation remain. For RbFeCl3 though, ESWT fails already on a qualitative level. The most striking finding is that in the long-wavelength limit the measured spin-wave intensity is highly anisotropic near magnetic Bragg peaks. In contrast, spin-wave analysis based on short-range interactions alone predicts an isotropic intensity distribution. Other important discrepancies are apparent in certain features of the dispersion curves.
II Material and experiment
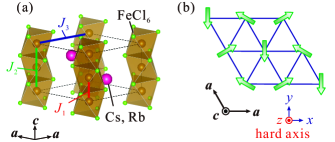
Both CsFeCl3 and RbFeCl3 crystallize in a hexagonal structure with the space group [18]. The lattice parameters are as reported in Ref. [9]. Magnetism is due to Fe2+ ions (, , ). Face-sharing FeCl6 octahedra form one-dimensional chains along the crystallographic axis. The chains form a triangular lattice in the plane [Fig. 1(a)]. The low-energy excitation of the Fe2+ ion is described by a pseudospin because of the cubic crystal-field and spin-orbit coupling [3]. In the following, we represent the pseudospin as for convenience. CsFeCl3 is a quantum paramagnet, with a gapped disordered ground state [4, 5]. RbFeCl3 shows magnetic long-range order (LRO) below 2.6 K [5]. Below 1.95 K the structure is a 120∘ spin arrangement with a commensurate propagation vector [12], as displayed in Fig. 1(b).
Details of the neutron scattering experiment to measure the spin-wave spectrum were reported in Ref. [9]. The data were collected at the Cold Neutron Chopper Spectrometer (CNCS) [19, 20] installed at the Spallation Neutron Source (SNS) of Oak Ridge National Laboratory, Oak Ridge, Tennessee. The energies of the incident neutron beam were set at and 2.99 meV, yielding energy resolutions of and 0.09 meV at the elastic position, respectively. All data were analyzed using HORACE software [21]

III Theoretical approach
To quantitatively analyze the spin-wave excitations, we employ the ESWT approach [16, 17]. It is equivalent to the harmonic bond-operator theory [22, 23, 24, 25] and is applied to noncollinear spin structure systems [26]. We consider an effective Hamiltonian of the easy-plane-type antiferromagnet as follows:
| (1) | |||||
where and are the nearest- and next-nearest-neighbor interactions in the chain and is the nearest-neighbor in-plane interaction. The exchange paths are displayed in Fig. 1(a). The summation is taken over all sites connected by , , and . Note that the possibility of a coupling has not been considered in previous studies [4, 10, 11, 8]. is positive and gives the easy-plane single-ion anisotropy. This anisotropy splits the triplet spin state into the singlet and the doublet states, thus supporting a gapped paramagnetic state. In contrast, the spin interactions favor magnetic order.
The ESWT calculation on INS spectra for Hamiltonian (1) is reported in Refs. [8, 27]. The approach is applicable to both the gapped and ordered phases. The spectra in the two regimes can be described as follows. In the gapped phase (as in CsFeCl3), two degenerated gapped modes emerge. In the ordered state (as in RbFeCl3), the degenerated modes split into gapless and gapped modes. Owing to the three sublattices of the structure, six modes are generated in total: , , , and . The gapless and gapped modes are mainly associated with the transverse and longitudinal fluctuations of the spins, respectively, even though they are hybridized to some extent due to the noncollinear spin structure [8, 27].
The dynamical structure factor (intensity) for and is much smaller than for and because the former represents spin fluctuations along the hard axis [see the coordinates in the schematics of Fig. 1(b)]. In the following, we thus display only and . For plotting , polarization factors and the magnetic form factor are taken into account as reported in Refs. [8, 27].
IV Results
IV.1 CsFeCl3: quantum paramagnetic state
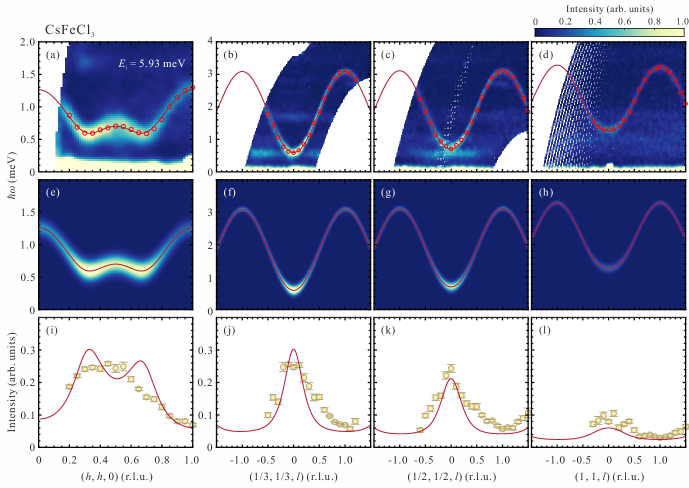
For CsFeCl3, a gapped dispersion relation is observed below 4 meV, and the ESWT calculation is in excellent agreement with the observed dispersion [Figs. 2(a)–2(d)]. We quantified the measured dispersion by analyzing individual constant- cuts of the data, in which peaks at each wave vector were fitted by the Gaussian function. Note that the flat intensity bands at and 1.8 meV are spurious as mentioned in Ref. [9]. For data in the plane, the fitted peak linewidths vary between the computed energy resolution of the instrument (approximately 0.2 meV at a typical 0.5-meV energy transfer for meV) at and almost twice that value at . The Hamiltonian parameters are evaluated from a global least-squares fitting of the dispersion relation calculated along the four directions to the one measured. The best agreement is obtained by allowing for a weak antiferromagnetic next-nearest-neighbor interaction in the chains, which was disregarded in previous studies [4, 10, 11, 8]. The fitted parameters and variances are listed in Table 1 and correspond to a fit with .
At first glance, the neutron scattering intensities simulated using the parameters obtained from analyzing the dispersion agree well with the measured spectra, as shown in Figs. 2(e)–2(h). These false-color plots are obtained by convolution of the ESWT-computed intensities with the calculated energy-dependent resolution of the spectrometer. A more careful look reveals quantitative discrepancies. Figures 2(i)–2(l) show the measured energy-integrated intensities (symbols) in comparison with the ESWT result. The scaling of the ESWT curves is arbitrary but consistent between the four panels. One immediately notices that the measured intensities seem to lack distinct maxima predicted near the zone centers of the 120∘-structure and .
Figures 3(a)–3(i) focus on the spectra for momentum transfers in the triangular plane. Three equivalent cuts through , namely, along the , , and directions are shown, respectively, as illustrated in Fig. 3(j). The calculated spectra are qualitatively similar to the observed measured neutron spectra [Figs. 3(a)–3(f)]. The measured integrated intensities clearly lack the characteristic double-hump structure consistently predicted by the ESWT calculations [Figs. 3(g)–3(i)].
| CsFeCl3 | ||||
|---|---|---|---|---|
| Ref. [4] | - | |||
| Ref. [8] | - | |||
| This paper | ||||
| RbFeCl3 | ||||
| Ref. [4] | - | |||
| This paper | ||||
IV.2 RbFeCl3: magnetically ordered state
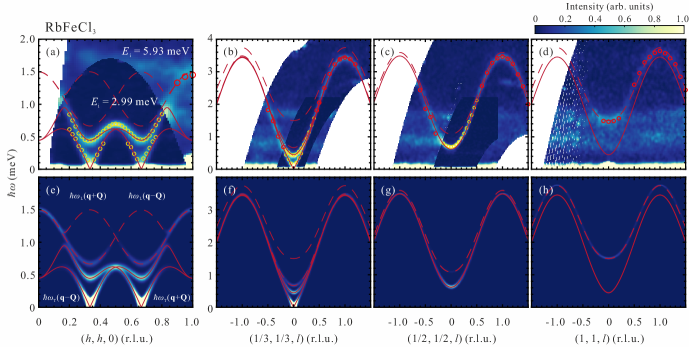
In the magnetically ordered RbFeCl3, we observe gapless linear dispersion at magnetic Bragg peaks and and a dispersive excitation above the gapless modes, as shown in Figs. 4(a)–4(d). The observed dispersion is analyzed in the same way as CsFeCl3. For data in the plane, the fitted peak linewidths vary between the computed energy resolution of the instrument (approximately 0.08 meV at a typical 0.5-meV energy transfer for meV) at and about twice that value at . Unlike in the case of CsFeCl3, where the dispersion is rather flat at low energies, for the steep dispersion in RbFeCl3 the fitted linewidth appears to be largely due to a finite wave-vector resolution and focusing effects. The evaluated Hamiltonian parameters are listed in Table 1. Even in the best fit, , which is considerably worse than was obtained for the Cs-based species. The discrepancies are quite apparent in a comparison with intensities simulated based on the fit results [Figs. 4(e)–4(h)]. The main inconsistencies are for momentum transfers in the direction, particularly near . Here, the observed energy of the well-defined magnon peak is higher than the ESWT estimates from the spin-wave velocity, which is well defined through lower-energy data. Moreover, ESWT predicts a pair of identical branches that emanate from the and Bragg peaks, respectively, and cross at . In contrast, the data seem to show an acoustic branch connecting the two Bragg peaks and a separate optical mode.
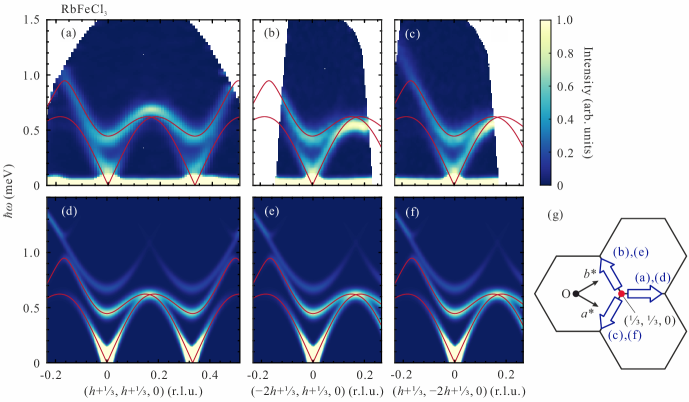
These discrepancies become even more apparent if one considers cuts through the magnetic Bragg peak along the , , and directions. For ESWT, these directions are equivalent, as can be seen from the simulations in Figs. 5(d)–5(f). This has to do with the residual threefold degeneracy of the spin-wave branches. Each branch may have nonsymmetric structure factors and unpolarized-neutron polarization factors, but their total combined intensity, modulo the ionic magnetic form factor, has threefold symmetry around . Compared with the experiment [Figs. 5(a)–5(c)], the relative intensities of calculated magnon branches are clearly different, as are the intensity distributions within each mode. This observation alone signifies a qualitative failure of the ESWT calculation and/or of Hamiltonian (1).
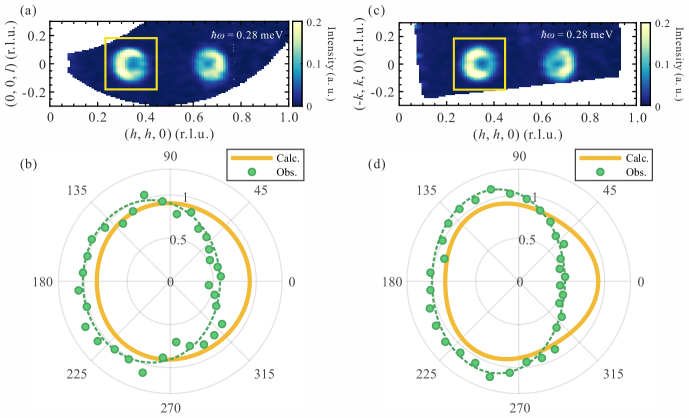
The most striking discrepancy is that the measured neutron intensities are very anisotropic near the magnetic zone center even at the lowest energies, whereas ESWT predicts an isotropic intensity distribution. This is borne out in Figs. 6(a) and 6(c), which show 0.05-meV-thick constant-energy slices projected onto the - and - planes. The measured intensity distribution is crescent shaped in both slices. The corresponding polar intensity plots are kidney shaped, with a twofold azimuthal symmetry, as shown in Figs. 6(b) and 6(d). In ESWT, the intensity distribution around the magnetic zone center is isotropic in the low-energy–long-wavelength limit. As mentioned above and as can be seen in Figs. 6(b) and 6(d), it still retains at least a threefold symmetry at the finite energy transfer of 0.28 meV. This again clearly contradicts the observations.
V Discussion and concluding remarks
ESWT based on Hamiltonian (1) has its limits in describing magnetic excitations in either material. In the case of RbFeCl3, the discrepancies are substantial and qualitative in nature. The failure of our approach at low energies, i.e., in the long-wavelength limit, is particularly telling. This inconsistency cannot be resolved by including additional exchange interactions into the model. According to the Hohenberg-Brinkman first moment sum rule [28] applied to an exchange spin Hamiltonian [29], the total spin-wave intensity (energy-weighted sum over all dispersion branches) is a smooth trigonometric function of the wave vector. Nonanalytical behavior can sometimes occur near mode crossing, where intensities are rapidly redistributed between interacting branches. A prime example is spin waves in a honeycomb Heisenberg ferromagnet in the vicinity of Weyl points [30, 31]. The resulting crescentlike intensity patterns are superficially similar to those observed in this paper. However, in RbFeCl3 the unusual azimuthal intensity modulation occurs in acoustic spin waves, far removed from any optical branches. This singular behavior at long wavelengths must be a manifestation of long-range spin interactions with nonanalyticities in their Fourier transforms at small momenta. The most likely culprit is dipolar coupling. As mentioned in the Introduction, the latter is well known to be relevant, at least for RbFeCl3, where dipolar coupling results in incommensurate magnetic phases just below the paramagnetic transition [13, 14, 15]. A good example of dipolar interactions resulting in singularities in neutron scattering intensities is the famous spectral pinch points in rare-earth-based spin ice materials [32, 33, 34, 35, 36]. Theoretical studies also demonstrate that long-range interactions give rise to anomalous damping of magnons in the long-wavelength limit [37, 38]. We suggest that long-range interactions may be relevant for the spin dynamics in CsFeCl3 and RbFeCl3 as well. The next step would be analytical or numerical calculations of spin-wave spectra with long-range dipolar coupling taken into account, for a direct comparison with experiment.
Acknowledgements.
We thank Dr. K. Yu. Povarov and Dr. V. K. Bhartiya for helpful comments on the spin-wave analysis. This work was supported by Swiss National Science Foundation under Division II. The neutron scattering experiment at the CNCS used resources at the Spallation Neutron Source, a Department of Energy Office of Science User Facility operated by the Oak Ridge National Laboratory (IPTS-21713.1).References
- Montano et al. [1973] P. A. Montano, E. Cohen, H. Shechter, and J. Makovsky, Linear Chains with a Ferromagnetic Interaction in RbFeCl3, Phys. Rev. B 7, 1180 (1973).
- Montano et al. [1974] P. A. Montano, H. Shechter, E. Cohen, and J. Makovsky, Mössbauer study on CsFeCl3 and RbFeCl3, Phys. Rev. B 9, 1066 (1974).
- Eibschütz et al. [1975] M. Eibschütz, M. E. Lines, and R. C. Sherwood, Magnetism in orbitally unquenched chainar compounds. II. The ferromagnetic case: RbFeCl3, Phys. Rev. B 11, 4595 (1975).
- Yoshizawa et al. [1980] H. Yoshizawa, W. Kozukue, and K. Hirakawa, Neutron scattering study of magnetic excitations in pseudo-one-dimensional singlet ground state ferromagnets CsFeCl3 and RbFeCl3, J. Phys. Soc. Jpn. 49, 144 (1980).
- Haseda et al. [1981] T. Haseda, N. Wada, M. Hata, and K. Amaya, Spin ordering in a triangular X-Y antiferromagnet : CsFeCl3 and RbFeCl3, Phys. B+C 108, 841 (1981).
- Kurita and Tanaka [2016] N. Kurita and H. Tanaka, Magnetic-field- and pressure-induced quantum phase transition in CsFeCl3 proved via magnetization measurements, Phys. Rev. B 94, 104409 (2016).
- Hayashida et al. [2018] S. Hayashida, O. Zaharko, N. Kurita, H. Tanaka, M. Hagihala, M. Soda, S. Itoh, Y. Uwatoko, and T. Masuda, Pressure-induced quantum phase transition in the quantum antiferromagnet CsFeCl3, Phys. Rev. B 97, 140405(R) (2018).
- Hayashida et al. [2019a] S. Hayashida, M. Matsumoto, M. Hagihala, N. Kurita, H. Tanaka, S. Itoh, T. Hong, M. Soda, Y. Uwatoko, and T. Masuda, Novel excitations near quantum criticality in geometrically frustrated antiferromagnet CsFeCl3, Sci. Adv. 5, eaaw5639 (2019a).
- Hayashida et al. [2019b] S. Hayashida, L. Stoppel, Z. Yan, S. Gvasaliya, A. Podlesnyak, and A. Zheludev, Chemical composition induced quantum phase transition in Cs1-xRbxFeCl3, Phys. Rev. B 99, 224420 (2019b).
- Petitgrand et al. [1981] D. Petitgrand, B. Hennion, P. Radhakrishna, C. Escribe, and S. Legrand, Spin waves in the pseudo 1-d ferromagnetic RbFeCl3, in Recent Developments in Condensed Matter Physics, edited by J. T. Devreese, L. F. Lemmens, V. E. Van Doren, and J. Van Royen (Springer, Boston, MA, 1981), Vol. 4, p. 205.
- Suzuki [1983a] N. Suzuki, Magnetic excitations in the triangular spin structure of singlet-ground-state hexagonal antiferromagnet RbFeCl3, Solid State Commun. 48, 121 (1983a).
- Wada et al. [1982] N. Wada, K. Ubukoshi, and K. Hirakawa, Incommensurate magnetic phase transitions in the triangular XY-like antiferromagnet RbFeCl3, J. Phys. Soc. Jpn. 51, 2833 (1982).
- Shiba and Suzuki [1982] H. Shiba and N. Suzuki, Incommensurate magnetic structures in triangular antiferromagnets caused by the dipole-dipole interaction: a realization of conical-point instability, J. Phys. Soc. Jpn. 51, 3488 (1982).
- Shiba and Suzuki [1983] H. Shiba and N. Suzuki, A possibillity of triple-Q incommensurate magnetic structre in RbFeCl3-type triangular antiferromagnets, J. Phys. Soc. Jpn. 52, 1382 (1983).
- Suzuki [1983b] N. Suzuki, A microscopic theory of the phase transition in RbFeCl3-type hexagonal antiferromagnets: Effects of the dipole-dipole interaction, J. Phys. Soc. Jpn. 52, 3199 (1983b).
- Shiina et al. [2003] R. Shiina, H. Shiba, P. Thalmeier, A. Takahashi, and O. Sakai, Dynamics of multipoles and neutron scattering spectra in quadrupolar ordering phase of CeB6, J. Phys. Soc. Jpn. 72, 1216 (2003).
- Matsumoto et al. [2008] M. Matsumoto, T. Shoji, and M. Koga, Theory of magnetic excitations and electron spin resonance for anisotropic spin dimer systems, J. Phys. Soc. Jpn. 77, 074712 (2008).
- Kohne et al. [1993] A. Kohne, E. Kemnitz, H. Mattausch, and A. Simon, Crystal structure of caesium trichloferrate(II) CsFeCl3, Z. Kristallogr. 203, 316 (1993).
- Ehlers et al. [2011] G. Ehlers, A. A. Podlesnyak, J. L. Niedziela, E. B. Iverson, and P. E. Sokol, The new cold neutron chopper spectrometer at the Spallation Neutron Source: Design and performance, Rev. Sci. Instrum. 82, 085108 (2011).
- Ehlers et al. [2016] G. Ehlers, A. A. Podlesnyak, and A. I. Kolesnikov, The cold neutron chopper spectrometer at the spallation neutron source—A review of the first 8 years of operation, Rev. Sci. Instrum. 87, 093902 (2016).
- Ewings et al. [2016] R. A. Ewings, A. Buts, M. D. Le, J. van Duijn, I. Bustinduy, and T. G. Perring, Horace: Software for the analysis of data from single crystal spectroscopy experiments at time-of-flight neutron instruments, Nucl. Instrum. Methods Phys. Res. Sec. A 834, 132 (2016).
- Sachdev and Bhatt [1990] S. Sachdev and R. N. Bhatt, Bond-operator representation of quantum spins: Mean-field theory of frustrated quantum Heisenberg antiferromagnets, Phys. Rev. B 41, 9323 (1990).
- Sommer et al. [2001] T. Sommer, M. Vojta, and K. Becker, Magnetic properties and spin waves of bilayer magnets in a uniform field, The European Physical Journal B - Condensed Matter and Complex Systems 23, 329 (2001).
- Matsumoto et al. [2002] M. Matsumoto, B. Normand, T. M. Rice, and M. Sigrist, Magnon dispersion in the field-induced magnetically ordered phase of TlCuCl3, Phys. Rev. Lett. 89, 077203 (2002).
- Matsumoto et al. [2004] M. Matsumoto, B. Normand, T. M. Rice, and M. Sigrist, Field- and pressure-induced magnetic quantum phase transitions in TlCuCl3, Phys. Rev. B 69, 054423 (2004).
- Matsumoto [2014] M. Matsumoto, Electromagnon as a probe of higgs (longitudinal) mode in collinear and noncollinear magnetically ordered states, J. Phys. Soc. Jpn. 83, 084704 (2014).
- Matsumoto et al. [2020] M. Matsumoto, S. Hayashida, and T. Masuda, Analysis of field-induced nonreciprocal magnon in noncollinear magnet and application to triangular antiferromagnet CsFeCl3, J. Phys. Soc. Jpn. 89, 034710 (2020).
- Hohenberg and Brinkman [1974] P. C. Hohenberg and W. F. Brinkman, Sum rules for the frequency spectrum of linear magnetic chains, Phys. Rev. B 10, 128 (1974).
- Zaliznyak and Lee [2005] I. A. Zaliznyak and S.-H. Lee, Magnetic neutron scattering, in Modern Techniques for Characterizing Magnetic Materials, edited by Y. Zhu (Springer, New York, 2005), pp. 3–64.
- [30] S. Shivam, R. Coldea, R. Moessner, and P. McClarty, Neutron scattering signatures of magnon Weyl points, arXiv:1712.08535 [cond-mat.str-el] .
- Elliot et al. [2021] M. Elliot, P. A. McClarty, D. Prabhakaran, R. D. Johnson, H. C. Walker, P. Manuel, and R. Coldea, Order-by-disorder from bond-dependent exchange and intensity signature of nodal quasiparticles in a honeycomb cobaltate, Nat. Commun. 12, 3936 (2021).
- Bramwell and Gingras [2001] S. T. Bramwell and M. J. P. Gingras, Spin ice state in frustrated magnetic pyrochlore materials, Science 294, 1495 (2001).
- Bramwell et al. [2001] S. T. Bramwell, M. J. Harris, B. C. den Hertog, M. J. P. Gingras, J. S. Gardner, D. F. McMorrow, A. R. Wildes, A. L. Cornelius, J. D. M. Champion, R. G. Melko, and T. Fennell, Spin correlations in ho2ti2o7: A dipolar spin ice system, Phys. Rev. Lett. 87, 047205 (2001).
- Isakov et al. [2004] S. V. Isakov, K. Gregor, R. Moessner, and S. L. Sondhi, Dipolar Spin Correlations in Classical Pyrochlore Magnets, Phys. Rev. Lett. 93, 167204 (2004).
- Henley [2005] C. L. Henley, Power-law spin correlations in pyrochlore antiferromagnets, Phys. Rev. B 71, 014424 (2005).
- Fennell et al. [2009] T. Fennell, P. P. Deen, A. R. Wildes, K. Schmalzl, D. Prabhakaran, A. T. Boothroyd, R. J. Aldus, D. F. McMorrow, and S. T. Bramwell, Magnetic coulomb phase in the spin ice Ho2Ti2O7, Science 326, 415 (2009).
- Syromyatnikov [2010] A. V. Syromyatnikov, Anomalously large damping of long-wavelength quasiparticles caused by long-range interaction, Phys. Rev. B 82, 024432 (2010).
- Batalov and Syromyatnikov [2015] L. A. Batalov and A. V. Syromyatnikov, Breakdown of long-wavelength magnons in cubic antiferromagnets with dipolar forces at small temperature, Phys. Rev. B 91, 224432 (2015).