11email: kono2@ucsc.edu 22institutetext: Department of Earth and Planetary Sciences, Tokyo Institute of Technology, Meguro, Tokyo, 152-8551, Japan 33institutetext: National Astronomical Observatory of Japan, Osawa, Mitaka, Tokyo, 181-8588, Japan
33email: takahiro.ueda@nao.ac.jp
Jupiter’s “cold” formation in the protosolar disk shadow
Abstract
Context. Atmospheric compositions offer valuable clues to planetary formation and evolution. Jupiter has been the most well-studied giant planet in terms of its atmosphere; however, the origin of the Jovian atmospheric composition remains a puzzle as the abundances of nitrogen and noble gases as high as those of other elements could only originate from extremely cold environments.
Aims. We propose a novel idea for explaining the Jovian atmospheric composition: Dust pileup at the H2O snow line casts a shadow and cools the Jupiter orbit so that N2 and noble gases can freeze. Planetesimals or a core formed in the shadowed region can enrich nitrogen and noble gases as much as other elements through their dissolution in the envelope.
Methods. We compute the temperature structure of a shadowed protosolar disk with radiative transfer calculations. Then, we investigate the radial volatile distributions and predict the atmospheric composition of Jupiter with condensation calculations.
Results. We find that the vicinity of the current Jupiter orbit, approximately –, could be as cold as if the small-dust surface density varies by a factor of across the H2O snow line. According to previous grain growth simulations, this condition could be achieved by weak disk turbulence if silicate grains are more fragile than icy grains. The shadow can cause the condensation of most volatile substances, namely N2 and Ar. We demonstrate that the dissolution of shadowed solids can explain the elemental abundance patterns of the Jovian atmosphere even if proto-Jupiter was formed near Jupiter’s current orbit.
Conclusions. The disk shadow may play a vital role in controlling atmospheric compositions. The effect of the shadow also impacts the interpretation of upcoming observations of exoplanetary atmospheres by JWST.
Key Words.:
Planets: formation – Planets: atmospheres – Planets: composition – Planets: gaseous planets – Planets: Jupiter – Planets: Saturn – Astrochemistry – Protoplanetary disks – Exoplanets1 Introduction
Atmospheric compositions encapsulate the information on planet formation. Jupiter has been the most well-studied gas giants in terms of atmospheric composition. Extensive observations by the Galileo probe, Cassini, and JUNO spacecraft have revealed that O, C, N, S, P, Ar, Kr, and Xe are all uniformly enriched from protosolar abundances by a factor of two to four (Mahaffy et al., 2000; Wong et al., 2004; Fletcher et al., 2009; Bolton et al., 2017; Li et al., 2020). The heavy-element enrichment likely originates from planetesimals and/or pebbles dissolved in the atmosphere (e.g., Pollack et al., 1986; Iaroslavitz & Podolak, 2007; Hori & Ikoma, 2011; Venturini et al., 2016) and/or core erosion (e.g., Guillot et al., 2004; Moll et al., 2017). Intriguingly, the abundances of highly volatile elements, such as N and Ar, are comparable to the other elemental abundances.
The origin of the uniformly enriched Jovian atmosphere has been a long-standing puzzle because solid dissolution hardly enhances the highly volatile elements. Owen et al. (1999) suggested that the uniform enrichment originates from planetesimals formed in extremely cold () environments, where noble gases can freeze. Öberg & Wordsworth (2019) suggested that the uniform enrichment could be explained if the Jovian core had formed beyond the Ar snow line, presumably placed at (see also Bosman et al., 2019). However, the migration of a core from to is a rare occurrence, according to theoretical studies on core formation and migration (Bitsch et al., 2015, 2019). Even if such a migration occurs, the core arrives at the current orbit at (Alibert et al., 2005; Bitsch et al., 2019). This is in tension with the isotope dichotomy of meteorites, indicating that Jupiter may demarcate the inner and outer Solar System within (Kruijer et al., 2017, 2020).
In this letter we propose an alternative idea to explain the uniformly enriched Jovian atmosphere: The shadow cast by dust pileup at the H2O snow line produced extremely cold environments near the current Jupiter orbit, leading to the formation of volatile-rich solids there. The dissolution of such “shadowed solids” can enrich the abundances of highly volatile elements as much as other elements, even if proto-Jupiter formed near the current orbit.
2 Method
2.1 Basic idea
The mid-plane temperature in the outer region of protoplanetary disks is determined by the stellar irradiation grazing at the disk surface. Since the stellar light comes from the center of the disk, a shadowed region where the direct stellar light never reaches is potentially generated, depending on the surface structure of the inner region. For example, a puffed inner disk rim can block off stellar light and cast a shadow, so-called self-shadowing (Dullemond et al., 2001; Dullemond & Dominik, 2004). The presence of the self-shadow has been suggested from several disk observations (e.g., Garufi et al., 2017; Avenhaus et al., 2018). The shadow can also emerge when dust grains are accumulated somewhere and block off the stellar light. Ueda et al. (2019) showed that a dust pileup at the inner edge of the dead zone casts a shadow behind it, producing cold regions of at – around a Herbig-type star.
One potential mechanism of the shadowing onto the current Jupiter orbit is a dust pileup at the H2O snow line. The dust surface density inside the H2O snow line can be enhanced by orders of magnitude because efficient fragmentation slows the radial drift of silicate grains (Birnstiel et al., 2010; Banzatti et al., 2015; Pinilla et al., 2017). With high surface density and scale height, such fragmented dust may cast a shadow behind the H2O snow line and provide cold regions where volatile substances can freeze. The primary purpose of this letter is to investigate how cold this shadowed region is and what kinds of volatile gases can freeze there.
2.2 Numerical model
We adopted a parameterized disk model in which the dust surface density steeply varies around the H2O snow line, described by
| (1) |
| (2) |
where is the gas surface density, is the surface density of the small dust (i.e., ) contributing to the opacity, and is the radial location of the H2O snow line set to . We varied the parameter to examine the effects of the dust pileup magnitude. The actual value of depends on how easily the fragmentation of silicate and icy grains takes place, which is controlled by the turbulence strength and stickiness of the grains (Birnstiel et al., 2010; Banzatti et al., 2015; Pinilla et al., 2017). For example, Banzatti et al. (2015) reported the surface density variations of , , and around the H2O snow line for the turbulence strengths of , , and , respectively.
With the radial density profile, we calculated the temperature structure of the shadowed region using the Monte Carlo radiative transfer code RADMC-3D (Dullemond et al., 2012). Since the vertical dust distribution and the temperature structure are mutually dependent, the radiative transfer calculations were iteratively performed to obtain the self-consistent disk structure (Ueda et al., 2019). The simulations also included the internal energy released by the disk accretion with a form of with , where is the gas density, is the sound speed, and is the Keplerian frequency. We adopted the DSHARP dust opacity model with the minimum and maximum dust radii of and (Birnstiel et al. 2018; see also Henning & Stognienko 1996; Draine 2003; Warren & Brandt 2008).
Using the computed temperature structure, we estimated the mid-plane volatile abundances in gas and solid phases at each orbital distance by balancing condensation and sublimation rates (Appendix B). Following Öberg & Wordsworth (2019), we performed the calculation for H2O, CO2, CO, C2H6, N2, NH3, Ar, Kr, and Xe based on the up-to-date protosolar abundances in Asplund et al. (2021). We then estimated the elemental abundance of the Jovian atmosphere, , using volatile abundances of gas and solids at , as (see Appendix B.2)
| (3) |
where is the mass fraction of volatiles dissolved in the envelope, and are the mean atomic mass and hydrogen fraction of solar composition gases, and are the total and gas-phase number density of molecules for species i, is the surface number density of the molecules adsorbed onto dust, and is the mean molecular mass of the dissolved volatiles. We used sulfur to evaluate since most sulfur likely exists as refractory solids (Kama et al., 2019). We adjusted so that the S abundance matches the observed S abundance of Jupiter and then calculated other elemental abundances. We also estimated the atmospheric composition of Saturn from solid- and gas-phase volatile abundances at using the same procedure.
3 Results
3.1 Mid-plane temperature in a shadowed disk
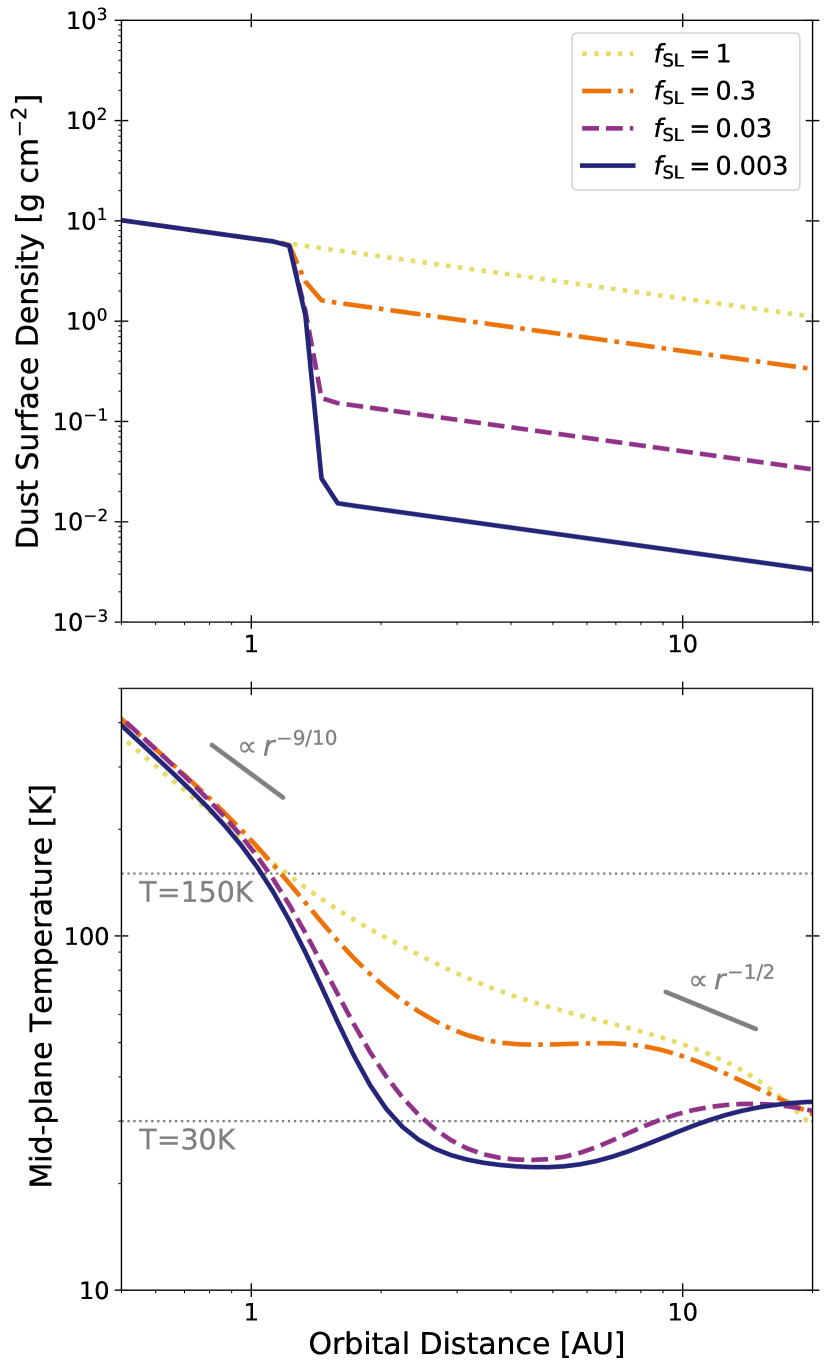
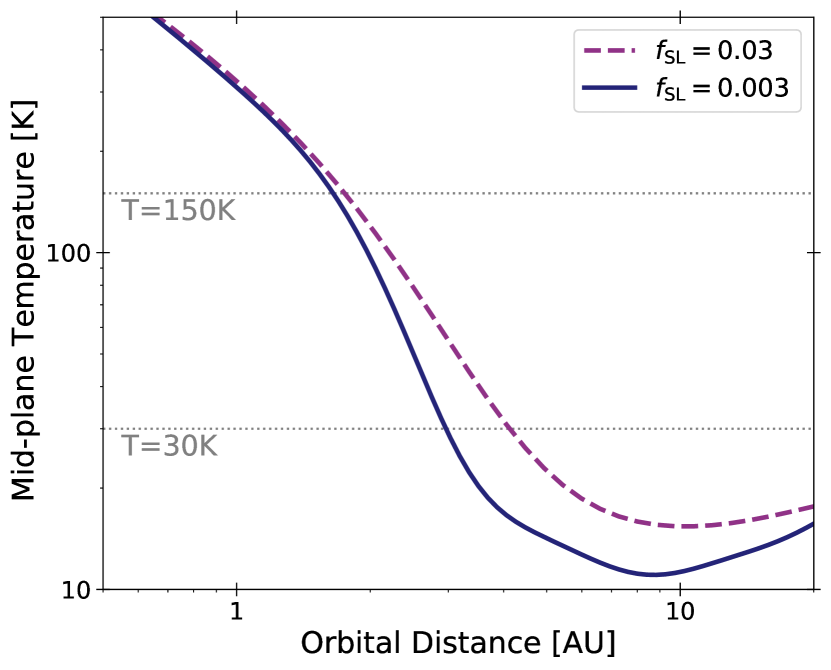
Figure 1 shows the mid-plane temperature for different . In general, the temperature inside the H2O snow line is independent of and is primarily controlled by viscous heating, yielding the radial dependence of (e.g., Oka et al., 2011). The temperature structures with different converge to a similar flared disk solution of at (Kenyon & Hartmann, 1987), implying that these regions are directly irradiated by sunlight.
The dust pileup at the H2O snow line drastically alters the mid-plane temperature at – owing to shadow formation. The temperature at – decreases with decreasing , as the shadow extends to more outer regions. Even a small change in dust surface density with causes the cooling of from a non-shadowed disk with . Remarkably, the shadow cools the vicinity of the current Jupiter orbit, –, to for . Although the dust-to-gas mass ratio inside the H2O snow line may be higher than that assumed here, especially in the young disks of (e.g., Birnstiel et al., 2010), we have confirmed that the shadow can still cool the Jupiter orbit to in that case (Appendix C).
3.2 Radial volatile distributions
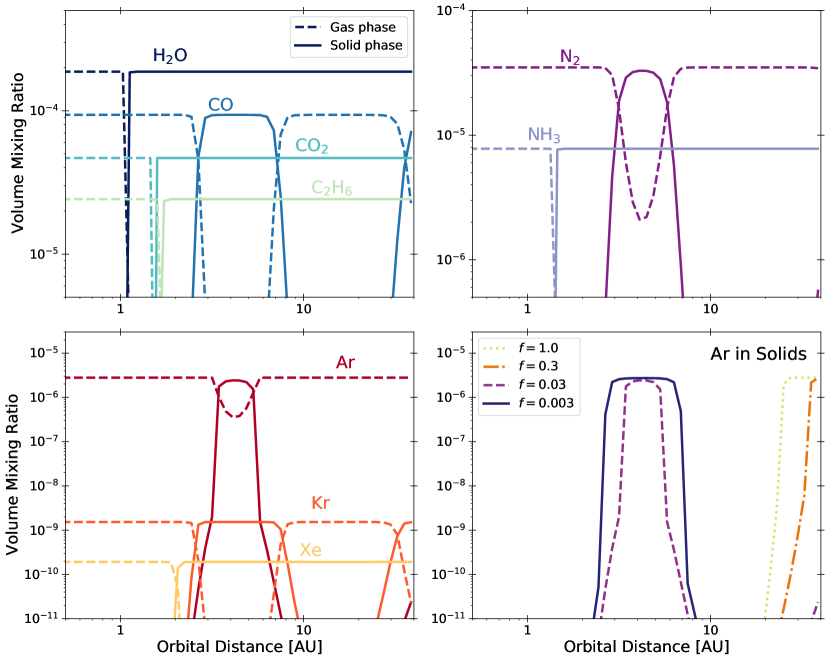
Most volatile substances freeze in the cold shadowed regions. Figure 2 shows the radial distributions of volatile abundances in solids and gases for . In the shadowed disk, CO2, C2H6, and NH3 have snow lines at nearly the same orbit, . These crowded snow lines originate from the steep temperature gradient in the shadow right behind the H2O snow line. CO, N2, Ar, and Kr exhibit intriguing orbital distributions: They freeze into solids at – but return to gas phases at . These volatile distributions are significantly different from conventional non-shadowed disks (e.g., Öberg et al., 2011; Öberg & Wordsworth, 2019).
The magnitude of the dust pileup at the H2O snow line determines if volatile substances can freeze in shadowed regions. The bottom right panel of Fig. 2 shows the solid-phase abundance of Ar, the most volatile substance in our model. For and , Ar only freezes at outer regions of . On the other hand, Ar freezes in solids at – for and at – for . Thus, highly volatile substances can freeze even at the current Jupiter orbit if the small-dust surface density varies by a factor of across the H2O snow line.
3.3 Comparison with Jovian atmospheric composition
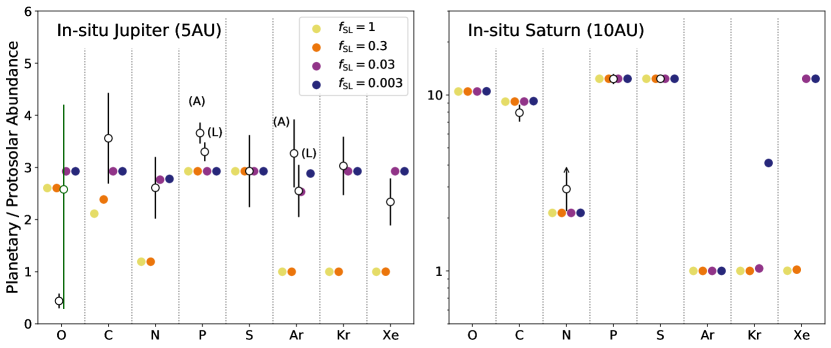
Figure 3 compares the estimated elemental abundances of the Jovian atmosphere with those constrained by observations. In weakly shadowed disks of , N and noble gases have almost protosolar abundances as they are still present in gas phases at , inconsistent with the observations. On the other hand, N and noble gases can be enriched as much as other elements for as the cold shadowed regions cause the condensation of and noble gases at . The estimated dissolved volatile mass is for , equivalent to if we approximate . This is well below the total heavy element mass of –, the upper limit allowed for dissolved volatile mass, constrained by JUNO (Wahl et al., 2017; Ni, 2019). The estimated abundance pattern explains the uniform enrichment observed in the Jovian atmosphere well.
In our shadow scenario, Saturn, in contrast to Jupiter, may not undergo the uniform enrichment. This is because Saturn’s orbit is near the outer edge of the shadowed regions; this area is too warm to allow the condensation of and noble gases, although this depends on the gas and dust disk properties. As a result, N and Ar abundances become significantly lower than the others. The estimated elemental abundances explain the C, N, P, and S abundances of Saturn well, although the N, P, and S abundances are still uncertain (see Atreya et al., 2018). A possible depletion of N and noble gases is intriguing because other uniform enrichment scenarios, such as the accretion of volatile-enriched disk gases (e.g., Guillot & Hueso, 2006; Monga & Desch, 2015; Ali-Dib, 2017; Mousis et al., 2019), would likely result in the uniform enrichment on Saturn being similar to that on Jupiter. Since noble gas abundances can only be constrained by in situ measurements, future entry probe missions on Saturn (Mousis et al., 2016; Simon et al., 2018) would help to distinguish the shadow scenario from other scenarios.
4 Discussion
4.1 Implications for Jupiter formation
There are two possible pathways to incorporate shadowed solids into the Jovian atmosphere: core dissolution and solid accretion after envelope formation. In the former case, the shadow scenario suggests that the Jovian core may form near the current orbit via planetesimal (e.g., Pollack et al., 1996; Inaba et al., 2003; Kobayashi & Tanaka, 2018) and/or pebble accretion (e.g., Lambrechts & Johansen, 2012; Lambrechts et al., 2014). The upward mixing of the dissolved core could enrich the envelope if primordial composition gradients exist (Guillot et al., 2004; Vazan et al., 2018). The JUNO observations do suggest the presence of a dissolved core (Wahl et al., 2017; Ni, 2019). In the latter case, the core could be formed elsewhere. Based on isotopes in meteorites, Alibert et al. (2018) suggested that substantial planetesimal accretion occurred on Jupiter during the envelope accretion. Conversely, the capture of planetesimals is inefficient for gap-opening Jupiter, and an enhanced surface density of planetesimals may have been needed to achieve sufficient enrichment (Shibata & Ikoma, 2019). It is vital to understand how many planetesimals form in the shadowed regions.
4.2 Implications from disk observations
Recent observations of protoplanetary disks have shown that shadow-like structures are common in scattered light images (Avenhaus et al., 2018; Garufi et al., 2018). The origin of these structures is still unclear, but most of them are observed at the outer region (10 AU) and hence would not be related to the H2O snow line. Due to the limited angular resolution and the bright emission coming directly from the central star, it is still challenging to constrain the disk surface structure within 10 AU. However, the prevalence of the shadow on the disk surface implies that the disk temperature no longer follows the simple power-law profile.
Interestingly, recent multiwavelength studies of the Atacama Large Millimeter/submillimeter Array (ALMA) have shown that ring and gap structures reside even in the optically thick region (Carrasco-González et al. 2019; Macías et al. 2021). This implies that the substructures are induced by the temperature variation and/or intensity reduction from scattering (e.g., Liu 2019; Zhu et al. 2019; Sierra & Lizano 2020; Ueda et al. 2020), not by the density variation. For example, the HL Tau disk has a gap at 13 AU at the wavelength where the region is expected to be optically thick (Carrasco-González et al., 2019). This gap might be linked with a shadow cast by the H2O snow line, which is expected to be located at 10 AU. However, the dust size in the inner region of the HL Tau disk is unlikely to be smaller than that at 10 AU (Carrasco-González et al. 2019; Ueda et al. 2021). To precisely estimate the dust size and the disk temperature, multiwavelength millimeter observations with more than four wavelengths are needed, which have only been conducted for a few disks. The future multiwavelength ALMA observations would tell us if the gap is associated with the shadow.
4.3 Diagnostic ratios for exoplanet observations
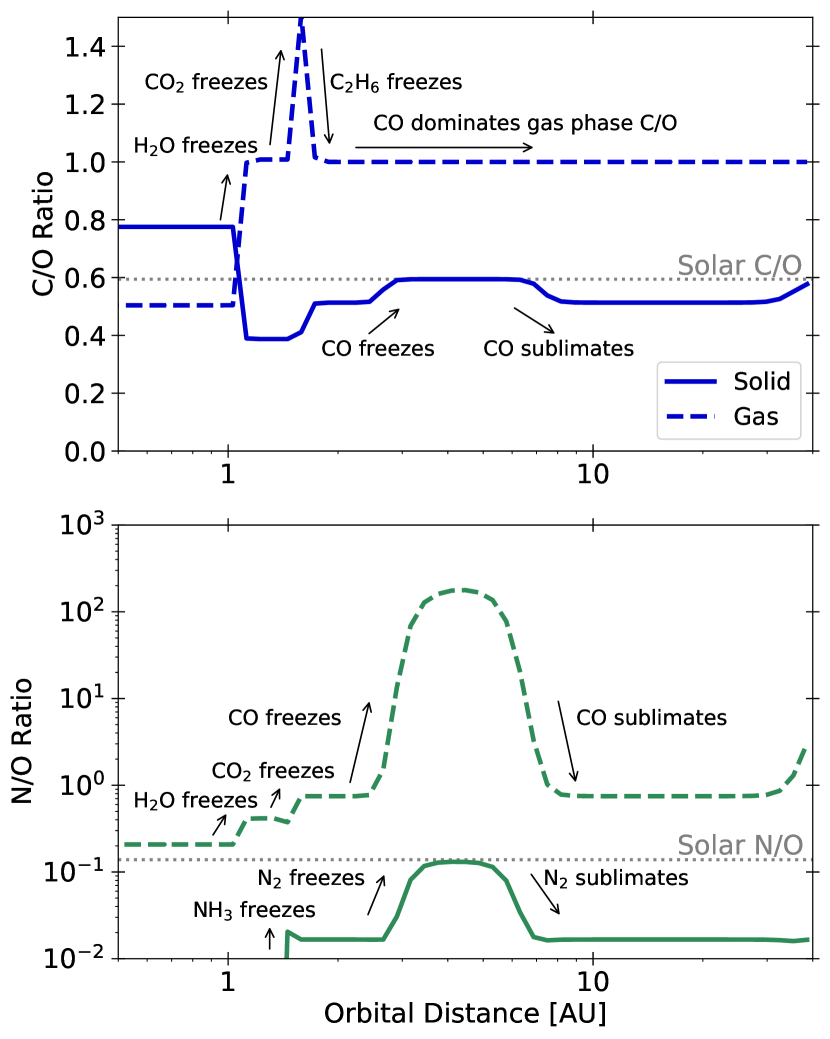
It is generally expected that the C/O ratios of exoplanetary atmospheres are linked to the compositions of protoplanetary disks (e.g., Öberg et al., 2011; Madhusudhan et al., 2014; Mordasini et al., 2016; Booth et al., 2017; Cridland et al., 2020; Notsu et al., 2020; Miley et al., 2021). In shadowed disks, the solid C/O ratio reaches the solar value in shadowed regions, similar to the outer disk (Fig. 4). The gas C/O ratio is almost unity at because CO accommodates most of the gas-phase C and O there. Thus, planets formed in the shadowed regions would have atmospheres with C/O ratios similar to those formed in the outer parts of protoplanetary disks.
It is worth noting that the N/O ratio shows a spatial variation that is much larger than that of the C/O ratio (Fig. 4). The solid N/O ratio reaches a solar value in the shadowed region as all N and O reservoirs freeze. Interestingly, the gas N/O ratio exceeds unity in the shadowed region because N2 has a desorption energy lower than that of CO, leading to a higher N2 vapor abundance. Thus, the planets formed in the shadow would have atmospheres with solar N/O and super-solar metallicity (the case of Jupiter) or N/O and sub-solar metallicity. Exoplanetary nitrogen abundances can be constrained by the observations of NH3 and HCN (MacDonald & Madhusudhan, 2017a, b). These molecules would be detectable by the upcoming observations of the James Webb Space Telescope (JWST).
5 Summary
The disk shadow may significantly affect disk temperature structures and planetary compositions. If the dust surface density varies by a factor of (i.e., ) across the H2O snow line, the vicinity of the current Jupiter orbit could be shadowed and as cold as . We have demonstrated that the uniformly enriched Jovian atmosphere could be explained if the Jovian core was formed in the shadowed regions or if the envelope experienced shadowed solid dissolution. The required condition of was observed for in previous grain growth simulations that assumed the fragmentation velocity to be and for silicate and H2O ice grains (Birnstiel et al., 2010; Banzatti et al., 2015; Pinilla et al., 2017). Such a weak turbulence may be compatible with recent ALMA observations of several protoplanetary disks (e.g., Pinte et al., 2016; van Boekel et al., 2017; Flaherty et al., 2020). The past cold environment can be compatible with ammoniated rocks discovered on several Jupiter Trojan asteroids, Jupiter-family comets, and (1) Ceres (de Sanctis et al., 2015; Brown, 2016; Poch et al., 2020). Although these indications of cold environments can be explained by the dynamical scattering of objects from the outer Solar System (e.g., Morbidelli et al., 2005), the shadow scenario might provide an alternative explanation.
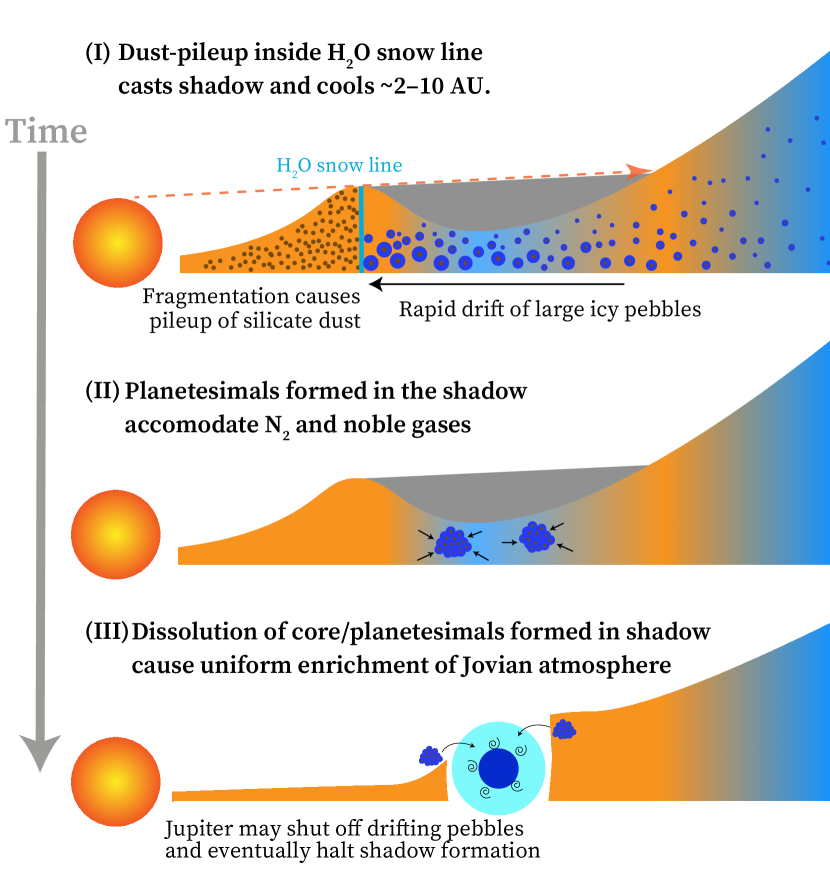
Figure 5 schematically summarizes our shadow scenario. In reality, since the location of the H2O snow line evolves over time (e.g., Garaud & Lin, 2007; Oka et al., 2011; Dr\każkowska & Dullemond, 2018; Mori et al., 2021), the shadow location would evolve as well. The shadow may also disappear once Jupiter opens up a gap and shuts off drifting pebbles (Morbidelli et al., 2016). Further modeling on time-evolving disks with the shadow is warranted to understand how the shadow impacts planetary formation and compositions, which will be the subjects of our future studies.
Acknowledgements
We are grateful to the referee, Alexander Cridland, for insightful comments that greatly improved the quality of this paper. We also thank Jonathan Fortney for helpful suggestions on the paper draft, Mario Flock for insightful comments on the numerical models, and Satoshi Okuzumi, Shota Notsu, and Hideko Nomura for fruitful conversations. K.O. is supported by JSPS KAKENHI Grant Numbers JP19K03926 and JSPS Oversears Research Fellowship. T.U. is supported by JSPS KAKENHI Grant Numbers JP19J01929. Numerical computations were in part carried out on Cray XC50 at Center for Computational Astrophysics, National Astronomical Observatory of Japan.
References
- Ali-Dib (2017) Ali-Dib, M. 2017, MNRAS, 464, 4282
- Alibert et al. (2005) Alibert, Y., Mousis, O., Mordasini, C., & Benz, W. 2005, ApJ, 626, L57
- Alibert et al. (2018) Alibert, Y., Venturini, J., Helled, R., et al. 2018, Nature Astronomy, 2, 873
- Asplund et al. (2021) Asplund, M., Amarsi, A. M., & Grevesse, N. 2021, arXiv e-prints, arXiv:2105.01661
- Atreya et al. (2018) Atreya, S. K., Crida, A., Guillot, T., et al. 2018, The Origin and Evolution of Saturn, with Exoplanet Perspective, ed. K. H. Baines, F. M. Flasar, N. Krupp, & T. Stallard, Cambridge Planetary Science (Cambridge University Press), 5–43
- Atreya et al. (2020) Atreya, S. K., Hofstadter, M. H., In, J. H., et al. 2020, Space Sci. Rev., 216, 18
- Avenhaus et al. (2018) Avenhaus, H., Quanz, S. P., Garufi, A., et al. 2018, ApJ, 863, 44
- Ayotte et al. (2001) Ayotte, P., Smith, R. S., Stevenson, K. P., et al. 2001, Journal of Geophysical Research: Planets, 106, 33387
- Banzatti et al. (2015) Banzatti, A., Pinilla, P., Ricci, L., et al. 2015, ApJ, 815, L15
- Behmard et al. (2019) Behmard, A., Fayolle, E. C., Graninger, D. M., et al. 2019, ApJ, 875, 73
- Birnstiel et al. (2010) Birnstiel, T., Dullemond, C. P., & Brauer, F. 2010, A&A, 513, A79
- Birnstiel et al. (2018) Birnstiel, T., Dullemond, C. P., Zhu, Z., et al. 2018, ApJ, 869, L45
- Bitsch et al. (2015) Bitsch, B., Johansen, A., Lambrechts, M., & Morbidelli, A. 2015, A&A, 575, A28
- Bitsch et al. (2019) Bitsch, B., Raymond, S. N., & Izidoro, A. 2019, A&A, 624, A109
- Bolton et al. (2017) Bolton, S. J., Adriani, A., Adumitroaie, V., et al. 2017, Science, 356, 821
- Booth et al. (2017) Booth, R. A., Clarke, C. J., Madhusudhan, N., & Ilee, J. D. 2017, MNRAS, 469, 3994
- Bosman et al. (2019) Bosman, A. D., Cridland, A. J., & Miguel, Y. 2019, A&A, 632, L11
- Brown (2016) Brown, M. E. 2016, AJ, 152, 159
- Carrasco-González et al. (2019) Carrasco-González, C., Sierra, A., Flock, M., et al. 2019, ApJ, 883, 71
- Collings et al. (2004) Collings, M. P., Anderson, M. A., Chen, R., et al. 2004, MNRAS, 354, 1133
- Collings et al. (2003) Collings, M. P., Dever, J. W., Fraser, H. J., & McCoustra, M. R. S. 2003, Ap&SS, 285, 633
- Cridland et al. (2020) Cridland, A. J., van Dishoeck, E. F., Alessi, M., & Pudritz, R. E. 2020, A&A, 642, A229
- de Sanctis et al. (2015) de Sanctis, M. C., Ammannito, E., Raponi, A., et al. 2015, Nature, 528, 241
- Draine (2003) Draine, B. T. 2003, ARA&A, 41, 241
- Dr\każkowska & Dullemond (2018) Dr\każkowska, J. & Dullemond, C. P. 2018, A&A, 614, A62
- Dullemond & Dominik (2004) Dullemond, C. P. & Dominik, C. 2004, A&A, 417, 159
- Dullemond et al. (2001) Dullemond, C. P., Dominik, C., & Natta, A. 2001, ApJ, 560, 957
- Dullemond et al. (2012) Dullemond, C. P., Juhasz, A., Pohl, A., et al. 2012, RADMC-3D: A multi-purpose radiative transfer tool, Astrophysics Source Code Library
- Fayolle et al. (2016) Fayolle, E. C., Balfe, J., Loomis, R., et al. 2016, ApJ, 816, L28
- Flaherty et al. (2020) Flaherty, K., Hughes, A. M., Simon, J. B., et al. 2020, ApJ, 895, 109
- Fletcher et al. (2009) Fletcher, L. N., Orton, G. S., Teanby, N. A., & Irwin, P. G. J. 2009, Icarus, 202, 543
- Fraser et al. (2001) Fraser, H. J., Collings, M. P., McCoustra, M. R. S., & Williams, D. A. 2001, MNRAS, 327, 1165
- Fray & Schmitt (2009) Fray, N. & Schmitt, B. 2009, Planet. Space Sci., 57, 2053
- Garaud & Lin (2007) Garaud, P. & Lin, D. N. C. 2007, ApJ, 654, 606
- Garufi et al. (2018) Garufi, A., Benisty, M., Pinilla, P., et al. 2018, A&A, 620, A94
- Garufi et al. (2017) Garufi, A., Meeus, G., Benisty, M., et al. 2017, A&A, 603, A21
- Guillot & Hueso (2006) Guillot, T. & Hueso, R. 2006, MNRAS, 367, L47
- Guillot et al. (2004) Guillot, T., Stevenson, D. J., Hubbard, W. B., & Saumon, D. 2004, The interior of Jupiter, ed. F. Bagenal, T. E. Dowling, & W. B. McKinnon, Vol. 1, 35–57
- He et al. (2016) He, J., Acharyya, K., & Vidali, G. 2016, ApJ, 825, 89
- Henning & Stognienko (1996) Henning, T. & Stognienko, R. 1996, A&A, 311, 291
- Hori & Ikoma (2011) Hori, Y. & Ikoma, M. 2011, MNRAS, 416, 1419
- Iaroslavitz & Podolak (2007) Iaroslavitz, E. & Podolak, M. 2007, Icarus, 187, 600
- Inaba et al. (2003) Inaba, S., Wetherill, G. W., & Ikoma, M. 2003, Icarus, 166, 46
- Kama et al. (2019) Kama, M., Shorttle, O., Jermyn, A. S., et al. 2019, ApJ, 885, 114
- Kenyon & Hartmann (1987) Kenyon, S. J. & Hartmann, L. 1987, ApJ, 323, 714
- Kobayashi & Tanaka (2018) Kobayashi, H. & Tanaka, H. 2018, ApJ, 862, 127
- Kruijer et al. (2017) Kruijer, T. S., Burkhardt, C., Budde, G., & Kleine, T. 2017, Proceedings of the National Academy of Science, 114, 6712
- Kruijer et al. (2020) Kruijer, T. S., Kleine, T., & Borg, L. E. 2020, Nature Astronomy, 4, 32
- Lambrechts & Johansen (2012) Lambrechts, M. & Johansen, A. 2012, A&A, 544, A32
- Lambrechts et al. (2014) Lambrechts, M., Johansen, A., & Morbidelli, A. 2014, A&A, 572, A35
- Li et al. (2020) Li, C., Ingersoll, A., Bolton, S., et al. 2020, Nature Astronomy, 4, 609
- Liu (2019) Liu, H. B. 2019, ApJ, 877, L22
- Lodders et al. (2009) Lodders, K., Palme, H., & Gail, H. P. 2009, Landolt Börnstein, 4B, 712
- MacDonald & Madhusudhan (2017a) MacDonald, R. J. & Madhusudhan, N. 2017a, MNRAS, 469, 1979
- MacDonald & Madhusudhan (2017b) MacDonald, R. J. & Madhusudhan, N. 2017b, MNRAS, 469, 1979
- Macías et al. (2021) Macías, E., Guerra-Alvarado, O., Carrasco-González, C., et al. 2021, A&A, 648, A33
- Madhusudhan et al. (2014) Madhusudhan, N., Amin, M. A., & Kennedy, G. M. 2014, ApJ, 794, L12
- Mahaffy et al. (2000) Mahaffy, P. R., Niemann, H. B., Alpert, A., et al. 2000, J. Geophys. Res., 105, 15061
- Miley et al. (2021) Miley, J. M., Panić, O., Booth, R. A., et al. 2021, MNRAS, 500, 4658
- Moll et al. (2017) Moll, R., Garaud, P., Mankovich, C., & Fortney, J. J. 2017, ApJ, 849, 24
- Monga & Desch (2015) Monga, N. & Desch, S. 2015, ApJ, 798, 9
- Morbidelli et al. (2016) Morbidelli, A., Bitsch, B., Crida, A., et al. 2016, Icarus, 267, 368
- Morbidelli et al. (2005) Morbidelli, A., Levison, H. F., Tsiganis, K., & Gomes, R. 2005, Nature, 435, 462
- Mordasini et al. (2016) Mordasini, C., van Boekel, R., Mollière, P., Henning, T., & Benneke, B. 2016, ApJ, 832, 41
- Mori et al. (2019) Mori, S., Bai, X.-N., & Okuzumi, S. 2019, ApJ, 872, 98
- Mori et al. (2021) Mori, S., Okuzumi, S., Kunitomo, M., & Bai, X.-N. 2021, arXiv e-prints, arXiv:2105.13101
- Mousis et al. (2016) Mousis, O., Atkinson, D. H., Spilker, T., et al. 2016, Planet. Space Sci., 130, 80
- Mousis et al. (2019) Mousis, O., Ronnet, T., & Lunine, J. I. 2019, ApJ, 875, 9
- Ni (2019) Ni, D. 2019, A&A, 632, A76
- Noble et al. (2012) Noble, J. A., Congiu, E., Dulieu, F., & Fraser, H. J. 2012, MNRAS, 421, 768
- Notsu et al. (2020) Notsu, S., Eistrup, C., Walsh, C., & Nomura, H. 2020, MNRAS, 499, 2229
- Öberg et al. (2011) Öberg, K. I., Murray-Clay, R., & Bergin, E. A. 2011, ApJ, 743, L16
- Öberg & Wordsworth (2019) Öberg, K. I. & Wordsworth, R. 2019, AJ, 158, 194
- Oka et al. (2011) Oka, A., Nakamoto, T., & Ida, S. 2011, ApJ, 738, 141
- Owen et al. (1999) Owen, T., Mahaffy, P., Niemann, H. B., et al. 1999, Nature, 402, 269
- Penteado et al. (2017) Penteado, E. M., Walsh, C., & Cuppen, H. M. 2017, ApJ, 844, 71
- Pinilla et al. (2017) Pinilla, P., Pohl, A., Stammler, S. M., & Birnstiel, T. 2017, ApJ, 845, 68
- Pinte et al. (2016) Pinte, C., Dent, W. R. F., Ménard, F., et al. 2016, ApJ, 816, 25
- Poch et al. (2020) Poch, O., Istiqomah, I., Quirico, E., et al. 2020, Science, 367, aaw7462
- Pollack et al. (1996) Pollack, J. B., Hubickyj, O., Bodenheimer, P., et al. 1996, Icarus, 124, 62
- Pollack et al. (1986) Pollack, J. B., Podolak, M., Bodenheimer, P., & Christofferson, B. 1986, Icarus, 67, 409
- Pruppacher & Klett (1996) Pruppacher, H. & Klett, J. 1996, Microphysics of Clouds and Precipitation, Atmospheric and Oceanographic Sciences Library (Springer Netherlands)
- Shibata & Ikoma (2019) Shibata, S. & Ikoma, M. 2019, MNRAS, 487, 4510
- Sierra & Lizano (2020) Sierra, A. & Lizano, S. 2020, ApJ, 892, 136
- Simon et al. (2018) Simon, A., Banfield, D., Atkinson, D., & SPRITE Science Team. 2018, in American Astronomical Society Meeting Abstracts, Vol. 231, American Astronomical Society Meeting Abstracts #231, 144.01
- Smith et al. (2016) Smith, R. S., May, R. A., & Kay, B. D. 2016, The Journal of Physical Chemistry B, 120, 1979
- Tielens (2005) Tielens, A. G. G. M. 2005, The Physics and Chemistry of the Interstellar Medium
- Ueda et al. (2019) Ueda, T., Flock, M., & Okuzumi, S. 2019, ApJ, 871, 10
- Ueda et al. (2020) Ueda, T., Kataoka, A., & Tsukagoshi, T. 2020, ApJ, 893, 125
- Ueda et al. (2021) Ueda, T., Kataoka, A., Zhang, S., et al. 2021, ApJ, 913, 117
- van Boekel et al. (2017) van Boekel, R., Henning, T., Menu, J., et al. 2017, ApJ, 837, 132
- Vazan et al. (2018) Vazan, A., Helled, R., & Guillot, T. 2018, A&A, 610, L14
- Venturini et al. (2016) Venturini, J., Alibert, Y., & Benz, W. 2016, A&A, 596, A90
- Wahl et al. (2017) Wahl, S. M., Hubbard, W. B., Militzer, B., et al. 2017, Geochim. Res. Lett., 44, 4649
- Warren & Brandt (2008) Warren, S. G. & Brandt, R. E. 2008, Journal of Geophysical Research (Atmospheres), 113, D14220
- Wong et al. (2004) Wong, M. H., Mahaffy, P. R., Atreya, S. K., Niemann, H. B., & Owen, T. C. 2004, Icarus, 171, 153
- Zhu et al. (2019) Zhu, Z., Zhang, S., Jiang, Y.-F., et al. 2019, ApJ, 877, L18
Appendix A Elemental abundances
Recently, Asplund et al. (2021) provided new recommended compositions of the protosun, which we have adopted in this study. Table 1 summarizes the up-to-date elemental abundances of the protosun along with the abundances of Jupiter and Saturn normalized by them. We note that the protosolar abundances are higher than the photospheric abundances of the current Sun (see Sect. 5 of Asplund et al. 2021).
Appendix B Condensation model
B.1 Model description
Here we describe the condensation model we used for evaluating volatile distributions. The abundances can be evaluated by equating condensation and sublimation rates (e.g., Öberg & Wordsworth 2019). The former is given by
| (4) |
where is the total grain surface area per unit volume calculated from the dust size distribution used in the radiative transfer model, is the number density of gas-phase atoms or molecules, and and are the mean thermal velocity and mass of species i atoms or molecules, respectively. We note that the gas-phase number density is associated with the total number density, , as
| (5) |
where is molecular or atomic surface number density on grain surfaces.
The sublimation behavior depends on how much the molecules or atoms are adsorbed onto the grain surface. In a low surface density regime where all adsorbed particles are exposed, the sublimation rate is proportional to the surface density, so-called first-order desorption (e.g., Collings et al. 2003). As the surface density increases, two factors affect the sublimation rate. The first is that only particles in a few of the uppermost molecular or atomic layers can directly desorb from the grain surface, leading to the upper limit of “desorption active” surface density to be set at (e.g., Collings et al. 2003). The second is that the desorption energy decreases with increasing surface coverage of molecules or atoms owing to the increased number of particles weakly bound on the surface (Fayolle et al. 2016; He et al. 2016). In the limit of the high surface density of adsorbed molecules or atoms, one can expect that the sublimation rate eventually approaches the rate of pure ice, which has been studied in the context of cloud microphysics in planetary atmospheres (e.g., Pruppacher & Klett 1996).
Based on this consideration, we modeled the sublimation rate as
| (6) |
where and are the desorption energy and attempt frequency of particles adsorbed onto grains and is the vapor pressure. Equation (6) returns to the first-order desorption rate at low (e.g., Collings et al. 2003) and ensures that the sublimation rate approaches that of pure ice in the limit of high (e.g., Pruppacher & Klett 1996). The vapor pressure of each substance is taken from Fray & Schmitt (2009).
Our condensation model assumes that the dust and gas share the same temperature, which is mostly valid at the dense disk mid-plane. In the disk mid-plane, which the high-energy stellar photons hardly penetrate, gas particles tend to have lower temperatures than dust. The gas heating rate by collisions with dust is given by (e.g., Tielens 2005)
| (7) |
where is the mean mass of gas particles, is the specific heat capacity, is the mean cross section of dust, is the mean thermal velocity, is the accommodation coefficient, and are the number densities of gas and dust, and and are the dust and gas temperatures. The timescale with which the gas temperature is relaxed to the dust temperature, , is given by
| (8) | |||||
We used and , where is the adiabatic index for diatomic gases, is the dust internal density, is the Kepler frequency, and is the dust-to-gas mass ratio. We assumed and the solar mass. The lowest dust-to-gas mass ratio is in this study. Even in this case, the relaxing timescale is , still much shorter than the timescale of disk evolution.
| Species | a | b | |
|---|---|---|---|
| H2O | |||
| CO | |||
| CO2 | |||
| C2H6 | |||
| N2 | |||
| NH3 | |||
| Ar | |||
| Kr | |||
| Xe | |||
| O in refractory solids | – | – | |
| C in refractory solids | – | – | |
| S in refractory solids | – | – | |
| P in refractory solids | – | – |
- a
-
b
Desorption energy on compact amorphous water ice: CO and N2from Fayolle et al. (2016), CO2 from Noble et al. (2012), C2H6 from Behmard et al. (2019), NH3 from Penteado et al. (2017) after Collings et al. (2004), and noble gases from Smith et al. (2016). For H2O, we adopt the desorption energy from a gold film (Fraser et al. 2001).
B.2 Atmospheric composition estimation
We estimated the atmospheric elemental abundances of Jupiter and Saturn by summing up disk gas and solid contributions. Let denote the total number of a species i element in the envelope. The total number can be written as
| (9) |
where is the total number of hydrogen atoms in the envelope and is the mass mixing ratio of the species i element in dissolved solids. We have reasonably assumed that hydrogen comes mostly from disk gases. Using the envelope mass of , where is the total number of helium atoms in the envelope, we obtain Eq. (3) as
| (10) | |||||
where is the mean mass of the hydrogen-helium mixture and is the mean mass of the dissolved volatiles.
B.3 Material properties
Table 2 summarizes the total abundances, desorption energy, and desorption attempt frequency of the atoms and molecules considered in this study. We determined each volatile abundance following the procedure from Öberg & Wordsworth (2019) that is motivated by the composition of the interstellar medium. We set the absolute abundances so that they sum up to the protosolar abundance recommended by Asplund et al. (2021), as summarized in Table 1. We partitioned oxygen into refractory silicates (33.33%), H2O (33.33%), CO (16.67%), and CO2 (8.33%). The above estimated CO and CO2 abundances comprise about 45% of the total carbon abundance. We partitioned the remaining carbons into volatile organics (25%) and refractory organics (75%), where the volatile organics are represented by C2H6, as in Öberg & Wordsworth (2019). Nitrogen was partitioned into N2 (90%) and NH3 (10%). The total abundances of Ar, Kr, and Xe are the same as the protosolar abundances. We partitioned all S and P into refractory solids. The actual abundance of each element reservoir is uncertain, as noted by Öberg & Wordsworth (2019). However, the detail of each abundance hardly affects the conclusions of this study as all elements are eventually frozen into solids when the disk is so cold that N2 and Ar can freeze.
We adopted the desorption energy for the atoms and molecules adsorbed onto compact amorphous water ices as H2O is the most abundant ice. We used the simultaneously measured attempt frequency, , if available; otherwise, we adopted a conventionally used value of (e.g., Penteado et al. 2017). The desorption energy is potentially higher than that assumed here if the amorphous water ices have porous structures in cold environments (e.g., Ayotte et al. 2001; Fayolle et al. 2016). In that case, the shadow would further expand the regions where highly volatile substances can freeze.
Appendix C Mid-plane temperature of dust-rich disks
While we have assumed the dust-to-gas mass ratio of inside the H2O snow line, the ratio is likely higher in the younger disks that may be more relevant to the formation of Jupiter. Figure 6 shows the disk mid-plane temperature for the higher dust surface density of
| (11) |
Here we conducted the calculations only for and 0.03. It should be noted that should be less than 0.1; otherwise, the dust-to-gas mass ratio of the whole disk exceeds the interstellar value of 0.01. Figure 6 shows that the shadow cools the vicinity of the current Jupiter orbit to even in the young dust-rich disks. Thus, we expect that the shadow scenario still holds for relatively young disks. We note that the snow line moves outward as the dust surface density inside the H2O snow line increases. In Fig. 6, we adopt instead of to keep the snow line at . The actual location of the H2O snow line depends on the gas and dust disk properties (Oka et al. 2011; Dr\każkowska & Dullemond 2018) as well as the accretion mechanism (Mori et al. 2019, 2021). Therefore, comprehensive parameter studies would be necessary to further understand the shadowing effects on forming giant planets.