AMA-GCN: Adaptive Multi-layer Aggregation Graph Convolutional Network for Disease Prediction
Abstract
Recently, Graph Convolutional Networks (GCNs) have proven to be a powerful mean for Computer Aided Diagnosis (CADx). This approach requires building a population graph to aggregate structural information, where the graph adjacency matrix represents the relationship between nodes. Until now, this adjacency matrix is usually defined manually based on phenotypic information. In this paper, we propose an encoder that automatically selects the appropriate phenotypic measures according to their spatial distribution, and uses the text similarity awareness mechanism to calculate the edge weights between nodes. The encoder can automatically construct the population graph using phenotypic measures which have a positive impact on the final results, and further realizes the fusion of multimodal information. In addition, a novel graph convolution network architecture using multi-layer aggregation mechanism is proposed. The structure can obtain deep structure information while suppressing over-smooth, and increase the similarity between the same type of nodes. Experimental results on two databases show that our method can significantly improve the diagnostic accuracy for Autism spectrum disorder and breast cancer, indicating its universality in leveraging multimodal data for disease prediction.
1 Introduction
There is a growing body of researchers that have realized the potential for graph convolutional networks in medical-related fields. Recently, GCNs have been widely used to solve a variety of medical problems already, including localization of landmarks in craniomaxillofacial Lang et al. (2020), bone age assessment Gong et al. (2020), representation learning for medical fMRI images Gadgil et al. (2020) and so on. In this work, we focus on Computer Aided Diagnosis (CADx) Kazi et al. (2019b), which uses computer technology to assist physicians in disease prediction. At present, deep learning methods have been widely used in disease prediction tasks and achieve great results, but in order to further improve diagnostic accuracy, it is necessary to make full use of complex medical multimodal data to extract the effective information hidden in it. These data usually include medical imaging and corresponding non-imaging phenotypic measures (e.g. subject’s age, height, or acquisition site), which are usually non-Euclidean and difficult to be processed by traditional deep learning methods. Moreover, not every phenotypic measure is helpful for disease prediction and it is still a tedious and time-consuming task for people to select phenotypic measures that can have a positive effect on classification results.
Inspired by the success of GCNs in social network analysis and recommendation systems Bronstein et al. (2017), graph-based methods are usually used in multimodal data processing. At present, a large number of researchers have made great contributions to apply GCNs in CADx. At first, the population graph constructed by the features extracted from the multimodal data is used as the input of GCNs Sarah et al. (2018). However, the phenotypic measures selected in this method contribute the same to the edge weights, but should actually be different. Recently, there are two methods to solve this problem, which are multi-graph fusion methods Vivar et al. (2018); Kazi et al. (2019a, b) and single comprehensive graph methods Huang and Chung (2020). Although these methods deal with the phenotypic measures differently, they both assign appropriate weights to it. For example, Huang et al. propose that an encoder can be built to calculate the connection between nodes directly using multimodal data, and the only graph constructed in the end can be used as the input of GCNs.
Although the above two methods can achieve high accuracy for disease prediction, their common limitation is that there is still no effective method to screen out phenotypic measures that have a negative impact on classification results. Moreover, the parameter quantity of multi-graph fusion methods will become very large with the increase in phenotypic measures, which seriously affects the real-time performance of the model. In addition, although existing methods, such as the JK-GCN Xu et al. (2018) or EV-GCN Huang and Chung (2020), have tried to apply layer aggregation mechanism to GCNs to learn more structural information, due to the actual medical situation being too complex, it is still challenging to determine an appropriate aggregation strategy.
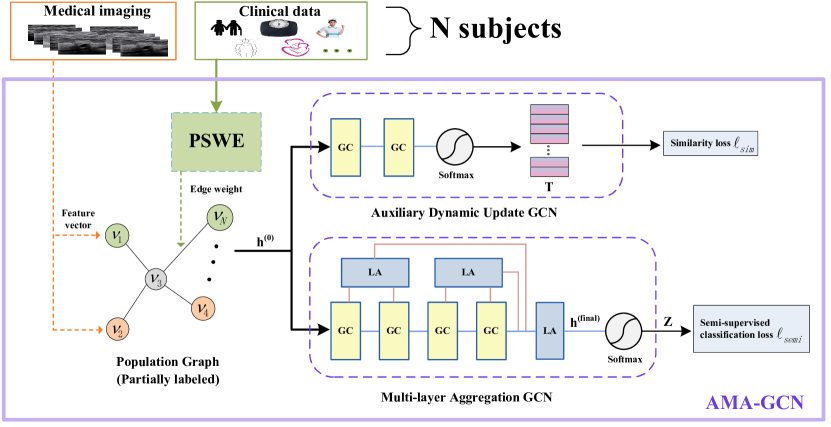
In order to address the above challenges, we present a new similarity-aware adaptive calibrated multi-layer aggregation GCN structure called Adaptive Multi-layer Aggregation GCN(AMA-GCN). As shown in Figure 1, this structure contains a specially designed encoder to select effective phenotypic measures and calculate the edge weights, namely phenotypic measure selection and weight encoder (PSWE). Besides, we propose two separately designed GCN models to aggregate the deep structural information and increase the similarity between different objects of the same type, respectively. This structure can improve the accuracy of the model and its robustness. The main contributions of our work can be summarized as follows:
-
•
We design PSWE to automatically select the best combination of phenotypic measures to interpret the similarity between subjects and calculate their scores.
-
•
A multi-layer aggregation graph convolutional network with multiple aggregation modes is introduced to consider more appropriate structural information for each node. And a dynamic updating mechanism is devised to increase the similarity between nodes of the same type.
-
•
We test AMA-GCN on real-world dataset. The results show that our method is superior to other models known at present in terms of validation set accuracy.
2 Related Work
In the past, disease classification based on deep learning was usually achieved using medical imaging. Recently, in order to further improve the classification accuracy, non-imaging phenotypic data has also been included in the research scope, that is, medical multimodal data.
2.1 Medical Imaging Based Approach
This method analyzes the medical imaging of patients from different perspectives, so as to obtain as many image features as possible to improve diagnostic accuracy. For example, MSE-GCN Yu et al. (2020) is proposed to extract temporal and spatial information respectively from fMRI and DTI to comprehensively analyze medical imaging. Zhang et al. have achieved great result performance for nodule-level malignancy prediction by using the transfer learning method Zhang et al. (2020). This method requires that the input data must be specific types of medical imaging, while the imaging methods of different diseases are usually diverse (e.g., ultrasound imaging for the breast and fMRI for the brain), which makes this method difficult to apply to the diagnosis of other diseases. Moreover, model learning only relies on medical imaging, and does not take into account the rich non-image phenotypic data, which does not conform to the diagnostic habits of professional doctors in the actual situation.
2.2 Multimodal Data Based Approach
In order to further improve the classification accuracy, researchers study patients’ non-imaging phenotypic data while studying medical imaging. This complex data is called multimodal data, which is usually non-Euclidean and difficult to be processed by traditional deep learning methods. At present, GCNs are usually used to process multimodal data in the medical field. This method needs to define the population graph where nodes represent patients, edges represent connections between patients, and edge weights represent similarity between patients. Specifically, phenotypic measures are usually used to calculate similarity between patients, and image features extracted from medical imaging are stored in the corresponding nodes. Furthermore, according to the different processing methods of phenotypic measures, GCNs methods can be divided into multi-graph fusion methods and single comprehensive graph methods. Multi-graph fusion methods usually construct graphs for each phenotypic measure and process them separately, and design different multi-graph fusion methods to assign weights to each phenotypic measure, such as RNN Vivar et al. (2018), self-attention Kazi et al. (2019a), or LSTM Kazi et al. (2019b). Single comprehensive graph methods directly extract features from the multimodal data to build a comprehensive graph as input. For example, Huang et al. Huang and Chung (2020) propose to use an encoder to process multimodal data. The above methods have achieved great results, but there are still some limitations: not every phenotypic measure has a positive effect on classification results. In fact, although our proposed method is also to build a single comprehensive graph to predict disease, it does not need to determine the appropriate phenotypic measures through a large number of experiments as in the past, but is automatically completed by the proposed encoder.
3 Methodology
3.1 Preliminaries
In our study, the population graph is defined as an undirected graph , where is the set of vertices and each vertex represents a patient; denotes the set of edges; denotes the adjacency matrix of population graph , whose elements are the edge weights. As shown in Figure 1, the adjacency matrix is obtained by using the proposed PSWE, which can automatically find the appropriate phenotypic measures and calculate the corresponding phenotypic measure selection scores (PMS-scores), and then calculate the edge weights. Note that traditional GCNs usually artificially select phenotypic measures.
The node feature matrix is also the input of our model. We define as , where denotes the number of samples, represents the dimension of the features. We select feature extracted from medical imaging of the two datasets involved in our experiment as the node information. For the ABIDE database, we use functional connectivity derived from resting-state functional Magnetic Resonance Imaging (rs-fMRI) for Autism Spectrum Disorder (ASD) classification. Rudie et al. Rudie et al. (2013) proposed that ASD is linked to disruptions in the functional and structural organization of the brain, Abraham et al. Abraham et al. (2016) further demonstrated this assertion. More accurately, we use the vectorized functional connectivity matrices as feature vectors. For our collection of breast cancer mass ultrasound image data, we use ResNet-50 to extract features of medical imaging and directly verify the performance of these features on ResNet-50 and Ridge classifier.
3.2 Phenotypic Measure Selection and Weight Encoder
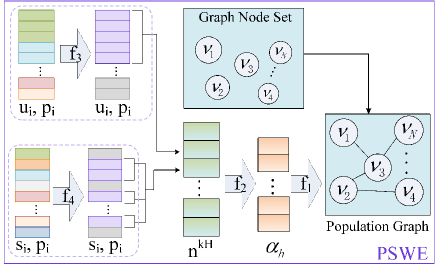
Edges are the channels through which the node filters information from its neighbors and represent relationships between nodes. Our hypothesis is that some appropriate non-imaging phenotypic data can provide critical information as complement to explain the associations between subjects. Therefore, selecting the best combination of phenotypic measures to interpret the similarity between subjects and assigning appropriate weights to them are the keys to our experiment. In our studies, it will be done by PSWE, and the implementation process of PSWE as shown in Figure 2.
Considering a set of non-imaging phenotypic measures , including quantitative (e.g. subject’s age, height, or BMI) and non-quantitative (e.g. subject’s calcification or capillary distribution) phenotypic measures. The population graph’s adjacency matrix is defined as follows:
| (1) |
where is the PMS-scores of phenotypic measure ; is a measure of the distance between the value of phenotypic measure of two graph nodes. is defined as follows:
| (2) |
where is a measure of the number of samples in which phenotypic measure meets the requirements, and it is defined differently depending on the type of phenotypic measures. When is a non-quantitative phenotypic measure (e.g. calcification or edema), we define as a function with respect to a threshold :
| (3) |
where is a measure of the number of samples with the value and category in the phenotypic measure ; is a measure of the number of samples with the value in the phenotypic measure . Meanwhile, when is a quantitative phenotypic measure (e.g. subject age or BMI), we define as a function with respect to a threshold :
| (4) |
where is a measure of the number of samples with the category in the phenotypic measure ; We define a closed interval from to , where , and is a measure of the number of samples with the category and value in the phenotypic measure .
is also defined differently depending on the type of phenotypic measure. For non-quantitative phenotypic measures such as family history, we define as the Kronecker delta function, meaning that the similarity highly between two subjects if their values of phenotypic measure are the same. For quantitative phenotypic measures such as subject’s age, we define as a function with respect to a closed interval from to , where :
| (5) | ||||
The influence of effective phenotypic measures selected by PSWE on the classification results will be investigated in our experiments, so as to visually demonstrate the performance of PSWE.
3.3 Model Structure Design
In order to make nodes from different dense blocks to obtain sufficient effective information on each layer while suppressing over-smooth, we reconstruct the architecture of the network with multi-layer aggregation mechanism so that the information from different layers can be adaptively fused into the final expression of the node. As shown in Figure 1, in order to get the key features of structural information, the first two aggregation layers that directly integrate the information from graph convolution layers are aggregated in the way of maxPooling. Besides, the final aggregation layer uses the way of concating to fully summary the information aggregated by each layer. The rebuilt model enables each node to automatically integrate the appropriate information.
The input graph data is processed by the above model, and the output is then calculated by the softmax activation function. The final output denotes the label prediction for all data in which each row denotes the label prediction for the node. The optimal weight matrices trained by minimizing the cross-entropy loss function as:
| (6) |
where indicates the set of labeled nodes. represents the label information of the data.
In addition, we introduce an auxiliary dynamic update GCN to increase the similarity between nodes of the same types while encouraging competition. As shown in Figure 1, this model’s output is also calculated by the softmax activation function. The final output denotes the classification score for all data in which each row denotes the classification score for the node. Note that is the output of the auxiliary model, which is different from the output of the semi-supervised classification model. The similarity loss function as:
| (7) |
where is a minimal constant; determines the width of the kernel.
Then, the joint representation is used to compute a fusion loss. It poses extra regularization that can help generalization Liu et al. (2020). The final loss function is defined as:
| (8) |
where and are defined in Eq.(6) and Eq.(7), respectively. Parameter is a tradeoff parameter with a default value of 1.
4 Experiments and Results
4.1 Dataset
To verify the effectiveness of our model, we evaluate it on the Autism Brain Imaging Data Exchange (ABIDE) database Martino et al. (2014). The ABIDE publicly shares fMRI and the corresponding phenotypic data (e.g., age and gender) of 1112 subjects, and notes whether these subjects have Autism Spectrum Disorder (ASD). In order to compare fairly with state-of-the-art Huang and Chung (2020) on the ABIDE, we select the same 871 subjects consisting of 403 normal and 468 ASD individuals, and perform the same data preprocessing steps Huang and Chung (2020); Sarah et al. (2018). Then we delete the subjects with empty values, and finally select the 759 subjects consisting of 367 normal and 392 ASD individuals. Besides, approved by the local Institutional Review Board, the local hospital provides ultrasound images of breast nodules and the corresponding phenotypic data (e.g., age, gender, and calcification) of 572 sets, and follows the diagnostic results given by the radiologist for each subject to note whether these subjects have Breast Cancer. These data are acquired from 121 different patients consisting of 55 adenopathy and 66 breast cancer individuals, and each set contains a total of six images (two ultrasound static imaging and four ultrasound elastography). We remove cases without complete phenotypic measures and adjust all images to 256×256, and then organize the collected data into the breast cancer detection dataset (BCD) and verify the universality of proposed model on it.
| Hyperparameter description | Value |
| Layer number of the MLA-GCN | 5 |
| Layer number of the ADU-GCN | 2 |
| Chebyshev polynomial | 3 |
| Number of node features | 2000 |
| Graph convolution kernel | 16 |
| Learning rate of MLA-GCN | 0.005 |
| Learning rate of ADU-GCN | 0.05 |
| Regularization parameter | 0.0005 |
| Dropout probability | 0.3 |
| Number of training epoch | 300 |
| Tradeoff parameter | 1 |
| Optimizer | Adam |
4.2 Baseline Methods and Settings
We compare the AMA-GCN with the following baselines:
ResNet-50 He et al. (2016): A single modality classification approach using only images.
Ridge classifier Abraham et al. (2016): A single modality classification approach using only features extracted from medical imaging data.
GCN Sarah et al. (2018): A model extracting features contained in medical multimodal data, which is usually used to deal with non-Euclidean data.
JK-GCN Xu et al. (2018): A model using an aggregation layer before the output layer to integrate information.
GLCN Jiang et al. (2020): A model using graph learning mechanism to constantly optimize graph structure to improve the classification effect.
EV-GCN Huang and Chung (2020): A model using a custom encoder to obtain the association between nodes from non-imaging phenotypic data, and JK-GCN is used to aggregate information.
EV-GCN+PS: A model using the phenotypic measures selected by proposed PSWE as the basis for constructing the population graph, and using EV-GCN to extract structural information.
4.2.1 Ablation Study
To investigate how the PSWE, the multi-layer aggregation mechanism and similarity loss function improve the performance of the proposed model, we conduct the ablation study on the following variants of AMA-GCN:
AMA-GCN(noP) is a model that uses the same phenotypic measures with baseline methods to build the population graph as input and uses proposed model for training.
AMA-GCN(noW) is a model that only uses PSWE to select effective phenotypic measures, and uses a two-layer GCN for training. Note that the weight ratio calculated by PSWE is not used.
AMA-GCN(noA) is a model that uses PSWE to build the population graph, but uses a two-layer GCN for training.
AMA-GCN(noS) is a model without the similarity loss function.
In order to ensure a fair comparison, when we do not use PSWE to select the appropriate phenotypic measures, we choose gender and acquisition sites as the basis for constructing the population graph of ABIDE database, and choose age as the basis for constructing the population graph of BCD dataset. This setting applies to all baseline models. The hyperparameters of the experiment are shown in Table 1. We employ 10-fold cross-validation to evaluate the performance of the model and implement our model using TensorFlow. In order to evaluate the performance of models, we choose overall accuracy (ACC) and area under the curve (AUC) as the evaluation indicators.
4.3 Results and Analysis
| ABIDE | BCD | |||
| ACC | AUC | ACC | AUC | |
| ResNet-50 | 0.626 | 0.679 | 0.897 | 0.955 |
| Ridge classifier | 0.636 | 0.688 | 0.901 | 0.961 |
| GCN | 0.705 | 0.731 | 0.916 | 0.950 |
| JK-GCN | 0.722 | 0.736 | 0.947 | 0.972 |
| GLCN | 0.707 | 0.725 | 0.932 | 0.965 |
| EV-GCN | 0.829 | 0.876 | 0.967 | 0.987 |
| EV-GCN+PS | 0.936 | 0.949 | 0.971 | 0.989 |
| AMA-GCN | 0.984 | 0.983 | 0.994 | 0.998 |
| AMA-GCN(noP) | 0.724 | 0.747 | 0.956 | 0.979 |
| AMA-GCN(noW) | 0.955 | 0.974 | 0.974 | 0.987 |
| AMA-GCN(noA) | 0.972 | 0.986 | 0.976 | 0.983 |
| AMA-GCN(noS) | 0.981 | 0.981 | 0.990 | 0.992 |
We compare our AMA-GCN with the six baseline methods for predictive classification of disease on the ABIDE database and BCD dataset, as shown in Table 2. It can be observed that single-mode models (i.e. ResNet-50 and Ridge classifier) only use medical imaging data as the basis for classification, and their overall performance is poor. Comparatively, graph-based methods (GCN, JK-GCN, GLCN, EV-GCN and ours) yield larger performance gains, benefiting from analyzing associations between nodes in the population graphs. The proposed method, AMA-GCN, obtains an average accuracy of 98.4 and 99.4 on ABIDE and BCD datasets, respectively, outperforming the recent SoTA method EV-GCN, which employs an adaptive population graph with variational edges and uses JK-GCN to aggregate structure information. We notice that the performance of graph-based methods is highly sensitive to the phenotypic measures used to construct graphs, where the phenotypic measures gender, acquisition sites on ABIDE database used by EV-GCN yields an average accuracy of 82.9. To prove the effectiveness of the phenotypic measures selected by our PSWE, we train EV-GCN using the same phenotypic measures as those in our model. As depicted in Table 2, it results in 10.7 accuracy and 7.3 AUC improvement on ABIDE database respectively, indicating that the appropriate phenotypic measures are indeed the key to improving the performance of disease prediction. Meanwhile, the universality in leveraging multimodal data for disease prediction of the proposed AMA-GCN architecture is relatively validated according to the comparison results on BCD dataset in Table 2.
4.3.1 Ablation Experiments
As an ablation study, we test whether removing the PSWE, the multi-layer aggregation mechanism or similarity loss function affect model performance, and the results as shown in Table 2. It can be observed that the phenotypic measures selected by PSWE can significantly improve the classification accuracy. Using only these phenotypic measures without considering PMS-scores, the average accuracy of the constructed graphs on the ABIDE and BCD datasets is improved by 25.0 and 5.8, respectively. The classification accuracy is further improved by 1.7 and 0.2 on ABIDE and BCD datasets respectively after calculating PMS-scores to the selected phenotypic measures. Although the latter can also improve the classification accuracy, the improvement is far less than the former, which indicates that finding the appropriate phenotypic measures is the key to disease prediction. In addition, the effectiveness of multi-layer aggregation mechanism in improving classification accuracy is also validated according to the comparison results in Table 2.
4.4 Phenotypic Measures Analysis
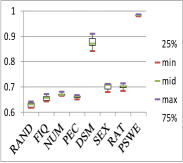
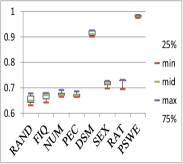
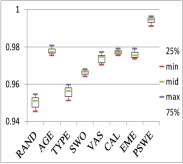
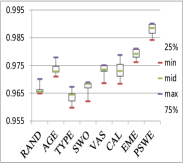
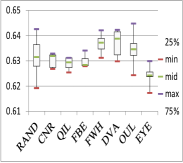
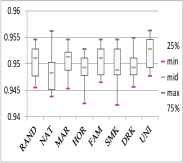
In order to demonstrate our conclusion that finding the appropriate phenotypic measures is the key to solving the problem of disease classification, and also to prove the effectiveness of proposed PSWE, we further explore the impact of each phenotypic measure on the classification results. As shown in Figure 3, using the single phenotypic measure selected by PSWE to construct the population graph as input, their performances on ABIDE and BCD datasets are respectively more than 3 and 1 better than that of randomly constructed graph. Comparatively, as shown in Figure 4, using phenotypic measures not selected by PSWE as the basis for constructing graphs, the final performance is basically the same as that of randomly generated graphs, and even worse than the latter, which indicates that these phenotypic measures selected by PSWE are reasonable. Meanwhile, PSWE achieves the best performance by combining multiple effective phenotypic measures, and its accuracy on ABIDE database is even 33.8 higher than that of randomly constructed graph. This indicates that there is hidden complementary information among phenotypic measures, and how to learn these complementary information is the key to disease prediction.
5 Conclusion
In this paper, we have proposed a generalizable graph-convolutional framework that combines multimodal data to predict disease. We designed the population graph structure according to the spatial distribution and text similarity of phenotypic measures, while allowing each effective phenotypic measure to contribute to the final prediction. We reconstructed the graph convolution model by using the multi-layer aggregation mechanism to automatically find the optimal feature information from each layer while suppressing over-smooth, and introduce another channel to increase the similarity between different objects in the same type. Experimental results show that the proposed method achieves superior performance on brain analysis and breast cancer prediction. We believe that such an extensible method can have a better use of helping people with medical multimodal data for clinical computer-aided diagnosis.
Acknowledgments
This work was supported by the National Natural Science Foundation of China (31900979,U1604262), CCF-Tencent Open Fund, the National Key Research and Development Program of China under Grant (2017YFB1002104), the National Natural Science Foundation of China under Grant (U1811461), and Zhengzhou Collaborative Innovation Major Project (20XTZX11020).
References
- Abraham et al. (2016) Alexandre Abraham, Michael Milham, Adriana Di Martino, Cameron Craddock, Dimitris Samaras, Bertrand Thirion, and Gael Varoquaux. Deriving reproducible biomarkers from multi-site resting-state data: An autism-based example. NeuroImage, 147:736, 2016.
- Bronstein et al. (2017) Michael Bronstein, Joan Bruna, Yann LeCun, Arthur Szlam, and Pierre Vandergheynst. Geometric deep learning: Going beyond euclidean data. IEEE Signal Processing Magazine, 34(4):18–42, 2017.
- Gadgil et al. (2020) Soham Gadgil, Qingyu Zhao, Adolf Pfefferbaum, Edith Sullivan, Ehsan Adeli, and Kilian Pohl. Spatio-temporal graph convolution for functional mri analysis. arXiv, 2020.
- Gong et al. (2020) Ping Gong, Zihao Yin, Yizhou Wang, and Yizhou Yu. Towards Robust Bone Age Assessment: Rethinking Label Noise and Ambiguity. Medical Image Computing and Computer Assisted Intervention – MICCAI 2020, 2020.
- He et al. (2016) Kaiming He, Xiangyu Zhang, Shaoqing Ren, and Jian Sun. Identity mappings in deep residual networks. Springer, Cham, 2016.
- Huang and Chung (2020) Yongxiang Huang and Albert Chung. Edge-variational graph convolutional networks for uncertainty-aware disease prediction. In Medical Image Computing and Computer Assisted Intervention – MICCAI 2020, 2020.
- Jiang et al. (2020) Bo Jiang, Ziyan Zhang, Doudou Lin, Jin Tang, and Bin Luo. Semi-supervised learning with graph learning-convolutional networks. In 2019 IEEE/CVF Conference on Computer Vision and Pattern Recognition (CVPR), 2020.
- Kazi et al. (2019a) Anees Kazi, Arvind Krishna, Shayan Shekarforoush, Karsten Kortuem, and Nassir Navab. Self-attention equipped graph convolutions for disease prediction. In 2019 IEEE 16th International Symposium on Biomedical Imaging (ISBI), 2019.
- Kazi et al. (2019b) Anees Kazi, Shayan Shekarforoush, Arvind Krishna, Hendrik Burwinkel, and Nassir Navab. Graph Convolution Based Attention Model for Personalized Disease Prediction. Springer, Cham, 2019.
- Lang et al. (2020) Yankun Lang, Chunfeng Lian, Deqiang Xiao, Hannah Deng, and Dinggang Shen. Automatic Localization of Landmarks in Craniomaxillofacial CBCT Images Using a Local Attention-Based Graph Convolution Network. Medical Image Computing and Computer Assisted Intervention – MICCAI 2020, 2020.
- Liu et al. (2020) Shaoteng Liu, Lijun Gong, Kai Ma, and Yefeng Zheng. Green: a graph residual re-ranking network for grading diabetic retinopathy. arXiv, 2020.
- Martino et al. (2014) Adriana Di Martino, Chao-Gan Yan, Qingyang Li, Erin Denio, Francisco Xavier Castellanos, Kaat Alaerts, Jason Anderson, Michal Assaf, Susan Bookheimer, and Mirella Dapretto. The autism brain imaging data exchange: towards a large-scale evaluation of the intrinsic brain architecture in autism. Molecular Psychiatry, 2014.
- Rudie et al. (2013) Jeffrey David Rudie, Jesse Brown, Devi Beck-Pancer, Leanna Hernandez, Emily Dennis, Paul Thompson, Susan Bookheimer, and Mirella Dapretto. Altered functional and structural brain network organization in autism. NeuroImage : Clinical, 2, 2013.
- Sarah et al. (2018) Parisot Sarah, Ktena Sofia Ira, Ferrante Enzo, Lee Matthew, Guerrero Ricardo, Glocker Ben, and Rueckert Daniel. Disease prediction using graph convolutional networks: Application to autism spectrum disorder and alzheimer’s disease. Medical Image Analysis, pages S1361841518303554–, 2018.
- Vivar et al. (2018) Gerome Vivar, Andreas Zwergal, Nassir Navab, and Seyed-Ahmad Ahmadi. Multi-modal Disease Classification in Incomplete Datasets Using Geometric Matrix Completion. Springer, Cham, 2018.
- Xu et al. (2018) Keyulu Xu, Chengtao Li, Yonglong Tian, Tomohiro Sonobe, Ken Ichi Kawarabayashi, and Stefanie Jegelka. Representation learning on graphs with jumping knowledge networks. arXiv, 2018.
- Yu et al. (2020) Shuangzhi Yu, Shuqiang Wang, Xiaohua Xiao, Jiuwen Cao, Guanghui Yue, Dongdong Liu, Tianfu Wang, Yanwu Xu, and Baiying Lei. Multi-scale enhanced graph convolutional network for early mild cognitive impairment detection. Springer, Cham, 2020.
- Zhang et al. (2020) Hanxiao Zhang, Yun Gu, Yulei Qin, Feng Yao, and Guang-Zhong Yang. Learning with sure data for nodule-level lung cancer prediction. In Medical Image Computing and Computer Assisted Intervention – MICCAI 2020, 2020.