Assessment of Subjective and Objective Quality of Live Streaming Sports Videos
Abstract
Video live streaming is gaining prevalence among video streaming services, especially for the delivery of popular sporting events. Many objective Video Quality Assessment (VQA) models have been developed to predict the perceptual quality of videos. Appropriate databases that exemplify the distortions encountered in live streaming videos are important to designing and learning objective VQA models. Towards making progress in this direction, we built a video quality database specifically designed for live streaming VQA research. The new video database is called the Laboratory for Image and Video Engineering (LIVE) Live stream Database. The LIVE Livestream Database includes 315 videos of 45 contents impaired by 6 types of distortions. We also performed a subjective quality study using the new database, whereby more than 12,000 human opinions were gathered from 40 subjects. We demonstrate the usefulness of the new resource by performing a holistic evaluation of the performance of current state-of-the-art (SOTA) VQA models. The LIVE Livestream database is being made publicly available for these purposes at https://live.ece.utexas.edu/research/LIVE_APV_Study/apv_index. html.
Index Terms:
live streaming, video quality assessment, video quality database, objective VQA algorithm evaluationI Introduction
There is a variety of factors that can adversely affect the quality of live streaming videos. For example, bandwidth and stability may affect the received video source quality because of variations in compression, stalls, or scaling. Compression can cause blocking, banding, motion mismatches, and local flicker[1], while scaling can lead to aliasing or interpolation artifacts[2]. If the network connection is unstable or the bitrate inadequate, then frame drops may also occur. If a legacy capture device is used, the source videos might be distorted by interlacing or judder, especially when there is a rapid motion. If the video content is acquired in an interlaced format, and is then deinterlaced, the resulting video may exhibit combing effects, flicker or noticeable line movements.
The development of video quality assessment (VQA) models and datasets has been an ongoing effort for two decades[3, 4, 5, 6, 7, 8, 9, 10, 11, 12, 13, 14, 15]. While objective VQA models aim to predict the perceptual quality of videos without the involvement of humans [16, 17], human subjective quality studies make it possible to better understand and model the specific factors that contribute to the perceived quality of streaming videos. This data can be used to design or learn objective models that are consistent with subjective human evaluations of quality. There have been many efforts to build subjective video quality databases. Among those, the LIVE VQA Database[3], the LIVE QoE Database for HTTP-based Video Streaming [18] and the LIVE Mobile Video Quality Database[19] consists of various video distortions encountered in video streaming including compression, packet-losses, and video stalls. Similarly, the MCL-V database[20], and the TUM databases[21], contain several synthesized videos with H.264 compression.
Yet none of these databases are specifically designed for live streaming distortions. Among existing datasets, most include fewer than 20 pristine source video contents of Standard Definition (SD) or High Definition (HD) resolutions, along with various distorted versions of them. The distortions in these resources are largely limited to compression and aliasing, and the datasets lack other live streaming distortions. What is needed is a database of higher resolution (UHD), high-quality source videos that have been processed to include distortions characteristic of those encountered in live streaming scenarios.
Towards filling this gap, we have created a new resource that we call the LIVE Livestream Database, which includes a large number of high motion sports videos, impaired by the most common distortions that impact the perceptual quality of live streamed videos. The new database contains 315 videos, impaired by six types of common processing distortions. The LIVE Livestream database consists of Full High Definition (FHD) and Ultra High Definition (UHD) videos of high-motion sports content captured by professional videographers. Using these videos, we conducted a large human subjective study, whereby we presented the videos to a large pool of volunteers to obtain Mean Opinion Scores (MOS). To demonstrate the usefulness of the new dataset, we used it to perform a holistic evaluation of current state-of-the-art VQA models, to compare their performance and to gain insights into potential future live streaming VQA problems.
The rest of the paper is organized as follows: In Section II, we explain the details of the construction of new database and the protocol of the human study. Section III compares the performances of various state of the art (SOTA) VQA models on the new database. Finally, Section IV concludes the paper with thoughts regarding future efforts.
II SUBJECTIVE STUDY
II-A Source Sequences
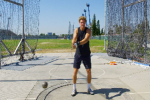
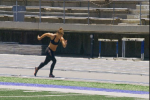
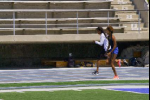
We collected 33 uncompressed, high-quality, freely available online videos from multiple sources, including from Tampere University[22], the MCML Group[23], the Netflix Public Dataset[24], the VQEG HD3 Dataset[25], the Consumer Digital Video Library (CDVL)[26], and the SJTU Media Lab[27]. All of the selected videos were captured with professional, high-end camera equipment and are distortion-free. The original pristine videos all have resolutions of 1920x1080 or 3840x2160 pixels, and were progressively scanned in YUV 4:2:0 format with audio components removed. The videos have frame rates ranging from 25 fps to 30 fps. The video contents include 15 different types of sports, including running, football, and soccer, and one video of the audience in a stadium, as exemplified in Fig. 1.


The original 33 videos that we collected are of durations ranging from 5s to 26s, and we manually cropped the original videos into shorter clips of about 7 seconds. 45 video clips were created from the 33 originals, of which 22 clips are of resolution 1920x1080 and 23 clips are of resolution 3840x2160.
II-B Synthetic Distortions
Six distorted video sequences were created from each of the pristine sequences, using six different distortion processes. These included H.264 compression, aliasing, judder, flicker, frame drops, and interlacing. When applying different levels of each distortion type, we sequenced through the reference sequences such that each would have only a single severity level of each distortion type. For example, four levels of H.264 compression, corresponding to different constant rate factors (CRF) were defined. The first reference video could only be compressed using the first CRF level, the second reference was only compressed using the second CRF level, and so on. The fifth source video then had the first level of distortion applied. However, to ensure that there would be no content-related quality bias, the first video in the quality level cycle was also sequenced as subsequent distortions were applied. In this way, each of the 45 clips taken from the original 45 pristine source videos has 6 associated distorted versions of it, yielding 315 videos.
II-B1 H.264 Compression (c)
H.264 remains the most widely-accepted and used video compression standard. We fixed four levels of H.264 compression using the criteria described earlier, by varying the CRF values. CRF level 1 videos have perceptual qualities similiar to the reference videos, while those of the worst (CRF level 4) videos exhibit obvious compression artifacts. All of the compressed videos were generated using FFmpeg.
II-B2 Aliasing
Aliasing was simulated by first downscaling each video, then upscaling it back to its original dimensions. The downscaling was performed by spatially downsampling the video to half the original size without the use of an anti-aliasing filter, while the upscaling was performed using a Lanczos filter.
II-B3 Judder
Motion judder is an artifact that is introduced when scenes shot at 23.94 fps are converted to 29.97 fps by a process called 3:2 pulldown. The ratio of these frame rates is 4:5: for every 4 input frames, 5 output frames were created by temporally downsampling the video to 23.94 fps using FFMPEG, then converting the frame rate to 29.97 by 3:2 pulldown. The odd video field of every 2nd frame, and the even video field of every 3rd frame of each group of 4 frames were combined to form an additional frame, for each group of 4 frames. This process is shown in Fig. 3.


II-B4 Flicker
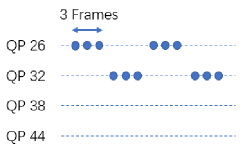
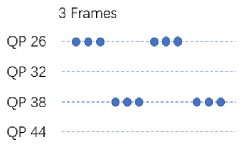
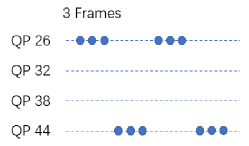
We simulated flicker distortion from compression by alternating the H.264 quantization parameter (QP) on the video. Three pairs of QPs were chosen to form three flicker distortion levels: QP26 and QP32, QP26 and QP38, and QP26 and QP44. The flicker rate, which is the number of QP alternations per second, was kept a constant roughly 5 Hz i.e. by alternating the QP every 3 frames. This process is depicted in Fig. 2.
II-B5 Frame Drops
We simulated video frame losses that occur when a source video is transmitted over a channel, such as a wireless network. We simulated frame drop clusters of adjacent frames to account for 10%-30% of a group of pictures (GOP). Three levels of frame drop densities were chosen: 3, 6 and 9 frames per cluster, yielding a slight to severe impact on the perceptual qualities of the videos.
II-B6 Interlacing (i)
On each frame of the video, the even and odd lines were separated to form two fields, field A and field B. Field B from each current frame and field A from each next frame were then combined to create interlaced frames. In the presence of motion, combing effects become evident. Since interlaced video fields are captured at different moments in time, interlaced frames often exhibit motion combing artifacts, when objects move quickly enough to be at different positions in each field.
II-C Subjective Testing Design
In the human study, a single-stimulus (SS) method was employed, as described in the ITU-R BT 500.13 recommendation[28]. The subjects used a rating bar to record their subjective opinion scores. After displaying each of the test videos, a continuous rating bar was displayed on the screen with a randomly placed cursor. The quality bar was marked with labels “Bad,” “Poor,” “Fair,” “Good,” and “Excellent” to facilitate the subjects in making decisions. The subjects use a Palette gear console to provide subjective scores. Video rating scores were given after watching each video on an (invisible) scale ranging from 0 to 100, where 0 indicates the worst quality and 100 indicates the best quality.
II-D Subjective Testing Environment and Display
The human study was carried out in the LIVE Subjective study room at The University of Texas at Austin. The Lab was arranged to simulate a living room environment. The windows were covered, and background distractions were removed. A Samsung UN65RU7100FXZA Flat 65-Inch 4K UHD TV was used to display all of the videos. The viewing distance was about 2H, where H is the height of the TV so that the subjects could comfortably view the videos and assess the video distortions.
Since the TV is able to upscale 1080p content using an unknown algorithm, all of the 1080p videos were instead upscaled using the Lanczos resizing function to avoid any unpredictable effects. The 1080p videos were upscaled to 4K, after the distortions were applied. To ensure perfect playback, all of the videos were stored as raw YUV 4:2:0 files. The powerful Venueplayer application developed by VideoClarity was used to guarantee smooth playback of the 4K videos.
II-E Human Subjects and Score Processing
A total of 40 human subjects were recruited from the student population at The University of Texas at Austin. Two of the subjects finished only one of the two sessions, and the rest 38 human subjects finished both sessions. 154 videos were rated by 40 subjects, while 161 videos were rated by 38 subjects. The subject pool was inexperienced with video quality assessment and video distortions.
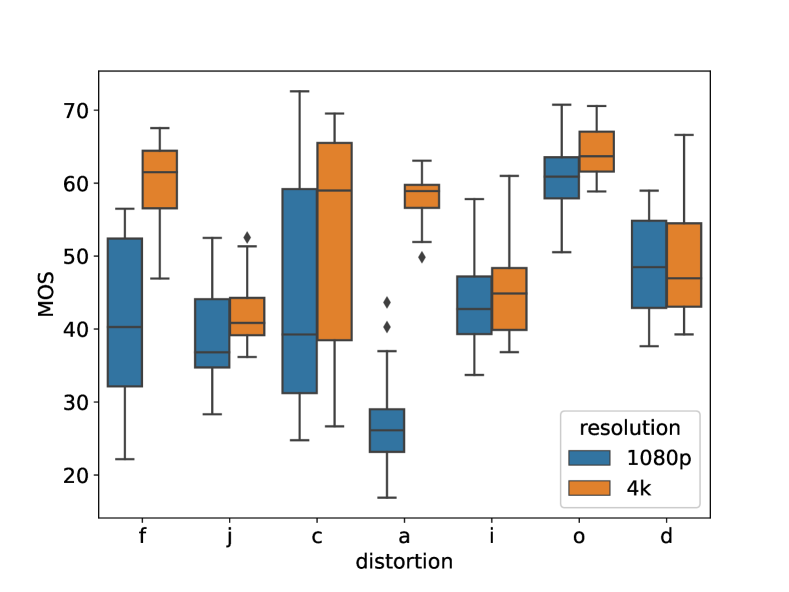
Subjective Mean Opinion Scores (MOS) were computed as described in[29]. A box plot of the calculated MOS score is shown in Fig. 4. The distorted video classes exhibit different distributions, since they reflect different types and levels of distortion. The purely temporal distortions–interlacing, judder, and frame drops–yielded similiar ranges of MOS for 1080p and 4K videos. However, aliasing resulted in very different MOS ranges, likely because of the additional upscaling of 1080p videos when displayed on the 4K TV.
| ALGORITHM | Overall | COMPRESSION | ALIASING | JUDDER | FLICKER | FRAME DROP | INTERLACING |
| NIQE | 0.3232 | 0.3175 | 0.3060 | 0.2863 | 0.3332 | 0.2842 | 0.2780 |
| BRISQUE | 0.6381 | 0.5748 | 0.7564 | 0.8235 | 0.6574 | 0.2569 | 0.8689 |
| VIIDEO | 0.0044 | 0.0053 | 0.0073 | 0.0055 | 0.0013 | 0.0024 | 0.0064 |
| CORNIA | 0.6778 | 0.6873 | 0.7853 | 0.8390 | 0.5861 | 0.2776 | 0.8864 |
| HIGRADE | 0.6916 | 0.5748 | 0.6965 | 0.7729 | 0.6295 | 0.6057 | 0.8266 |
| V-BLIINDS | 0.7330 | 0.6450 | 0.7606 | 0.8679 | 0.6182 | 0.7131 | 0.8060 |
| TLVQM | 0.7503 | 0.5614 | 0.7420 | 0.8328 | 0.6202 | 0.8555 | 0.8173 |
| ChipQA-0 | 0.7513 | 0.6594 | 0.7791 | 0.8513 | 0.6491 | 0.6780 | 0.8534 |
| ALGORITHM | OVERALL | COMPRESSION | ALIASING | JUDDER | FLICKER | FRAME DROP | INTERLACING |
| NIQE | 0.4962 | 0.4983 | 0.4820 | 0.3860 | 0.2848 | 0.2849 | 0.2850 |
| BRISQUE | 0.6698 | 0.7345 | 0.9321 | 0.8726 | 0.7268 | 0.3902 | 0.9118 |
| VIIDEO | 0.1271 | 0.1222 | 0.1222 | 0.1235 | 0.1247 | 0.1256 | 0.1259 |
| CORNIA | 0.7257 | 0.8243 | 0.9472 | 0.8642 | 0.5871 | 0.2138 | 0.9216 |
| HIGRADE | 0.6990 | 0.6913 | 0.9311 | 0.8014 | 0.6402 | 0.6025 | 0.8699 |
| V-BLIINDS | 0.7477 | 0.8055 | 0.9202 | 0.9200 | 0.7086 | 0.7443 | 0.8873 |
| TLVQM | 0.7513 | 0.6788 | 0.9273 | 0.8914 | 0.7724 | 0.8738 | 0.8358 |
| ChipQA-0 | 0.7565 | 0.7783 | 0.9490 | 0.9071 | 0.6609 | 0.6945 | 0.9075 |
III Objective VQA Model Comparison
We evaluated several publicly available objective VQA algorithms on the LIVE Livestream Database to demonstrate the usefulness of the new resource. The performances of the objective VQA algorithms were evaluated using the Spearman’s Rank Order Correlation Coefficient (SROCC) and the Pearson Linear Correlation Coefficient (PLCC).
III-A Performance of VQA Models
The NR VQA algorithms that were tested include NIQE[30], BRISQUE[31], HIGRADE[32], CORNIA[33], TLVQM[34], VIIDEO[35], V-BLIINDS[36], and ChipQA-0[37]. BRISQUE, HIGRADE, CORNIA, TLVQM, V-BLIINDS, and ChipQA-0 are supervised learning algorithms that use a support vector regressor (SVR) to learn mappings from ’quality-aware’ features to mean opinion scores. These algorithms were tested on 1000 random train-test splits. On each split, 80% of the data was used for training, and 20% for testing. Care was taken to ensure that no content could appear in both the training and testing set, or the training and validation set. NIQE, BRISQUE and HIGRADE are image quality assessment (IAQ) algorithms, so they were used to extract features frame by frame, followed by temporal average pooling.
For the unsupervised methods (NIQE and VIIDEO), the scores were passed through a nonlinear logistic regression process before the PLCC, as described in [29]. The performances of the compared VQA models on the entire database, as well as for each synthetic distortion, are shown in Tables I and II, where the best performing model on each distortion category is boldfaced. The results for each specific distortion were acquired by training the SVR on the reference sequences and the specific distorted sequences.
III-B Discussion of Results
From Tables I, and II, it may be observed that V-BLIINDS performed the best among the compared NR VQA algorithms, while TLVQM and ChipQA-0 also achieved relatively higher correlations against the human judgments. These learning-based models use simple measurements of motion, which is highly relevant on these kinds of videos. CORNIA yielded top performances on compression, aliasing, and interlacing, all of which present strong spatial aspects of distortion. However, the overall performance of CORNIA was lower than that of V-BLIINDS, TLVQM, and ChipQA-0, due to the lack of temporal information, e.g., when processing frame drops, TLVQM was able to effectively capture the perceptual effects of frame drops, but its performance drops on the compression and flicker distortions.
IV Conclusion
We created a large scale video quality database targeting high-motion, live streaming scenarios. The new resource includes 45 different contents and 6 different distortion types. The new database can be used to create, test, and compare both VQA models. We are making the new LIVE Livestream database publicly available. Future steps include developing new VQA models using the proposed database.
Acknowledgment
Z. Shang and J.P. Ebenezer are co-first authors of this work. The authors acknowledge the Texas Advanced Computing Center (TACC) at The University of Texas at Austin for providing HPC, visualization, database, and grid resources that have contributed to the research results reported in this paper. URL: http://www.tacc.utexas.edu.
References
- [1] P. Ni, R. Eg, A. Eichhorn, C. Griwodz, and P. Halvorsen, “Flicker effects in adaptive video streaming to handheld devices,” in 19th ACM Int. Conf. on Multimedia, 2011, pp. 463–472.
- [2] S. M. Keating, “Image signal process. with digital filtering to minimize aliasing caused by image manipulation,” U.S. Patent 5 206 919, Apr. 27, 1993.
- [3] K. Seshadrinathan, R. Soundararajan, A. C. Bovik, and L. K. Cormack, “Study of subjective and objective quality assessment of video,” IEEE Trans. Image Process., vol. 19, no. 6, pp. 1427–1441, 2010.
- [4] A. K. Moorthy, L. K. Choi, A. C. Bovik, and G. De Veciana, “Video quality assessment on mobile devices: Subjective, behavioral and objective studies,” IEEE J. Sel. Topics Signal Process., vol. 6, no. 6, pp. 652–671, 2012.
- [5] S. Tomar, “Converting video formats with ffmpeg,” Linux J., vol. 2006, no. 146, p. 10, 2006.
- [6] C. G. Bampis, Z. Li, A. K. Moorthy, I. Katsavounidis, A. Aaron, and A. C. Bovik, “Study of temporal effects on subjective video quality of experience,” IEEE Trans. Image Process., vol. 26, no. 11, pp. 5217–5231, 2017.
- [7] D. Ghadiyaram, J. Pan, A. C. Bovik, A. K. Moorthy, P. Panda, and K.-C. Yang, “In-capture mobile video distortions: A study of subjective behavior and objective algorithms,” IEEE Trans. Circuits Syst. Video Technol, vol. 28, no. 9, pp. 2061–2077, 2017.
- [8] C. Chen, X. Zhu, G. de Veciana, A. C. Bovik, and R. W. Heath, “Adaptive video transmission with subjective quality constraints,” in IEEE ICIP, 2014, pp. 2477–2481.
- [9] C. Chen, L. K. Choi, G. de Veciana, C. Caramanis, R. W. Heath, and A. C. Bovik, “A dynamic system model of time-varying subjective quality of video streams over http,” presented IEEE ICASSP, 2013, pp. 3602–3606.
- [10] D. Jayaraman, A. Mittal, A. K. Moorthy, and A. C. Bovik, “Objective quality assessment of multiply distorted images,” in Conf. Rec. 46th ASILOMAR, 2012, pp. 1693–1697.
- [11] A. K. Moorthy, L. K. Choi, A. C. Bovik, and G. de Veciana, “Video quality assessment on mobile devices: Subjective, behavioral and objective studies,” IEEE J. Sel. Topics Signal Process., vol. 6, no. 6, pp. 652–671, 2012.
- [12] M. Chen, Y. Jin, T. Goodall, X. Yu, and A. C. Bovik, “Study of 3d virtual reality picture quality,” IEEE Journal of Selected Topics in Signal Processing, vol. 14, no. 1, pp. 89–102, 2019.
- [13] Z. Tu, Y. Wang, N. Birkbeck, B. Adsumilli, and A. C. Bovik, “UGC-VQA: Benchmarking blind video quality assessment for user generated content,” arXiv preprint arXiv:2005.14354, 2020.
- [14] L.-H. Chen, C. G. Bampis, Z. Li, J. Sole, and A. C. Bovik, “Perceptual video quality prediction emphasizing chroma distortions,” IEEE Trans. Image Process., vol. 30, pp. 1408–1422, 2021.
- [15] Z. Tu, X. Yu, Y. Wang, N. Birkbeck, B. Adsumilli, and A. C. Bovik, “Rapique: Rapid and accurate video quality prediction of user generated content,” arXiv preprint arXiv:2101.10955, 2021.
- [16] S.-C. Pei and L.-H. Chen, “Image quality assessment using human visual dog model fused with random forest,” IEEE Transactions on Image Processing, vol. 24, no. 11, pp. 3282–3292, 2015.
- [17] Z. Tu, J. Lin, Y. Wang, B. Adsumilli, and A. C. Bovik, “Bband index: A no-reference banding artifact predictor,” in ICASSP 2020 - 2020 IEEE International Conference on Acoustics, Speech and Signal Processing (ICASSP), 2020, pp. 2712–2716.
- [18] C. Chen, L. K. Choi, G. De Veciana, C. Caramanis, R. W. Heath, and A. C. Bovik, “Modeling the time—varying subjective quality of http video streams with rate adaptations,” IEEE Trans. Image Process., vol. 23, no. 5, pp. 2206–2221, 2014.
- [19] A. K. Moorthy, L. K. Choi, G. de Veciana, and A. Bovik, “Mobile video quality assessment database,” in IEEE ICC Workshop on Realizing Advanced Video Optimized Wireless Networks, 2012, pp. 7055–7059.
- [20] J. Y. Lin, R. Song, C.-H. Wu, T. Liu, H. Wang, and C.-C. J. Kuo, “MCL-V: A streaming video quality assessment database,” J. Vis. Commun. Image Represent., vol. 30, pp. 1–9, 2015.
- [21] C. Keimel, J. Habigt, T. Habigt, M. Rothbucher, and K. Diepold, “Visual quality of current coding technologies at high definition IPTV bitrates,” presented at the IEEE MMSP, 2010, pp. 390–393.
- [22] A. Mercat, M. Viitanen, and J. Vanne, “Uvg dataset: 50/120fps 4K sequences for video codec analysis and development,” in ACM MMSys 2020, pp. 297–302.
- [23] M. Cheon and J.-S. Lee, “Subjective and objective quality assessment of compressed 4K UHD videos for immersive experience,” IEEE Trans. Circuits Syst. Video Technol, vol. 28, no. 7, pp. 1467–1480, 2017.
- [24] Z. Li, A. Aaron, I. Katsavounidis, A. Moorthy, and M. Manohara, “Toward a practical perceptual video quality metric,” Netflix Tech Blog, vol. 6, p. 2, 2016.
- [25] Video Quality Experts Group, ”Final report from the video quality experts group on the validation of objective quality metrics for video quality assessment”, 2000 (accessed October 31,2020). [Online]. Available: http://www. its. bldrdoc. gov/vqeg/projects/frtv phaseI
- [26] W. Yodel, The consumer digital video library, 2011. [Online]. Available: https://cdvl.org/
- [27] L. Song, X. Tang, W. Zhang, X. Yang, and P. Xia, “The SJTU 4K video sequence dataset,” presented at the 5th QoMEX. IEEE, 2013, pp. 34–35.
- [28] ITU, “Methodology for the subjective assessment of the quality of television pictures ITU-R recommendation BT. 500-13,” Tech. Rep, Tech. Rep., 2012.
- [29] X. Yu, C. G. Bampis, P. Gupta, and A. C. Bovik, “Predicting the quality of images compressed after distortion in two steps,” IEEE Trans. Image Process., vol. 28, no. 12, pp. 5757–5770, 2019.
- [30] A. Mittal, R. Soundararajan, and A. C. Bovik, “Making a “completely blind” image quality analyzer,” IEEE Signal Process. Lett, vol. 20, no. 3, pp. 209–212, 2012.
- [31] A. Mittal, A. K. Moorthy, and A. C. Bovik, “No-reference image quality assessment in the spatial domain,” IEEE Trans. image Process., vol. 21, no. 12, pp. 4695–4708, 2012.
- [32] D. Kundu, D. Ghadiyaram, A. C. Bovik, and B. L. Evans, “No-reference quality assessment of tone-mapped hdr pictures,” IEEE Trans. Image Process., vol. 26, no. 6, pp. 2957–2971, 2017.
- [33] P. Ye, J. Kumar, L. Kang, and D. Doermann, “Unsupervised feature learning framework for no-reference image quality assessment,” in CVPR 2012. IEEE, pp. 1098–1105.
- [34] J. Korhonen, “Two-level approach for no-reference consumer video quality assessment,” IEEE Trans. Image Process., vol. 28, no. 12, pp. 5923–5938, 2019.
- [35] A. Mittal, M. A. Saad, and A. C. Bovik, “A completely blind video integrity oracle,” IEEE Trans. Image Process., vol. 25, no. 1, pp. 289–300, 2015.
- [36] M. A. Saad, A. C. Bovik, and C. Charrier, “Blind image quality assessment: A natural scene statistics approach in the DCT domain,” IEEE Trans. Image Process., vol. 21, no. 8, pp. 3339–3352, 2012.
- [37] J. P. Ebenezer, Z. Shang, Y. Wu, H. Wei, and A. C. Bovik. (2020) No-reference video quality assessment using space-time chips. [Online]. Available: https://arxiv.org/abs/2008.00031