Low-luminosity galaxies in the early universe have observed sizes similar to star cluster complexes
Abstract
We compare the sizes and luminosities of faint -8 galaxies magnified by the Hubble Frontier Fields (HFF) clusters with star-forming regions, as well as more evolved objects, in the nearby universe. Our high-redshift comparison sample includes 333 -8 galaxies, for which size measurements were made as part of a companion study where lensing magnifications were estimated from various public models. Accurate size measurements for these sources are complicated by the lens model uncertainties, but other results and arguments suggest that faint galaxies are small, as discussed in a companion study. The measured sizes for sources in our comparison sample range from 50 pc to 500 pc. For many of the lowest luminosity sources, extremely small sizes are inferred, reaching individual sizes as small as 10-30 pc, with several sources in the 10-15 pc range with our conservative magnification limits. The sizes and luminosities are similar to those of single star cluster complexes like 30 Doradus in the lower-redshift universe and – in a few cases – super star clusters. The identification of these compact, faint star-forming sources in the -8 universe also allows us to set upper limits on the proto-globular cluster LF at . By comparisons of the counts and sizes with recent models, we rule out (with some caveats) proto-globular cluster formation scenarios favoring substantial () post-formation mass loss and set useful upper limits on others. Our size results suggest we may be very close to discovering a bona-fide population of forming globular clusters at high redshift.
1. Introduction
There are a wide variety of evolved stellar systems in the nearby universe (Norris et al. 2014), from globular clusters (Brodie & Strader 2006; Kruijssen 2014; Renzini et al. 2015) to compact elliptical galaxies (e.g., Faber 1973), ultra-faint dwarfs (e.g., Simon & Geha 2007), and ultra-diffuse spheroids (e.g., van Dokkum et al. 2015), each of which presumably has its own characteristic formation pathway. The high stellar densities in many of these systems in combination with their old ages (e.g., Forbes & Bridges 2010) suggest that the majority of their star formation occured at when the gas densities in the universe were in general much higher.
One potentially promising way forward for investigating the formation of these local systems is by obtaining a sensitive, high-resolution view of the distant universe. Fortunately, such observations can be obtained by combining the power of long exposures with the Hubble Space Telescope with the magnifying effect of gravitational lensing, as recently implemented in the ambitious Hubble Frontier Fields (HFF) program (Coe et al. 2015; Lotz et al. 2017). Such sensitive observations allow us to probe to very low luminosities, as is likely necessary to detect many of the progenitors of local systems. The high lensing magnifications from massive galaxy clusters stretch many galaxies by substantial factors, allowing them to be studied at very high spatial resolution. As we discussed in Bouwens et al. (2021a), this stretching can reliably be estimated up to linear magnifications of 30 (or total magnification factors of 50: see also Bouwens et al. 2017b where similar, though smaller limits were presented with the then-current models, and Meneghetti et al. 2017).
The promise of the HFF program to examine faint sources in the distant universe at extremely high resolution was bourne out by the studies of Kawamata et al. (2015) and Bouwens et al. (2017a), who identified small 40 pc star-forming sources in the -9 universe and remarked that the size of such systems approached that of giant molecular clouds or star-forming clumps in the local universe (Kennicutt et al. 2003). Vanzella et al. (2017a) speculated that a few of these small star-forming sources behind the HFF clusters could correspond to proto-globular clusters. They supported their hypothesis with MUSE spectroscopy of the sources, noting small probable dynamical masses (due to the small measured velocity dispersions) and probable physical associations with brighter neighbors (due to their similar redshifts). In two follow-up studies, Vanzella et al. (2019, 2020) identified two candidate proto-globular cluster systems with inferred sizes 13 pc and 5-10 pc, which is very close to the expected sizes of young massive clusters (Kruijssen 2014).
We can now build on this recent work, using large catalogs of -9 galaxies constructed from the deep HST observations over the six HFF clusters. Lensing models have also improved, as a result of a larger number of approaches and improved techniques. The median of these models is expected to be more robust than any individual model and the scatter provides an estimate of the uncertainties. Thanks to the improvements in the lensing models and the large number of clusters targeted, it has become possible to measure the sizes for large samples of faint -9 galaxies and to very small sizes. Kawamata et al. (2018) report results for 181 -9 galaxies, while Bouwens et al. (2021a) report results for 333 -8 galaxies. Both studies report results on all six HFF clusters and find substantial numbers (30) of -9 star-forming sources with plausible half-light radii 50 pc. This remains the case even when we adopt the conservative approach discussed in Bouwens et al. (2021a) to limit linear and total magnification factors to 30 and 50, respectively.
Given the small inferred sizes of the fainter lensed sources identified by Kawamata et al. (2018) and Bouwens et al. (2021a), it is interesting to place these sources in the context of various stellar systems that they may evolve into today, as well as other small star-forming systems like star clusters or cluster complexes. An initial look at such comparisons were already executed in an earlier unpublished study by our group (Bouwens et al. 2017) and also by Kikuchihara et al. (2020). An important early inference from these studies was that lensed -8 galaxies have sizes and masses that appear to lie in the range of 50-500 pc and 107 to 108 , lying somewhere between ultra compact dwarfs/globular clusters and compact elliptical galaxies in size/mass space.
The purpose of the present work is to revisit these comparisons, utilizing the large selection of -8 galaxies with size measurements from Bouwens et al. (2021a) while leveraging a variety of new results – both from simulations (Ploeckinger et al. 2019; Pfeffer et al. 2019) and from local observations (Zick et al. 2018) – to allow for an improved interpretation of the observational results. Two aspects are of particular interest: (1) comparing the sizes of sources in these selections with star cluster complexes like 30 Doradus in the LMC and (2) using the Bouwens et al. (2021a) searches to set constraints on proto-globular cluster formation models such as described by Boylan-Kolchin (2017), Pfeffer et al. (2019), J. Pfeffer et al. (2021, in prep), and Pozzetti et al. (2019). Throughout the paper, we assume a standard “concordance” cosmology with km s-1 Mpc-1, and , which is in good agreement with recent cosmological constraints (Planck Collaboration et al. 2016). Magnitudes are in the AB system (Oke & Gunn 1983).
| ID | R.A. | Decl | ccMedian magnification factors (and uncertainties) derived weighting equally the latest public version 3/4 parametric models from each lensing methodology (§4.1 from Bouwens et al. 2021a). | dd are the median one-dimensional magnification factors (and uncertainties) along the major shear axis weighting equally the parametric models from each lensing methodology. This is the same quantity as reported by Vanzella et al. (2017a). | (pc)eeInferred half-light radius in physical units. The quoted uncertainties include both uncertainties in the spatial fits and uncertainties in the lensing models. These half-light radii are derived by fitting a Sersic profile to the imaging observations while fixing the Sersic parameter to 1, as discussed in Bouwens et al. (2021a). | |
|---|---|---|---|---|---|---|
| A2744Z-4222023578 | 00:14:22.20 | 30:23:57.8 | 15.6 | 50.1 | 8.5 | 31 |
| A2744Z-4222023578 | 00:14:22.20 | 30:23:57.8 | 15.6 | 50.0ffTotal magnification factor set to 50.0 where the median magnification models begin losing their predictive power (Bouwens et al. 2021a). Because of this use of a limit on the magnification factor, no uncertainty is quoted on the inferred luminosity . Nevertheless, a useful indication of the uncertainties can be seen, if we take the median uncertainties in the quoted magnification factors before imposing a limit, which would give a value of 0.59 dex. | 8.5 | 31 |
| A2744Y-4204124034* | 00:14:20.41 | 30:24:03.4 | 14.0 | 75.0 | 15.1 | 14 |
| A2744Y-4204124034* | 00:14:20.41 | 30:24:03.4 | 14.4 | 50.0ffTotal magnification factor set to 50.0 where the median magnification models begin losing their predictive power (Bouwens et al. 2021a). Because of this use of a limit on the magnification factor, no uncertainty is quoted on the inferred luminosity . Nevertheless, a useful indication of the uncertainties can be seen, if we take the median uncertainties in the quoted magnification factors before imposing a limit, which would give a value of 0.59 dex. | 15.1 | 14 |
| M0416I-6095704260* | 04:16:09.57 | 24:04:26.0 | 15.0 | 12.5 | 8.0 | 28 |
| M0416I-6118103480$\ddagger$$\ddagger$Source also has an inferred size of 40 pc in the Kawamata et al. (2018) catalog. | 04:16:11.81 | 24:03:48.1 | 15.0 | 33.6 | 24.5 | 16 |
| M0416I-6130803432*$\ddagger$$\ddagger$Source also has an inferred size of 40 pc in the Kawamata et al. (2018) catalog. | 04:16:13.08 | 24:03:43.2 | 17.3 | 3.5 | 3.4 | 38 |
| M0416I-6115434445$\dagger$,$\ddagger$$\dagger$,$\ddagger$footnotemark: | 04:16:11.54 | 24:03:44.5 | 14.5 | 43.0 | 31.0 | 21 |
| M0416I-6115434445$\dagger$,$\ddagger$$\dagger$,$\ddagger$footnotemark: | 04:16:11.54 | 24:03:44.5 | 14.5 | 43.0 | 30.0ggLinear magnification factor set to 30.0 where the median magnification models begin losing their predictive power (Bouwens et al. 2021a). Because of this use of a limit on the magnification factor, no uncertainty is quoted on the inferred size . Nevertheless, a useful indication of the uncertainties can be seen, if we take the median uncertainties in the quoted magnification factors before imposing a limit, which would give a value of 0.52 dex. | 22 |
| M0416I-6106703335* | 04:16:10.67 | 24:03:33.5 | 16.3 | 11.1 | 8.8 | 33 |
| M0416Z-6114803434 | 04:16:11.48 | 24:03:43.5 | 17.0 | 21.3 | 14.9 | 38 |
| M0416Y-6088104378* | 04:16:08.81 | 24:04:37.9 | 13.4 | 62.1 | 38.3 | 11 |
| M0416Y-6088104378* | 04:16:08.81 | 24:04:37.9 | 13.7 | 50.0ffTotal magnification factor set to 50.0 where the median magnification models begin losing their predictive power (Bouwens et al. 2021a). Because of this use of a limit on the magnification factor, no uncertainty is quoted on the inferred luminosity . Nevertheless, a useful indication of the uncertainties can be seen, if we take the median uncertainties in the quoted magnification factors before imposing a limit, which would give a value of 0.59 dex. | 30.0ggLinear magnification factor set to 30.0 where the median magnification models begin losing their predictive power (Bouwens et al. 2021a). Because of this use of a limit on the magnification factor, no uncertainty is quoted on the inferred size . Nevertheless, a useful indication of the uncertainties can be seen, if we take the median uncertainties in the quoted magnification factors before imposing a limit, which would give a value of 0.52 dex. | 14 |
| M0717Z-7354743496 | 07:17:35.47 | 37:43:49.7 | 13.9 | 57.7 | 46.8 | 27 |
| M0717Z-7354743496 | 07:17:35.47 | 37:43:49.7 | 14.0 | 50.0ffTotal magnification factor set to 50.0 where the median magnification models begin losing their predictive power (Bouwens et al. 2021a). Because of this use of a limit on the magnification factor, no uncertainty is quoted on the inferred luminosity . Nevertheless, a useful indication of the uncertainties can be seen, if we take the median uncertainties in the quoted magnification factors before imposing a limit, which would give a value of 0.59 dex. | 30.0ggLinear magnification factor set to 30.0 where the median magnification models begin losing their predictive power (Bouwens et al. 2021a). Because of this use of a limit on the magnification factor, no uncertainty is quoted on the inferred size . Nevertheless, a useful indication of the uncertainties can be seen, if we take the median uncertainties in the quoted magnification factors before imposing a limit, which would give a value of 0.52 dex. | 42 |
| M0717I-7374244282 | 07:17:37.42 | 37:44:28.2 | 15.0 | 9.6 | 3.6 | 34 |
| M0717Z-7390844017$\ddagger$$\ddagger$Source also has an inferred size of 40 pc in the Kawamata et al. (2018) catalog. | 07:17:39.08 | 37:44:01.7 | 17.1 | 21.8 | 17.7 | 24 |
| M0717Z-7401344384 | 07:17:40.13 | 37:44:38.5 | 16.1 | 8.3 | 6.4 | 39 |
| M0717Z-7311744437* | 07:17:31.17 | 37:44:43.8 | 16.0 | 8.2 | 4.0 | 27 |
| M0717Y-7336744331 | 07:17:33.67 | 37:44:33.1 | 14.4 | 43.1 | 7.6 | 31 |
| M0717Y-7329744137 | 07:17:32.97 | 37:44:13.7 | 15.3 | 13.7 | 7.5 | 34 |
| M1149I-9384023344 | 11:49:38.40 | 22:23:34.5 | 13.0 | 124.7 | 90.7 | 26 |
| M1149I-9384023344 | 11:49:38.40 | 22:23:34.5 | 14.0 | 50.0ffTotal magnification factor set to 50.0 where the median magnification models begin losing their predictive power (Bouwens et al. 2021a). Because of this use of a limit on the magnification factor, no uncertainty is quoted on the inferred luminosity . Nevertheless, a useful indication of the uncertainties can be seen, if we take the median uncertainties in the quoted magnification factors before imposing a limit, which would give a value of 0.59 dex. | 30.0ggLinear magnification factor set to 30.0 where the median magnification models begin losing their predictive power (Bouwens et al. 2021a). Because of this use of a limit on the magnification factor, no uncertainty is quoted on the inferred size . Nevertheless, a useful indication of the uncertainties can be seen, if we take the median uncertainties in the quoted magnification factors before imposing a limit, which would give a value of 0.52 dex. | 79 |
| M1149Y-9377423253* | 11:49:37.74 | 22:23:25.4 | 14.9 | 16.2 | 7.9 | 19 |
| A370I-9544334397* | 02:39:54.43 | 1:34:39.7 | 12.7 | 228.9 | 23.1 | 10 |
| A370I-9544334397* | 02:39:54.43 | 1:34:39.7 | 14.4 | 50.0ffTotal magnification factor set to 50.0 where the median magnification models begin losing their predictive power (Bouwens et al. 2021a). Because of this use of a limit on the magnification factor, no uncertainty is quoted on the inferred luminosity . Nevertheless, a useful indication of the uncertainties can be seen, if we take the median uncertainties in the quoted magnification factors before imposing a limit, which would give a value of 0.59 dex. | 23.1 | 10 |
| A370Z-9535934395 | 02:39:53.59 | 1:34:39.6 | 15.5 | 10.9 | 7.7 | 31 |
| AS1063I-8439532143 | 22:48:43.95 | 44:32:14.3 | 13.5 | 42.3 | 19.0 | 33 |
| AS1063I-8469531055 | 22:48:46.95 | 44:31:05.5 | 14.9 | 12.9 | 10.3 | 35 |
| AS1063Y-8436531406* | 22:48:43.65 | 44:31:40.6 | 12.5 | 175.3 | 77.7 | 9 |
| AS1063Y-8436531406* | 22:48:43.65 | 44:31:40.6 | 13.9 | 50.0ffTotal magnification factor set to 50.0 where the median magnification models begin losing their predictive power (Bouwens et al. 2021a). Because of this use of a limit on the magnification factor, no uncertainty is quoted on the inferred luminosity . Nevertheless, a useful indication of the uncertainties can be seen, if we take the median uncertainties in the quoted magnification factors before imposing a limit, which would give a value of 0.59 dex. | 30.0ggLinear magnification factor set to 30.0 where the median magnification models begin losing their predictive power (Bouwens et al. 2021a). Because of this use of a limit on the magnification factor, no uncertainty is quoted on the inferred size . Nevertheless, a useful indication of the uncertainties can be seen, if we take the median uncertainties in the quoted magnification factors before imposing a limit, which would give a value of 0.52 dex. | 23 |
2. High-Redshift Samples and Size Measurements
Here we provide a brief summary of the -8 selections from Bouwens et al. (2021a) that we utilize in interpreting their properties relative to various star-forming or evolved sources in the local universe. For a more detailed description of the procedure used in selecting sources or deriving sizes/luminosities, the interested reader is referred to our companion paper (Bouwens et al. 2021a).
2.1. Selection and Size Measurements for -8 Galaxies
Briefly, the -8 samples we utilize are selected from the v1.0 reductions of the HST data over all six HFF clusters. A combination of Lyman-break and photometric-redshift selection criteria are applied in creating source catalogs from the HST images. Bright foreground galaxies and also the intracluster light were modeled and subtracted from the HST images, before construction of the catalogs.
In deriving the luminosities and sizes of individual sources, source magnifications and shear factors are estimated from all of the v3 or v4 public parametric lensing models. The shear factor utilized here was defined as
| (1) |
(see Bouwens et al. 2017a and Bouwens et al. 2020). is the convergence and is the shear. From the estimated magnifications and shear factors , we can derive a median linear magnification along the major and minor shear axes, i.e., and , which we use in measuring the physical size of the source along both axes. We find that these linear magnification factors can now be reliably estimated to magnification factors of 30 (§4.2 from Bouwens et al. 2020) and possibly to slightly larger factors using a median of the latest parametric lensing models available for the HFF clusters (e.g., as in Livermore et al. 2017; Bouwens et al. 2017b).
The fits to the sizes of individual sources are then performed using an Markov-Chain Monte-Carlo procedure, where we take a model Sersic profile, transform the profile according to the median magnification factors, convolve the derived profile with the PSF, compare the result with the observations, and compute a residual. We use our MCMC procedure to minimize the sum of the square of the residuals.
A full compilation of the coordinates, luminosities, and sizes of the -8 galaxies Bouwens et al. (2021a) identify behind all six HFF clusters is given in their Table 2. The uncertainties Bouwens et al. (2021a) compute on the derived sizes include both the formal uncertainties on the size fits and the error computed based on the range in linear magnifications predicted by the parametric lensing models. Table 1 of Bouwens et al. (2021a) tabulates the sizes and luminosities of those sources with linear and total magnification factors 30 and 50, respectively, a second time but setting the magnification factors to 30 and 50, respectively, to provide more conservative size and luminosity estimates, given the breakdown in the predictive power of these models at very high magnification factors. When adopting an upper limit of 30 and 50 on the linear and total magnification factors, respectively, no uncertainties are quoted on the sizes or luminosities , respectively, of sources. Nevertheless, if we take the median scatter in the quoted magnification factors before imposing these limits, the typical uncertainty would be 0.52 and 0.59 dex, respectively. The total magnification and linear magnification are treated as independent for the purposes of imposing the upper limits.
There are 23 objects from the Bouwens et al. (2021a) compilation with sizes 40 pc, with the three smallest sources having sizes of 11 pc (M0416Y-6088104378), 11 pc 10 (A370I-9544334397), and 9 pc (AS1063Y-8436531406). For convenience, we include a list of these sources in Table 1. The uncertainties in the measured sizes for these small sources are clearly substantial. Of the 23 sources in Table 1, only three have measured sizes less than 40 pc after allowing for the positive fluctuations in the measured sizes. Nine sources are within an upper bound of 50 pc (a slightly less stringent limit) allowing for the uncertainties. These 9 sources are indicated in Table 1 with a “*” to indicate that their small size measurements are more robust. As in Table 2 of Bouwens et al. (2021a), we also include sources a second time when their linear and total magnification factors exceed 30 and 50, respectively, but setting these factors to 30 and 50, respectively.
2.2. Comparison with Previous Compilations of Small Star-Forming Sources
Here we compare the sizes of small galaxies in our -8 sample to similarly small (10-100 pc) sources identified by Vanzella et al. (2017a) and to new results recently obtained by Kawamata et al. (2018: which are an update to the earlier Kawamata et al. 2015 results). In the companion paper to this one (Bouwens et al. 2021a), we provided a similar comparison but focusing on our entire lensed sample of -8 sources.
Two of the three star-forming candidates that Vanzella et al. (2017a) identify over MACS0416 are also included in our compilation of small sources (Table 1). M0416I-6115434445 corresponds to GC1 from Vanzella et al. (2017a), while M0416Z-6114803434 corresponds to D1 from Vanzella et al. (2017a) and Vanzella et al. (2019). D2 from Vanzella et al. (2017a) is also in the Bouwens et al. (2021a) source catalogs.
For GC1, D1, and D2, we measure half-light radii of 21 pc, 38 pc, 72 pc, while Vanzella et al. (2017a) measure 167 pc, 14013 pc, and 100 pc, respectively, for these. Vanzella et al. (2019) later revisited their structural analysis of D1 and derived a half-light radius of 13 pc for the core of D1 and 44 pc for the source as a whole. The sizes we infer for M0416I-6115434445/GC1 and M0416I-6103003258/D2 are in excellent agreement with those from Vanzella et al. (2017a). For the third source M0416Z-6114803434/D1, the half-light radius Bouwens et al. (2021a) estimate is in good agreement with the size Vanzella et al. (2019) derive for the source as a whole.
The larger size estimate for M0416Z-6114803434/D1 from Vanzella et al. (2017a) likely results from the Sersic parameter they find from their size fits, which might suggest a larger size for the source. Vanzella et al. (2019), however, in a follow-up study argue that perhaps a preferable interpretation of observations is in terms of a two component fit, with a bright central component for the source. The presence of a compact, central high surface-brightness region with an estimated size of 13 pc is fascinating in the context of our discussion in §5.1 and its relevance to the suspected presence of high surface brightness star-forming complexes as per Figure 4. This conceptual model is discussed in more depth in §5.1.
We can also compare with the compilation of small -8 sources identified by Kawamata et al. (2018). Of the 23 -8 sources in the Kawamata et al. (2018) catalogs with source sizes less than 50 pc or smaller and which also appear in our catalogs, we measure a median size of 63 pc. For the eight -8 galaxies in our catalogs with inferred source sizes 50 pc which also appear in the Kawamata et al. (2018) catalogs, the median size Kawamata et al. (2018) derive is 35 pc. This demonstrates that the derived sizes for the smallest sources in each of our catalogs is reproducible (at least broadly speaking). Overall, for the 24 sources in our collective -8 catalogs where Kawamata et al. (2018) or we derive sizes less than 50 pc, we compute an RMS source-to-source scatter of 0.31 dex. This is similar to the 0.30-dex scatter we find in size measurements for the 92 sources in common between our samples. The size comparisons with Kawamata et al. (2018) are quite reassuring.
We remark that the higher significance detections that Kawamata et al. (2018) require in multiple near-IR bands for their own selections of -9 galaxies appear to be a major reason why their catalogs include a smaller number of sources (181 sources) than our own (333 sources). In our own selections, we only require sources be detected at 6, based on the parameter results we obtain by adding in quadrature the detection significance in the near-IR bands. We made use of a similar procedure in a variety of previous analyses (e.g., Bouwens et al. 2011, 2015, 2021b). This results in our selection including many more sources at 28 mag than are present in the Kawamata et al. (2018) selection and thus being 1.8 larger.
3. Comparison to Star Clusters, Super Star Clusters, and Star Cluster Complexes
Given the extremely small sizes (i.e., 40 pc) inferred for some fraction (here, 7% of our sample of 333 galaxies) of the lensed sources identified behind the HFF clusters (Bouwens et al. 2017a; Vanzella et al. 2017a, 2017b, 2019), it is interesting to compare these sources with more familiar star-forming entities in the nearby universe in terms of their sizes and luminosities. These entities broadly fall into two classes by size, star clusters and star cluster complexes.
3.1. Star Clusters and Star Cluster Complexes
3.1.1 Star Clusters and Super Star Clusters
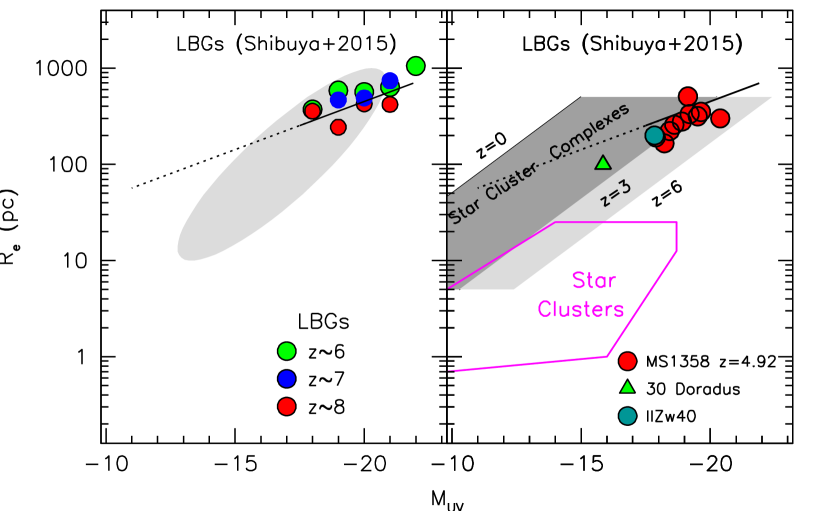
The first of these classes are the smaller star-forming objects, star clusters and super star clusters. Meurer et al. (1995) provide a convenient summary of where star clusters lie in terms of their effective radii and luminosities in their Figure 14. luminosities of the star clusters extend from 9 mag to mag, masses range from to (Maraston et al. 2004; Cabrera-Ziri et al. 2014, 2016), while the typical effective radii of star clusters range from 0.5 pc to 4 pc (e.g., Lada & Lada 2003).
The magenta line in the right panel of Figure 1 demarcates the approximate sizes and luminosities found for star clusters and super star clusters in the nearby universe. For comparison, the size-luminosity relation derived in Bouwens et al. (2021a: §3) for bright star-forming galaxies at -8 is also presented in the left panel of Figure 1, with an extrapolation to lower luminosities. We also show broadly, as a grey shaded area, the region occupied by a fainter sample of 333 galaxies, from Bouwens et al. (2021a).
The most massive (105 ) star clusters are often called super star clusters, with the effective radii extending to a maximum size of 20 pc (e.g., Meurer et al. 1995; Rejkuba et al. 2007; Murray 2009; Bastian et al. 2013). Meurer et al. (1995) classify any star clusters with luminosities greater than 14 mag as super star clusters. We refer the interested readers to other excellent discussions on this topic by Rejkuba et al. (2007), Murray (2009), and Bastian et al. (2013).
3.1.2 Star Cluster Complexes
The larger class of star-forming regions are star cluster complexes seen in star-forming galaxies at (Kennicutt et al. 2003; Bastian et al. 2005). These are also seen out to in strongly lensed galaxies (Jones et al. 2010; Wisnioski et al. 2012; Livermore et al. 2012, 2015; Swinbank et al. 2012; Adamo et al. 2013; Vanzella et al. 2017b; Dessauges-Zavadsky et al. 2017).
Star cluster complexes – often referred to as cluster complexes in nearby galaxies – are known to show a range of surface brightnesses at all redshifts where they are observed, i.e., -3 (Bastian et al. 2005, 2006; Jones et al. 2010; Swinbank et al. 2012; Wisnioski et al. 2012; Rodríguez-Zaurín et al. 2011; Kennicutt et al. 2003). Star cluster complexes are also described as star-forming clumps (or giant HII regions) when observed in distant galaxies. A simple fit to the mean surface brightness of star cluster complexes as function of redshift yields the following relation (Livermore et al. 2015):
| (2) |
While many other observations of star cluster complexes at intermediate to high redshifts are also consistent with the above trend (Franx et al. 1997; Swinbank et al. 2009; Wuyts et al. 2014; Johnson et al. 2017), some star cluster complexes at have been reported to show much higher (by factors of 100) surface densities of star formation (Fisher et al. 2017).
The implied evolution in the surface brightness of star cluster complexes is essentially identical to what one would infer from dimensional arguments. The sizes of collapsed sources is generally found to scale as (e.g., Bouwens et al. 2004; Oesch et al. 2010; Ono et al. 2013; Holwerda et al. 2015; Shibuya et al. 2015) and the evolution in dynamical time goes as , such that . Nevertheless, it should be recognized that the best-fit evolution in with redshift likely suffers from surface brightness selection effects (given the bias towards selection of the highest surface brightness star cluster complexes at a given redshift), so the evolution suggested by Eq. 2 should only be considered indicative. The black and magenta lines indicate the region in parameter space where we would expect star cluster complexes and star clusters, respectively, to reside (see Figure 1: right panel).
We include a gray-shaded trapezoid in Figure 1 to show the region in size-luminosity parameter space that star cluster complexes in -3 galaxies have been found to inhabit. The light gray region shows an extrapolation of this relation to -6. The solid red circles correspond to the measured sizes and equivalent luminosities of the star cluster complexes identified in the highly magnified galaxy behind MS1358+62 (Franx et al. 1997) by Swinbank et al. (2009) and Jones et al. (2010), while the solid cyan circle and green triangle correspond to the sizes and luminosities of IIZw40 and 30 Doradus, respectively (English & Freeman 2003; Vanzi et al. 2008).
Wisnioski et al. (2012) find that surface brightness of star cluster complexes depend on luminosity as , such that the most luminous star cluster complexes also have the highest surface brightnesses.
3.2. Putting Lensed Star-Forming Sources in Context
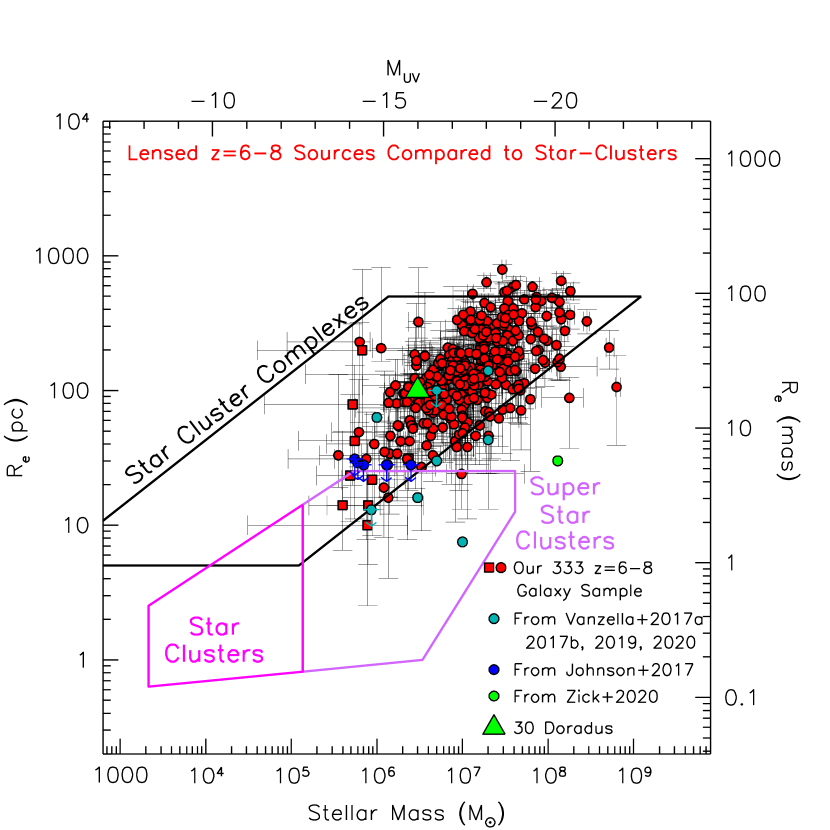
Having presented size, luminosity, and mass relations for star clusters and cluster complexes, we now compare them with our lensed samples of -8 sources from Bouwens et al. (2021a). We present such a comparison in Figure 2, including also the candidates identified by Vanzella et al. (2017a, 2017b, 2019, 2020), Johnson et al. (2017), and Zick et al. (2020). The sizes and luminosities in Figure 2 (and Figure 3) use values for the linear and total magnification factor of 30 and 50, respectively, for sources where the median magnification factors from the lensing models exceed 30 and 50, respectively.
The black and magenta lines indicate the region in parameter space where we would expect star cluster complexes and star clusters, respectively, to reside (as we showed in Figure 1). Most strikingly, the size and luminosities of our sample of 333 lensed -8 sources are very similar overall to what is found for star cluster complexes in -3 galaxies.
Interestingly, in a few cases, the overall sizes and luminosities of these sources even extend into the parameter space occupied by super star clusters. It is difficult to be sure about a star cluster identification at the spatial resolutions available with HST (or ground-based telescopes) even with lensing magnification. Nevertheless, there are a few sources that have been identified, i.e., the core of the Vanzella et al. (2017a) D1 source and knot A of the Sunburst arc (Dahle et al. 2016; Vanzella et al. 2020), where there is particularly strong evidence for the sources having very high magnification factors and very small sizes thanks to the availability of multiple images of each source behind a given lensing cluster (Vanzella et al. 2019, 2020). The core of the D1 source has an inferred size 13 pc, while knot A of the Sunburst arc has a likely size of 5-10 pc.
We will discuss these similarities in more detail in §5.
4. Connection to Sources in the Local Universe
Beyond exploring potential similarities with star clusters and cluster complexes, it is interesting to ask how the faint lensed sources we are finding compare with various stellar systems found in the nearby universe.
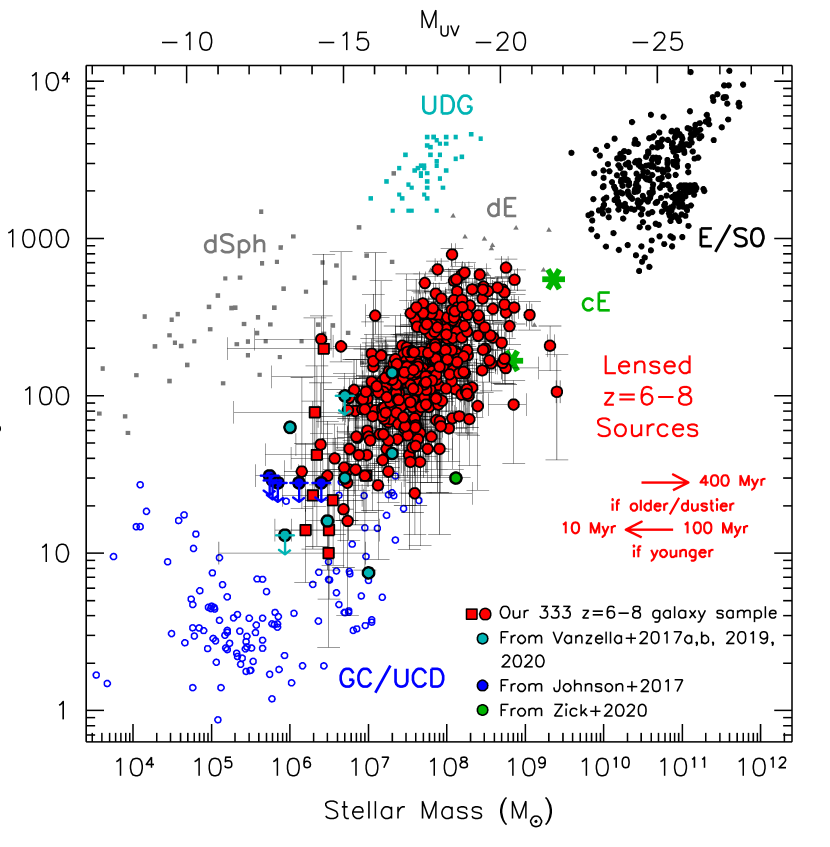
For this exercise, we use the compilation that Norris et al. (2014) and M. Norris (2021, private communication) provide of the sizes and masses for a wide variety of local sources. This compilation includes elliptical and S0 galaxies (e.g., Cappellari et al. 2011; McDermid et al. 2015), ultra-diffuse ellliptical galaxies (e.g., van Dokkum et al. 2015), dwarf ellipticals and spheroids (e.g., Misgeld et al. 2008), compact ellipticals such as Messier 32 (e.g., Chilingarian et al. 2009), ultra-compact dwarfs (e.g., Evstigneeva et al. 2007; Misgeld et al. 2011), and globular clusters (e.g., Hasegan et al. 2005; Firth et al. 2007; Mieske et al. 2007; Francis et al. 2012).
Figure 3 shows the inferred sizes and masses for our lensed -8 sample relative to the Norris et al. (2014) compilation. Other noteworthy especially small candidates from the literature (e.g., Vanzella et al. 2017a, 2017b, 2019, 2020; Johnson et al. 2017; Zick et al. 2020) are also presented. The indicative masses that we use for our lensed sample are computed assuming a fixed stellar population duration of 100 Myr in converting from their measured luminosities . Kikuchihara et al. (2020) found that this stellar population age was a good match to the mass-to-light ratios derived through detailed stellar population modeling of the full HST+Spitzer/IRAC photometry from lensed -8 sources.
Interestingly, some lensed sources in our samples have size and luminosities in the regime of ultra-compact dwarf galaxies or globular clusters, with measured sizes 40 pc. Kawamata et al. (2015) had previously reported two sources with such small sizes. Now, largely due to the new compilations by Bouwens et al. (2017a), Kawamata et al. (2018), and Bouwens et al. (2021a) and candidates by Johnson et al. (2017), Vanzella et al. (2017a, 2017b, 2019, 2020), we now recognize that many, if not most, very faint galaxies at -8 may be small, but we cannot quantify the fraction yet with certainty (e.g., Figure 5 from Bouwens et al. 2020). Bouwens et al. (2021a) provides an extensive discussion of the evidence for why many faint -8 galaxies seem to be very small, even if the individual measurements are not yet definitive.
5. Discussion
5.1. Just a Single Prominent Star Cluster or Star Cluster Complex Per Faint Galaxy?
Interestingly most of the lensed -8 sources behind the HFF clusters show very similar sizes and luminosities as star cluster complexes identified in -3 galaxies (Figure 2); in particular, they are significantly smaller in size than the extrapolated size-luminosity relation for -8 galaxies from blank field studies where radius scales as or (e.g., de Jong & Lacey 2000; van der Wel et al. 2014).
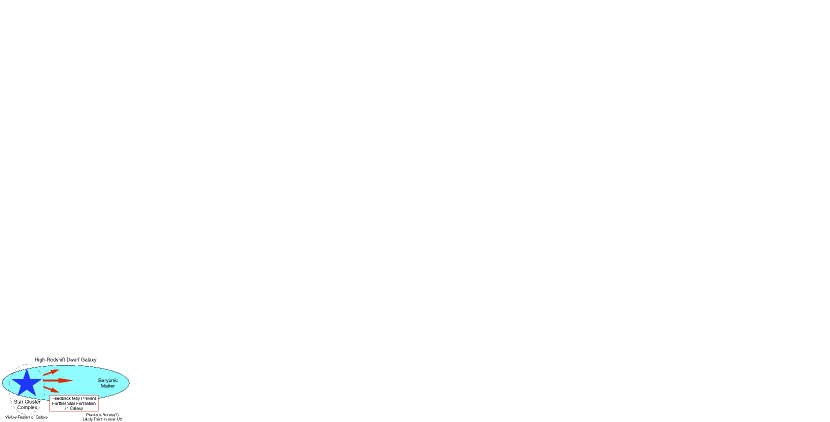
As has been speculated in the past (e.g., Bouwens et al. 2017a; Vanzella et al. 2017a), one might ask if we are simply seeing individual star cluster complexes in -8 galaxies and not the galaxies as a whole. Only a fraction of the baryonic material associated with dwarf galaxies, could be lighting up in the rest- in the observations, i.e., we might be seeing a single dominant star cluster complex (e.g., Figure 4). In the Overzier et al. (2008) study of local Lyman-Break Analogue galaxies, it was noted how our entire rest- view of these galaxies could be dominated by a few cluster complexes. Overzier et al. (2008) speculated about how fainter Lyman-break analogues might look and whether they might be dominated by a single super star cluster or cluster complex (see their §5.2.2).
More recent examples of galaxies where the rest- view of galaxies are dominated by a small region of the galaxy include Kiso 5639 (Elmegreen et al. 2016). At lower luminosities closer to the -8 galaxies we are considering, possible analogues could include the recent extremely metal poor, high sSFR galaxies shown in Figure 1 of Isobe et al. (2020). There metal poor galaxies appear to be significantly less spatially extended than the seemingly associated galaxies they seem to be a part. While no rest- observations are presented by Isobe et al. (2020) to evaluate their spatial extent in the rest-, the very strong line emission from these galaxies suggests they may dominate the morphology of these galaxes at such wavelengths, making such sources very compact in the rest-, with sizes predominantly in the range 40 to 500 pc. Consistent with the suggested clumpy star-cluster complex scenario, observations show an increasing fraction of light in compact star-forming regions, from low redshift to high redshift (Ribeiro et al. 2017).
How likely is it for lower-mass galaxies in the -8 universe to host just a single dominant star cluster complex? There are several recent observational and theoretical results we can consider to try to address this question.
From a theoretical perspective, addressing this question properly would require high resolution hydrodynamical simulations (e.g., Ma et al. 2018, 2020; Ploeckinger et al. 2019). Nevertheless, one plausible scenario is to imagine the collapse of an overdensity resulting in the formation of a star cluster complex and feedback from that star cluster complex preventing star formation from occurring at any other position in a dwarf galaxy (Figure 4). While SNe winds might be one possible mechanism (i.e., 4 Myr feedback time scale for wind speeds of 50 km/s and source sizes of 200 pc: see Bastian 2008), another mechanism for inhibiting star formation in other parts of lower mass galaxies would be through radiative feedback. Ploeckinger et al. (2019) show that this mechanism could well be more effective at inhibiting star formation in other regions of lower-mass galaxies.
Zick et al. (2018) looked in detail at the probable appearance of forming globular clusters in the Fornax dwarf galaxy using information in the color magnitude diagrams of field stars in Fornax and stars in its 5 globular clusters. Zick et al. (2018) demonstrated that the forming globular clusters could have been 10-100 times brighter than the Fornax dwarf galaxy as a whole during its formation epoch and 104 brighter in terms of their surface brightness, implying that the only readily detectable regions of dwarf galaxies in deep extragalactic views are the forming globular clusters themselves.
New simulation results from Pfeffer et al. (2019) using the E-MOSAICS (MOdeling Star cluster population Assembly in Cosmological Simulations with EAGLE: Pfeffer et al. 2018; Kruijssen et al. 2019) project offer a somewhat different perspective on the detectability of forming globular clusters. Given the sophistication of the E-MOSAICS project and the care taken to incorporate star cluster formation, evolution, and disruption into the EAGLE galaxy formation simulations (Schaye et al. 2015), results from the project should give us a fairly realistic gauge of what we are observing in current data sets. Most notably, Pfeffer et al. (2019) find that star clusters form in those regions of galaxies where substantial clustered and unclustered star formation is taking place. This would suggest that compact star-forming regions in the distant universe most likely correspond to cluster complexes and not proto-globular clusters forming in isolation. It is unclear at present how to reconcile these results with the inferences made by Zick et al. (2018) for globular clusters forming in the Fornax dwarf galaxy.
While hypothesizing that a single star-cluster complex may dominate the rest- view of many lensed -8 galaxies, we suspect that the underlying host galaxies are likely larger in terms of their physical extent (cf., the Franx et al. 1997 MS1358+62 example). It would be easy for the lower surface brightness regions to be missed due to cosmic surface brightness dimming (e.g., see Ma et al. 2018).
5.2. Limits on the Volume Densities of Forming Globular Clusters in the Universe
We can also use the size measurements from Bouwens et al. (2021a) to set constraints on the luminosity function of proto-globular clusters in the early universe. Clearly, the large ages of stars in most globular clusters together with the high gas densities appropriate for globular cluster formation (Goddard et al. 2010; Adamo et al. 2011; Silva-Villa & Larsen 2011) – as well as the high prevalence of globular clusters even in lower-mass galaxy halos (Spitler & Forbes 2009; Harris et al. 2013) – strongly suggest a formation era. Having observational constraints on the formation of these sources in the early universe is both valuable and interesting.
Given the proximity in time of powerful facilities like the James Webb Space Telescope JWST, there are now numerous predictions for the number of such clusters which might be found in a typical search field with the JWST (Renzini 2017; Boylan-Kolchin 2017, 2018; Elmegreen et al. 2012a) as well as candidate proto-globular clusters identified in separate studies (Vanzella et al. 2017a).
| (Mpc-3) | |
|---|---|
| This WorkaaAll sources with inferred half-light radii less than 40 pc are included in this table. As we discuss in §3 and §4, these small star-forming sources could be characterized as star cluster complexes, super star clusters, proto-globular clusters, or especially compact galaxies. | |
| 17.50 | 0.0001bbIn cases where the median total magnification and linear magnification exceeds 50 and 30, resepectively, we quote alternative estimates for the absolute magnitude and physical size with the total and linear magnification fixed to 50 and 30, respectively. This alternate estimates of and are provided for sources given the challenges in relying upon magnification factors in excess of these values (§4.2 from Bouwens et al. 2021a and Bouwens et al. 2017b). |
| 16.50 | 0.0007bb upper limits |
| 15.50 | 0.004bb upper limits |
| 14.50 | 0.047bb upper limits |
| 13.50 | 0.14bb upper limits |
| Estimated From Vanzella et al. (2017a) | |
| 15.50 | 0.0106b,cb,cfootnotemark: |
| Volume Densities Probed with the HFF programddGray region in Figure 5 | |
| 17.50 | 0.00014 |
| 16.50 | 0.00041 |
| 15.50 | 0.0020 |
| 14.50 | 0.011 |
| 13.50 | 0.062 |
| 12.50 | 0.9 |
To provide constraints on the volume density of forming globular clusters in the early Universe, we explicitly consider the size constraints we have available for the full sample of sources over all six HFF clusters from Bouwens et al. (2021a) vs. that expected for star clusters (Figure 2). If the size measurements for a source yield a half-light radius measurement of 40 pc, we consider it as a possible globular cluster candidate. In this discussion we use the full sample of sources with sizes 40 pc from Bouwens et al. (2021a), but also show the (small) impact of limiting ourselves to linear and total magnifications of 30 and 50, respectively. This target size range factors in the 10-20-pc maximum observed sizes of globular clusters (§3.1.1), with a few notable exceptions (Pal 5 and Pal 14: Baumgardt & Hilker 2018; Kikuchihara et al. 2020) and a factor-of-2 evolution in the size of the globular clusters themselves that can occur following their initial formation time. Such size evolution could occur due to two-body relaxation, mass loss by stellar evolution, and galaxy tides (Hills 1980; Goodman 1984; Baumgardt & Makino 2003; Shin et al. 2013). A 40-pc size limit also allows us to be as inclusive as possible in selecting possible globular cluster candidates to ensure that the upper limit we set on the volume density of forming globular cluster candidates is robust. This is a careful, even conservative approach, that is particularly appropriate with our sample given the significant systematic and random uncertainties in our direct size measurements, as we discussed extensively in Bouwens et al. (2021a). Using this definition, one of the sources with size measurements from Kawamata et al. (2015), i.e., HFF1C-i10, would already qualify as a proto-globular cluster candidate.
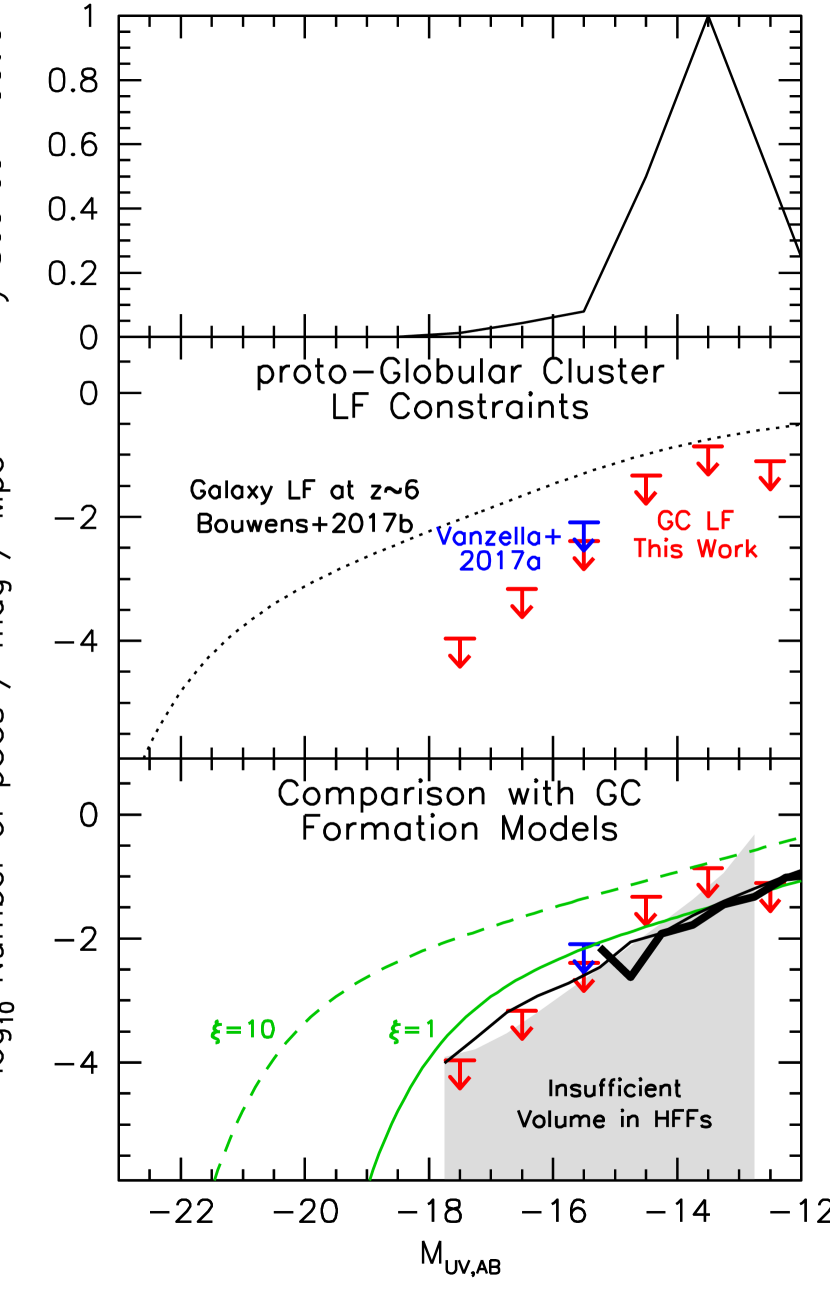
In the upper panel of Figure 5, we present the fraction of sources which could correspond to forming globular clusters vs. luminosity (i.e., those with pc: see Table 1). We then show in the middle panel of Figure 5, the implied upper limits we obtain on the volume density of proto-globular clusters forming in the distant universe. Given the challenges in being sure that any given system corresponds to a proto-globular cluster (or the challenges in being sure that specific lensed sources are in fact small: see §4.4-4.5 from Bouwens et al. 2020), we include our constraints as upper limits. The upper limits and fractions we present in Figure 5 are based on median linear magnification factors from the parametric models. If we only include those 21 sources (out of 23) which satisfy our 40 pc-criterion when utilizing a maximum linear magnification factor of 30, the upper limits we derive would be 10% more stringent than what present in Table 1 and Figure 5.
In the same panel, we also include the one proto-globular cluster candidate GC1 identified by Vanzella et al. (2017a) at again as an upper limit on the volume density (see also Vanzella et al. 2019). For consistency with the candidates included from our own study, we only include this candidate since its inferred size of 167 pc satisifes our criterion of a source size 40 pc. In Table 2, we provide the estimated upper limits on the volume density of sources for comparison.
An important uncertainty in attempting to quantify the volume density of globular clusters forming in the distant universe regards the possibility that globular clusters may not be identifiable separately from the host galaxy of which they are a part. As we discusssed in §5.1, Zick et al. (2018) made use of the available resolved stellar population information on the Fornax dwarf galaxy to demonstrate that globular clusters forming in that system could be clearly identifiable as separate systems during their formation phase. The E-MOSAICS simulation results presented by Pfeffer et al. (2019) suggest that such identifications could be much more challenging, however, due to star clusters typically forming in significant associations. While such could make the identification of single star clusters more challenging, we will need to postpone a detailed consideration of these issues to a future analysis where we can simulate these issues in detail in the context of a full globular cluster+galaxy formation simulation like E-MOSAICS.
For comparison with our proto-globular cluster constraints, we also include on the lower panel of Figure 5 several predictions for the number density of proto-globular cluster and evolved globular cluster systems as a function of luminosity present in the universe using several different proto-globular cluster formation models. The first predictions are from the E-MOSAICS project (Pfeffer et al. 2018; Kruijssen et al. 2019), which explicitly adds star cluster formation to the EAGLE galaxy formation simulations, while matching of the observed scaling relations and prevalence of young and evolved star clusters. Using results from E-MOSAICS executed on a (34.4 comoving Mpc)3 volume, we show predictions for the luminosity function of the forming globular clusters at (thin black line: J. Pfeffer et al. 2020). Also shown are the predicted from Pfeffer et al. (2019) zoom-in simulation results (thick black line) on 25 Milky-Way-like galaxies normalized to match the new J. Pfeffer (2021, in prep) results at the low luminosity end.
Additionally, we show the predicted globular cluster LF from the Boylan-Kolchin (2017, 2018) model. The Boylan-Kolchin (2018) approach has particular value due to its relative simplicity and the convenient Schechter function approximation provided for the proto-globular cluster LF. Shown are the predicted globular cluster LF for two different values of the ratio of stellar mass in the initial globular cluster at its birth and that present at , i.e., . Following Boylan-Kolchin (2017, 2018), we use the symbol to describe this ratio and present both the case (where Mpc-3, , ) and case (where Mpc-3, , ) in Figure 5. The case involves substantial mass loss after the initial globular burst would favor very bright proto-globular clusters in the early universe. Such a scenario is motivated e.g. by Schaerer & Charbonnel (2011) based on chemical complexity of the enrichment in globular clusters (see also D’Ercole et al. 2008; Renzini et al. 2015). E-MOSAICS features very little mass loss from forming globular clusters and therefore the effective mass-loss factor is closest to 1. The predicted LFs of other models in the literature, e.g., Pozzetti et al. (2019), lie between the and results from Boylan-Kolchin (2017, 2018).
For context, we also show on the lower panel of Figure 5 the volume densities to which we would be able to search for proto-globular clusters of specific luminosities with the full HFF program. The volume densities are computed as in Bouwens et al. (2017b) and hence would be for a probe of proto-globular clusters at . They are based on the results over all six HFF clusters (Bouwens et al. 2021, in prep). These volume densities are also compiled in Table 2 for convenience. The search volume available for proto-globular clusters in the -10 universe is 3 larger than in the universe (i.e., -6.3 using the Bouwens et al. 2017b criteria).
Remarkably, the predictions from E-MOSAICS (Pfeffer et al. 2019; J. Pfeffer et al. 2021, in prep) lie quite close to the upper limits we can set on the basis of existing HFF search results at 15 mag and brightward. E-MOSAICS predicts 1.5 proto-globular cluster candidates at both 17.5 and 16.5 mag in the total magnified volume behind the HFF clusters, consistent with the number of candidates found here from the Bouwens et al. (2021a) compilation. The model from Boylan-Kolchin (2017, 2018) predicts a proto-globular cluster LF that is 0.4-0.5 dex higher than the E-MOSAICS model. This is clearly in excess of our HFF constraints brightward of 16 mag, predicting 3 and 10 sources at mag and mag, respectively, within the volume of the HFF program. As mentioned above, the Pozzetti et al (2019) model predictions lie between the and the lines. As such the Pozzetti et al. (2019) model predicts an even larger number of proto-globular cluster candidates (2-3 larger) to be present in the HFF volume (not shown in Figure 5).
At slightly fainter luminosities, i.e., 15.5 mag, our observational results (red downward arrows) are also more consistent with the minimal scenario sketched out by Boylan-Kolchin (2017: green solid line). If the Boylan-Kolchin (2018) scenario is correct, three -mag sources identified with the HFF program are expected to correspond to proto-globular clusters in formation. For the E-MOSAICS model, one -mag source would correspond to a proto-globular cluster. While still small numbers, these constitute 50%-100% of the tiny star-forming sources that we have identified at those low luminosities. These results indicate that we observe plausible consistency between the current globular cluster formation models and what we derive from our size and LF results. Faintward of 14 mag, the predicted proto-globular prevalence from the E-MOSAICS and Boylan-Kolchin (2017, 2018) models appear to be too low to be well probed by the HFF program.
Interestingly, and rather definitively, the model of Boylan-Kolchin (2017) exceeds the upper limits we can set from the HFF observations at all luminosities. As such, we can likely already rule the model out. This adds to other independent evidence against such models (Bastian & Lardo 2015; Kruijssen 2015; Webb & Leigh 2015; Martocchia et al. 2017; Elmegreen 2017).
The present comparisons suggest that observers may be on the brink of exploring the formation of globular clusters in the distant universe with current and especially using future observations with JWST (see also discussion in Renzini 2017, Vanzella et al. 2019, and Pozzetti et al. 2019). With JWST, not only will we be able to search for proto-globular cluster candidates much more efficiently, but we will be able to characterize each candidate system in detail using high S/N spectrocopy, probing the velocity dispersion (and thus allowing for a measurement of the dynamical mass) as well as the chemical maturity of such systems.
5.3. Challenges Related to the Size Measurements We Utilize
The comparisons we present here of source sizes at -8 and those of local star forming regions exemplifies the power of using lensing clusters. However, as is discussed in §4.5 of Bouwens et al. (2021a), uncertainties in the magnification factors can have a significant impact on the measured sizes, resulting in sources whose sizes are both larger and smaller than reality. The tests discussed in Bouwens et al. (2021a), which build on the work of Bouwens et al. (2017a) and (2017b), suggest that recovery of the true sizes and luminosities of the original lensed galaxies is nevertheless possible up to linear magnification factors of 30 (for sizes), and total magnification factors of 50 (for luminosities), but become less unreliable at higher magnification factors. The collective impact of uncertainties in the lensing models on the derived size distributions is illustrated well with Figure 5 of Bouwens et al. (2021a).
Nonetheless, there is an abundance of evidence that many faint sources are small, and that the broad distribution of sources we show here in Figures 2 and 3 are likely representative of the real distribution of sources. One especially strong piece of evidence is from the observed surface density of faint -8 galaxies in the highest magnification regions behind lensing clusters and the fact that this surface density appears to show no dependence on the shear factor (Bouwens et al. 2017a). This could only be the case if faint galaxies had intrinsically small sizes, i.e., 165 pc (86% confidence: Bouwens et al. 2017a).
Second, a number of sources with especially small size measurements benefit from the existence of other multiple images of the same source. The existence of such images allow us to set tighter constraints on the magnification of sources at very high magnification factors. Examples of such sources include both the central proto-globular candidate in D1 (Vanzella et al. 2017, 2019) and the candidate YMC in knot A of the Sunburst arc (Vanzella et al. 2020) and give us confidence that many more such small sources exist amongst the lensed population of -8 galaxies behind the HFF clusters.
Third, a high prevalence of faint -8 galaxies is found in high magnification regions behind the HFF clusters (Bouwens et al. 2017a,b; Ishigaki et al. 2018; Bouwens et al. 2020). This could only be the case if sources were significantly smaller than found from a simple extrapolation of the Shibuya et al. (2015) relation (unless the LF showed a concave-upwards form, which seems inconsistent with galaxy formation models). The discussion in §5.3 from Bouwens et al. (2021a), as well as their Figure 10, illustrates this well.
Finally, there are also the size-luminosity results at (Bouwens et al. 2020) which are less impacted by incompleteness systematics and provide clearer evidence for lower luminosity sources having very small sizes. While there are a number of uncertainties in the size-luminosity relation we derive from direct measurements, the above results collectively provide strong evidence that (1) galaxies fainter than about 17 have very small sizes, and (2) do so with a slope that appears to be steeper than for luminous galaxies. An important caveat here is that our size measurements are in the rest- and thus may not reflect the true spatial extent of a galaxy, but merely that of the dominant star forming region, as we discussed in §5.1 and showed schematically in Figure 4.
6. Summary
We have made use of a significant sample of 333 lensed star-forming galaxies behind the HFF clusters and compared their inferred sizes and luminosities to various classes of sources in the local universe to help put these high-redshift sources in context. Both the identification of these -8 sources and their size measurements are described in a companion paper (Bouwens et al. 2021a).
The results presented here broadly assume that that the distribution of sizes and luminosities inferred by Bouwens et al. (2021a) are representative of reality. Indeed, there is a wide variety of indirect evidence supporting the general conclusion from Bouwens et al. (2021a) that most lower luminosity, -8 sources are small, as discussed here in §5.3. Nevertheless, it is worth being aware of the significant impact that issues like incompleteness and uncertainties in the lensing models can have on the measured sizes and luminosities, as e.g. discussed by Bouwens et al. (2021a). The impact of these uncertainties is especially large for the lowest luminosity sources, so some caution is required in interpreting the present results.
Our analysis shows that -8 sources from the Bouwens et al. (2021a) samples have measured sizes and luminosities very similar to that derived for star cluster complexes identified in galaxies at -3 (Jones et al. 2010; Livermore et al. 2012, 2015; Wisnioski et al. 2012; Swinbank et al. 2012; Johnson et al. 2017). In fact, the typical 15 mag galaxy in our samples has a smaller half-light radius than 30 Doradus, which has a measured half-light radius of 100 pc. This could be interpreted to suggest that lower luminosity galaxies in the early universe may often contain a single prominent star cluster complexes which dominates the observed UV morphology (Figure 4).
We also placed the measured size and luminosities of lensed -8 galaxies in our samples with the sizes and masses of stellar systems in the nearby universe (§4). Most of the sources have inferred masses and luminosities that place them in the region of parameter space where star cluster complexes lie (Figure 2), which occurs midway between ultra-compact dwarfs and elliptical galaxies (Figure 3). This suggests that many low-luminosity galaxies may be dominated by a single star cluster complex in terms of their observed morphologies (Figure 4).
Nevertheless, we remark that for a small minority of sources in our sample, their properties are consistent with potentially corresponding to super star clusters and – as such – they could correspond to proto-globular clusters (Figure 2: §3). There are 23 sources in the Bouwens et al. (2021a) selection with median size measurements equal to 40 pc or smaller. There are 3 sources from the Bouwens et al. (2021a) selection that are likely to have sizes as small as 10-20 pc.
We combine current constraints on the fraction of especially small sources behind the HFF clusters with new state-of-the-art constraints on the LF of sources at from the HFF clusters (Bouwens et al. 2017b) to derive constraints on the proto-globular cluster LF at high redshift (§5.2). Comparing this LF with predictions from the recent E-MOSAICS project (Pfeffer et al. 2019; J. Pfeffer et al. 2021, in prep), models from Boylan-Kolchin (2017, 2018), and Pozzetti et al. (2019), we find that with current observations from the HFF clusters we are probably very close to identifying bona-fide globular clusters in formation in the early universe (if some such sources have not been identified already with our probe or that of Vanzella et al. 2019, 2020).
For example, the E-MOSAICS project predicts that proto-globular clusters in formation should be visible in the HFF observations at 17.5 mag and 16.5 mag, respectively, while the model of Boylan-Kolchin (2017, 2018) predicts 3, 10, and 3 forming proto-globular clusters at 17.5 mag, 16.5 mag, and 15.5 mag. Tantalizingly enough, our analysis of the Bouwens et al. (2021a) observational results shows some candidates with plausible proto-globular cluster sizes at 15 mag (see lowest panel of Figure 5) in the same luminosity range where such sources are predicted.
Despite plausible consistency between our search results and the predictions of e.g. the E-MOSAICS project, the present results already place strong constraints on more extreme globular cluster formation scenarios, e.g., those involving substantial () mass loss after the initial formation burst. Our results appear to rule out those scenarios entirely. While this inference is contingent on forming proto-globular clusters having sufficiently high surface brightness to be identified as separate from the host galaxy (see also Bastian & Lardo 2015; Kruijssen 2015; Webb & Leigh 2015; Martocchia et al. 2017 for further evidence), such issues are unlikely to cause all such forming globular clusters to be hidden.
As in our own previous work or other work (i.e., Bouwens et al. 2017a, 2021a; Vanzella et al. 2017a, 2017b, 2019; Johnson et al. 2017), one should treat the present results with some caution (§5.3) as a result of the impact of uncertainties in the lensing models. The present results require that parametric lensing models be predictive to magnification factors to 30. Fortunately, this condition is likely satisfied given the end-to-end simulation+recovery results obtained by Meneghetti et al. (2017) and own tests comparing the HFF models.
In the future, we aim to gain more insight into the nature of small star-forming galaxies in the distant universe through more extensive spectroscopic observations, larger samples, and NIRSPEC/IFU observations with JWST.
References
- Adamo et al. (2011) Adamo, A., Östlin, G., & Zackrisson, E. 2011, MNRAS, 417, 1904
- Adamo et al. (2013) Adamo, A., Östlin, G., Bastian, N., et al. 2013, ApJ, 766, 105
- Bastian et al. (2005) Bastian, N., Gieles, M., Efremov, Y. N., & Lamers, H. J. G. L. M. 2005, A&A, 443, 79
- Bastian et al. (2006) Bastian, N., Emsellem, E., Kissler-Patig, M., & Maraston, C. 2006, A&A, 445, 471
- Bastian (2008) Bastian, N. 2008, MNRAS, 390, 759
- Bastian et al. (2013) Bastian, N., Schweizer, F., Goudfrooij, P., Larsen, S. S., & Kissler-Patig, M. 2013, MNRAS, 431, 1252
- Bastian & Lardo (2015) Bastian, N., & Lardo, C. 2015, MNRAS, 453, 357
- Baumgardt & Makino (2003) Baumgardt, H., & Makino, J. 2003, MNRAS, 340, 227
- Baumgardt & Hilker (2018) Baumgardt, H., & Hilker, M. 2018, MNRAS, 478, 1520
- Bouwens et al. (2004) Bouwens, R. J., Illingworth, G. D., Blakeslee, J. P., Broadhurst, T. J., & Franx, M. 2004, ApJ, 611, L1
- Bouwens et al. (2011) Bouwens, R. J., Illingworth, G. D., Oesch, P. A., et al. 2011, ApJ, 737, 90
- Bouwens et al. (2015) Bouwens, R. J., Illingworth, G. D., Oesch, P. A., et al. 2015, ApJ, 803, 34
- Bouwens et al. (2017) Bouwens, R. J., Illingworth, G. D., Oesch, P. A., et al. 2017a, ApJ, 843, 41
- Bouwens et al. (2017) Bouwens, R. J., Oesch, P. A., Illingworth, G. D., Ellis, R. S., & Stefanon, M. 2017b, ApJ, 843, 129
- Bouwens et al. (2017) Bouwens, R. J., Illingworth, G. D., Oesch, P. A., et al. 2017c, arXiv:1711.02090
-
Bouwens et al. (2021a)
Bouwens, R. J., Illingworth, G.D., van Dokkum, P.G., et al. 2021a, ApJ, submitted
-
Bouwens et al. (2021b)
Bouwens, R. J., Oesch, P. A., Stefanon, M., et al. 2021b, ApJ, in press, arXiv:2102.07775
- Boylan-Kolchin (2017) Boylan-Kolchin, M. 2017, MNRAS, 472, 3120
- Boylan-Kolchin (2018) Boylan-Kolchin, M. 2018, MNRAS, 479, 332
- Brodie & Strader (2006) Brodie, J. P., & Strader, J. 2006, ARA&A, 44, 193
- Brodie et al. (2011) Brodie, J. P., Romanowsky, A. J., Strader, J., & Forbes, D. A. 2011, AJ, 142, 199
- Cabrera-Ziri et al. (2014) Cabrera-Ziri, I., Bastian, N., Davies, B., et al. 2014, MNRAS, 441, 2754
- Cabrera-Ziri et al. (2016) Cabrera-Ziri, I., Bastian, N., Hilker, M., et al. 2016, MNRAS, 457, 809
- Cappellari et al. (2011) Cappellari, M., Emsellem, E., Krajnović, D., et al. 2011, MNRAS, 413, 813
- Chilingarian et al. (2009) Chilingarian, I., Cayatte, V., Revaz, Y., et al. 2009, Science, 326, 1379
- Coe et al. (2015) Coe, D., Bradley, L., & Zitrin, A. 2015, ApJ, 800, 84
- Dahle et al. (2016) Dahle, H., Aghanim, N., Guennou, L., et al. 2016, A&A, 590, L4
- de Jong & Lacey (2000) de Jong, R. S., & Lacey, C. 2000, ApJ, 545, 781
- D’Ercole et al. (2008) D’Ercole, A., Vesperini, E., D’Antona, F., McMillan, S. L. W., & Recchi, S. 2008, MNRAS, 391, 825
- Dessauges-Zavadsky et al. (2017) Dessauges-Zavadsky, M., Schaerer, D., Cava, A., Mayer, L., & Tamburello, V. 2017, ApJ, 836, L22
- Elmegreen et al. (2012) Elmegreen, B. G., Malhotra, S., & Rhoads, J. 2012a, ApJ, 757, 9
- Elmegreen et al. (2012) Elmegreen, B. G., Zhang, H.-X., & Hunter, D. A. 2012b, ApJ, 747, 105
- Elmegreen et al. (2016) Elmegreen, D. M., Elmegreen, B. G., Sánchez Almeida, J., et al. 2016, ApJ, 825, 145
- Elmegreen (2017) Elmegreen, B. G. 2017, ApJ, 836, 80
- English & Freeman (2003) English, J. & Freeman, K. C. 2003, AJ, 125, 1124
- Evstigneeva et al. (2007) Evstigneeva, E. A., Drinkwater, M. J., Jurek, R., et al. 2007, MNRAS, 378, 1036
- Faber (1973) Faber, S. M. 1973, ApJ, 179, 423
- Firth et al. (2007) Firth, P., Drinkwater, M. J., Evstigneeva, E. A., et al. 2007, MNRAS, 382, 1342
- Fisher et al. (2017) Fisher, D. B., Glazebrook, K., Damjanov, I., et al. 2017, MNRAS, 464, 491
- Forbes & Bridges (2010) Forbes, D. A., & Bridges, T. 2010, MNRAS, 404, 1203
- Franx et al. (1997) Franx, M., Illingworth, G. D., Kelson, D. D., van Dokkum, P. G., & Tran, K.-V. 1997, ApJ, 486, L75
- Francis et al. (2012) Francis, K. J., Drinkwater, M. J., Chilingarian, I. V., Bolt, A. M., & Firth, P. 2012, MNRAS, 425, 325
- Goddard et al. (2010) Goddard, Q. E., Bastian, N., & Kennicutt, R. C. 2010, MNRAS, 405, 857
- Goodman (1984) Goodman, J. 1984, ApJ, 280, 298
- Harris et al. (2013) Harris, W. E., Harris, G. L. H., & Alessi, M. 2013, ApJ, 772, 82
- Haşegan et al. (2005) Haşegan, M., Jordán, A., Côté, P., et al. 2005, ApJ, 627, 203
- Hills (1980) Hills, J. G. 1980, ApJ, 235, 986
- Holwerda et al. (2015) Holwerda, B. W., Bouwens, R., Oesch, P., et al. 2015, ApJ, 808, 6
- Ishigaki et al. (2018) Ishigaki, M., Kawamata, R., Ouchi, M., et al. 2018, ApJ, 854, 73
- Isobe et al. (2020) Isobe, Y., Ouchi, M., Kojima, T., et al. 2020, submitted, arXiv:2004.11444
- Johnson et al. (2017) Johnson, T. L., Rigby, J. R., Sharon, K., et al. 2017, ApJ, 843, L21
- Jones et al. (2010) Jones, T. A., Swinbank, A. M., Ellis, R. S., Richard, J., & Stark, D. P. 2010, MNRAS, 404, 1247
- Lada & Lada (2003) Lada, C. J., & Lada, E. A. 2003, ARA&A, 41, 57
- Livermore et al. (2012) Livermore, R. C., Jones, T., Richard, J., et al. 2012, MNRAS, 427, 688
- Livermore et al. (2015) Livermore, R. C., Jones, T. A., Richard, J., et al. 2015, MNRAS, 450, 1812
- Livermore et al. (2017) Livermore, R., Finkelstein, S., Lotz, J. 2017, ApJ, 835, 113
- Lotz et al. (2017) Lotz, J. M., Koekemoer, A., Coe, D., et al. 2017, ApJ, 837, 97
- Kawamata et al. (2015) Kawamata, R., Ishigaki, M., Shimasaku, K., Oguri, M., & Ouchi, M. 2015, ApJ, 804, 103
- Kawamata et al. (2018) Kawamata, R., Ishigaki, M., Shimasaku, K., et al. 2018, ApJ, 855, 4
- Kennicutt et al. (2003) Kennicutt, R. C., Jr., Armus, L., Bendo, G., et al. 2003, PASP, 115, 928
- Kikuchihara et al. (2020) Kikuchihara, S., Ouchi, M., Ono, Y., et al. 2020, ApJ, 893, 60
- Kruijssen (2014) Kruijssen, J. M. D. 2014, Classical and Quantum Gravity, 31, 244006
- Kruijssen (2015) Kruijssen, J. M. D. 2015, MNRAS, 454, 1658
- Kruijssen et al. (2019) Kruijssen, J. M. D., Pfeffer, J. L., Crain, R. A., et al. 2019, MNRAS, 486, 3134
- Ma et al. (2018) Ma, X., Hopkins, P. F., Boylan-Kolchin, M., et al. 2018, MNRAS, 477, 219
- Ma et al. (2020) Ma, X., Grudić, M. Y., Quataert, E., et al. 2020, MNRAS, 493, 4315
- Maraston et al. (2004) Maraston, C., Bastian, N., Saglia, R. P., et al. 2004, A&A, 416, 467
- Martocchia et al. (2017) Martocchia, S., Bastian, N., Usher, C., et al. 2017, MNRAS, 468, 3150
- McDermid et al. (2015) McDermid, R. M., Alatalo, K., Blitz, L., et al. 2015, MNRAS, 448, 3484
- Meneghetti et al. (2017) Meneghetti, M., Natarajan, P., Coe, D., et al. 2017, MNRAS, 472, 3177
- Meurer et al. (1995) Meurer, G. R., Heckman, T. M., Leitherer, C., et al. 1995, AJ, 110, 2665
- Meylan (1993) Meylan, G. 1993, The Globular Cluster-Galaxy Connection, 48, 588
- Mieske et al. (2007) Mieske, S., Hilker, M., Jordán, A., Infante, L., & Kissler-Patig, M. 2007, A&A, 472, 111
- Misgeld et al. (2008) Misgeld, I., Mieske, S., & Hilker, M. 2008, A&A, 486, 697
- Misgeld et al. (2011) Misgeld, I., Mieske, S., Hilker, M., et al. 2011, A&A, 531, A4
- Murray (2009) Murray, N. 2009, ApJ, 691, 946
- Norris et al. (2014) Norris, M., Kannappan, S., Forbes, D.A., et al. 2014, MNRAS, arXiv:1406.6065v1
- Oesch et al. (2010) Oesch, P. A., Bouwens, R. J., Illingworth, G. D., et al. 2010a, ApJ, 709, L16
- Oke & Gunn (1983) Oke, J. B., & Gunn, J. E. 1983, ApJ, 266, 713
- Ono et al. (2013) Ono, Y., Ouchi, M., Curtis-Lake, E., et al. 2013, ApJ, 777, 155
- Overzier et al. (2008) Overzier, R. A., Heckman, T. M., Kauffmann, G., et al. 2008, ApJ, 677, 37
- Papaderos et al. (2008) Papaderos, P., Guseva, N. G., Izotov, Y. I., et al. 2008, A&A, 491, 113
- Pfeffer et al. (2018) Pfeffer, J., Kruijssen, J. M. D., Crain, R. A., et al. 2018, MNRAS, 475, 4309
- Pfeffer et al. (2019) Pfeffer, J., Bastian, N., Crain, R. A., et al. 2019, MNRAS, 487, 4550
- Planck Collaboration et al. (2016) Planck Collaboration, Ade, P. A. R., Aghanim, N., et al. 2016, A&A, 594, A13
- Ploeckinger et al. (2019) Ploeckinger, S., Schaye, J., Hacar, A., et al. 2019, MNRAS, 484, 4379
- Pozzetti et al. (2019) Pozzetti, L., Maraston, C., & Renzini, A. 2019, MNRAS, 485, 5861
- Rejkuba et al. (2007) Rejkuba, M., Dubath, P., Minniti, D., & Meylan, G. 2007, A&A, 469, 147
- Renzini et al. (2015) Renzini, A., D’Antona, F., Cassisi, S., et al. 2015, MNRAS, 454, 4197
- Renzini (2017) Renzini, A. 2017, MNRAS, 469, L63
- Rodríguez-Zaurín et al. (2011) Rodríguez-Zaurín, J., Arribas, S., Monreal-Ibero, A., et al. 2011, A&A, 527, A60
- Ribeiro et al. (2017) Ribeiro, B., Le Fèvre, O., Cassata, P., et al. 2017, A&A, 608, A16
- Schaerer & Charbonnel (2011) Schaerer, D., & Charbonnel, C. 2011, MNRAS, 413, 2297
- Schaye et al. (2015) Schaye, J., Crain, R. A., Bower, R. G., et al. 2015, MNRAS, 446, 521 T., Trenti, M., et al. 2014, ApJ, 786, 57
- Shibuya et al. (2015) Shibuya, T., Ouchi, M., & Harikane, Y. 2015, ApJS, 219, 15
- Shin et al. (2013) Shin, J., Kim, S. S., Yoon, S.-J., & Kim, J. 2013, ApJ, 762, 135
- Silva-Villa & Larsen (2011) Silva-Villa, E., & Larsen, S. S. 2011, A&A, 529, A25
- Simon & Geha (2007) Simon, J. D., & Geha, M. 2007, ApJ, 670, 313
- Spitler & Forbes (2009) Spitler, L. R., & Forbes, D. A. 2009, MNRAS, 392, L1
- Swinbank et al. (2009) Swinbank, A. M., Webb, T. M., Richard, J., et al. 2009, MNRAS, 400, 1121
- Swinbank et al. (2012) Swinbank, A. M., Smail, I., Sobral, D., et al. 2012, ApJ, 760, 130
- van der Wel et al. (2014) van der Wel, A., Franx, M., van Dokkum, P. G., et al. 2014, ApJ, 788, 28
- van Dokkum et al. (2015) van Dokkum, P. G., Abraham, R., Merritt, A., et al. 2015, ApJ, 798, L45
- Vanzella et al. (2017) Vanzella, E., Calura, F., Meneghetti, M., et al. 2017a, MNRAS, 467, 4304
- Vanzella et al. (2017) Vanzella, E., Castellano, M., Meneghetti, M., et al. 2017b, ApJ, 842, 47
- Vanzella et al. (2019) Vanzella, E., Calura, F., Meneghetti, M., et al. 2019, MNRAS, 483, 3618
- Vanzella et al. (2020) Vanzella, E., Caminha, G. B., Calura, F., et al. 2020, MNRAS, 491, 1093
- Vanzi et al. (2008) Vanzi, L., Cresci, G., Telles, E., & Melnick, J. 2008, A&A, 486, 393
- Webb & Leigh (2015) Webb, J. J., & Leigh, N. W. C. 2015, MNRAS, 453, 3278
- Wisnioski et al. (2012) Wisnioski, E., Glazebrook, K., Blake, C., et al. 2012, MNRAS, 422, 3339
- Wuyts et al. (2014) Wuyts, E., Rigby, J. R., Gladders, M. D., et al. 2014, ApJ, 781, 61
- Zick et al. (2018) Zick, T. O., Weisz, D. R., & Boylan-Kolchin, M. 2018, MNRAS, 477, 480
- Zick et al. (2020) Zick, T. O., Weisz, D. R., Ribeiro, B., et al. 2020, MNRAS, 493, 5653
- Zitrin et al. (2011) Zitrin, A., Broadhurst, T., Coe, D., et al. 2011, MNRAS, 413, 1753