Large tunability of strain in \ceWO3 single-crystal microresonators
controlled by exposure to \ceH2 gas
Abstract
This document is the Accepted Manuscript version of a
Published Work that appeared in final form in ACS Applied
Materials & Interfaces, copyright © American Chemical
Society after peer review and technical editing by the
publisher. To access the final edited and published work see
https://pubs.acs.org/doi/10.1021/acsami.9b14501.
Strain engineering is one of the most effective approaches to
manipulate the physical state of materials, control their electronic
properties, and enable crucial functionalities. Because of their
rich phase diagrams arising from competing ground states, quantum
materials are an ideal playground for on-demand material control,
and can be used to develop emergent technologies, such as adaptive
electronics or neuromorphic computing. It was recently suggested
that complex oxides could bring unprecedented functionalities to the
field of nanomechanics, but the possibility of precisely controlling
the stress state of materials is so far lacking. Here we
demonstrate the wide and reversible manipulation of the stress state
of single-crystal \ceWO3 by strain engineering controlled by
catalytic hydrogenation. Progressive incorporation of hydrogen in
freestanding ultra-thin structures determines large variations of
their mechanical resonance frequencies and induces static
deformation. Our results demonstrate hydrogen doping as a new
paradigm to reversibly manipulate the mechanical properties of
nanodevices based on materials control.
Introduction
Complex oxides are characterised by a rich energy landscape governed by multiple thermodynamic parameters, including temperature, stress, chemical potential, and electromagnetic fields.MacManus-Driscoll et al. (2008); Rondinelli et al. (2012); Ramesh and Schlom (2019) Phase competition in these quantum materials leads to giant responses to external stimuli associated with large and non-linear susceptibilities. Chemical doping is a powerful control parameter to switch between their competing phases, and oxygen vacancies have often been employed to induce changes in electrical, structural or magnetic properties, although with limited reversibility.Manca et al. (2015); Swallow et al. (2017); Yao et al. (2017); Zhang et al. (2018) Hydrogen intercalation is an alternative route to effectively control the ground state of these materials, as an example, by stabilizing metallic phases and promoting lattice symmetry,Kiliç and Zunger (2002); Wei et al. (2012); Yoon et al. (2016) but the possibility of precisely controlling the stress state is so far lacking. A particularly interesting system with multiple competing ground states regulated by anharmonic couplings between different structural distortions is \ceWO3.Hamdi et al. (2016) Its complex energy landscape determines large changes of its lattice and electronic properties in response to chemical doping,Mattoni et al. (2018a) electric fields,Leng et al. (2017) and epitaxial strain.Du et al. (2014) These characteristics have important technological applications, such as electrochromic devices, smart windows,Svensson and Granqvist (1984, 1985); Granqvist (2000) and gas sensing where record-holding pmm sensitivity to \ceH2 was recently demonstrated.Mattoni et al. (2018b)
Here we show that the electromechanical response of freestanding single-crystal \ceWO3 microbridges can be reversibly controlled by hydrogen gas at room temperature. The incorporation of hydrogen in \ceWO3 thin films induces a change in the out-of-plane lattice constant up to 1.3%, an effect that we use to tune the mechanical resonances of \ceWO3 microbridges as their stress state changes from tensile to compressive.
Results and Discussion
This experiment is performed on a 50 nm-thick single crystal \ceWO3 film grown on top of a Ti-terminated \ceSrTiO3 (001) substrate. The \ceWO3 thin film shows a flat surface with a step-and-terrace morphology that indicates good heteroepitaxial growth (film characterisation in Supporting Information, Sec. I). A small amount of Pt, of equivalent thickness 0.2 nm, is then deposited by e-beam evaporation to enable hydrogen intercalation, as described in the Methods section and in Ref. 18. We note that the hydrogen incorporation rate can be regulated by the amount of Pt catalyst: here we choose to use a low amount in order to slow down the process and monitor it as a function of time. The single-crystal character of \ceWO3 is confirmed by X-ray characterisation, where narrow rocking curves and reciprocal space maps show that the film is coherently strained to the substrate lattice. – scans along the (001) and (002) peaks of \ceWO3 present finite size oscillations, indicating high crystal quality (see Supporting Information, Sec. II). From the X-ray data we extract a -axis length of 3.70 Å, in agreement with previous reports of \ceWO3 thin films on \ceSrTiO3.Mattoni et al. (2018a) Considering that in its bulk pseudocubic phase \ceWO3 has a lattice constant of about 3.77 Å,Crichton et al. (2003) epitaxial lock imposed by the substrate determines an elongation of the and axes of about 3.4 %, with a consequent decrease of the -axis that in our film amounts to %. The film is hence under in-plane tensile stress. This analysis indicates that the unit cell volume in thin films is slightly larger than in bulk. This is expected and could be related to two mechanism: a Poisson’s ratio lower than 0.5 and the presence of oxygen vacancies. While the former contribution is present in the vast majority of compounds, the presence of oxygen vacancies is almost unavoidable in \ceWO3 thin films with optimal structural quality,Mattoni et al. (2018a) and most probably constitute one of the main relaxation mechanism for epitaxial strain.
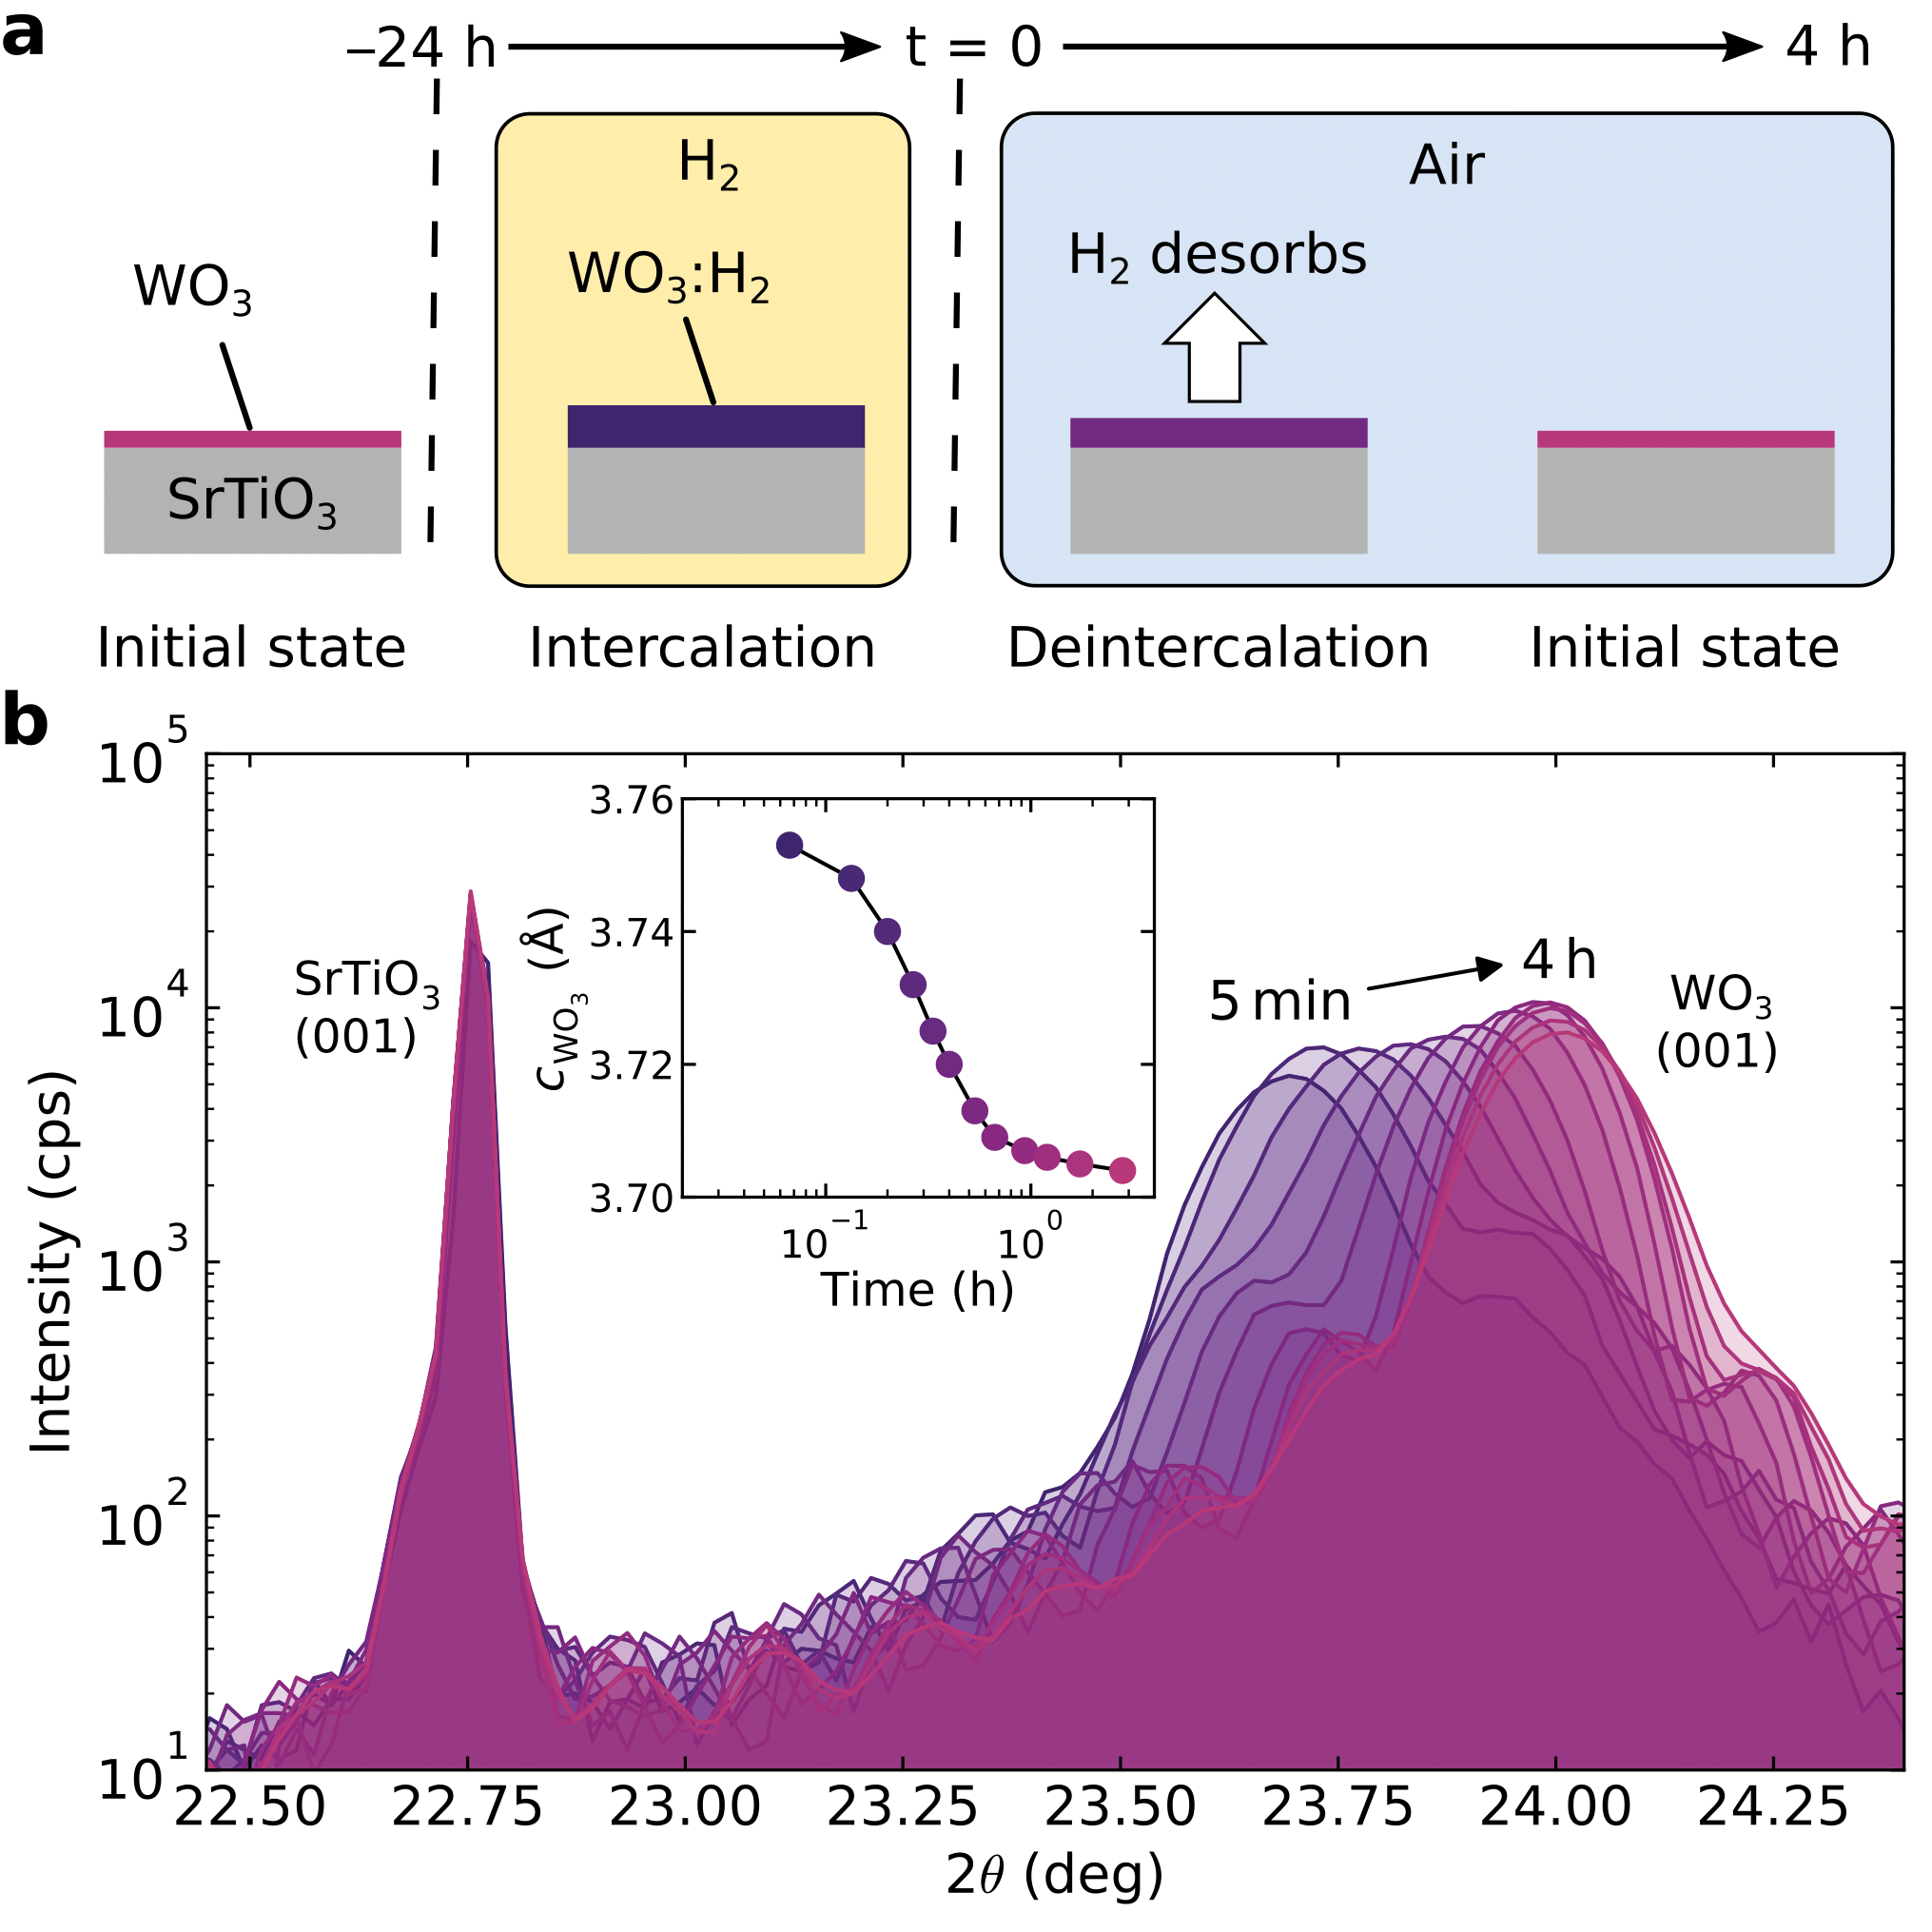
We measure the structural response of \ceWO3 to \ceH2 gas by monitoring changes in its -axis parameter by X-ray diffraction. The experimental procedure comprises the two steps illustrated in Figure 1(a): The sample is initially placed at room temperature in a sealed chamber filled with 1 bar of a 20 % \ceH2/\ceAr mixture for (intercalation) to achieve a stable (saturated) hydrogen doping condition. When transferred to the XRD setup, the sample is exposed to air at . In this step, hydrogen is released from the \ceWO3 lattice (deintercalation) and the material progressively regains its initial state. Fig. 1(b) shows several – scans taken during hydrogen deintercalation, where a progressive shift of the \ceWO3(001) peak and its finite size oscillations occurs. This shift corresponds to a change in \ceWO3 -axis parameter which is reported as a function of time in Fig. 1(b). In the hydrogen-doped state at min we measure Å, indicating an increase of about % with respect to the undoped condition. Upon hydrogen deintercalation, progressively decreases and recovers the value of the initial state after about 1 h. This indicates that hydrogen determines a large and reversible expansion of the \ceWO3 lattice, with a magnitude comparable to what has been previously reported upon the formation of oxygen vacancies or intercalation of alkali metals.Crichton et al. (2003); Dass et al. (2003); Mattoni et al. (2018a)
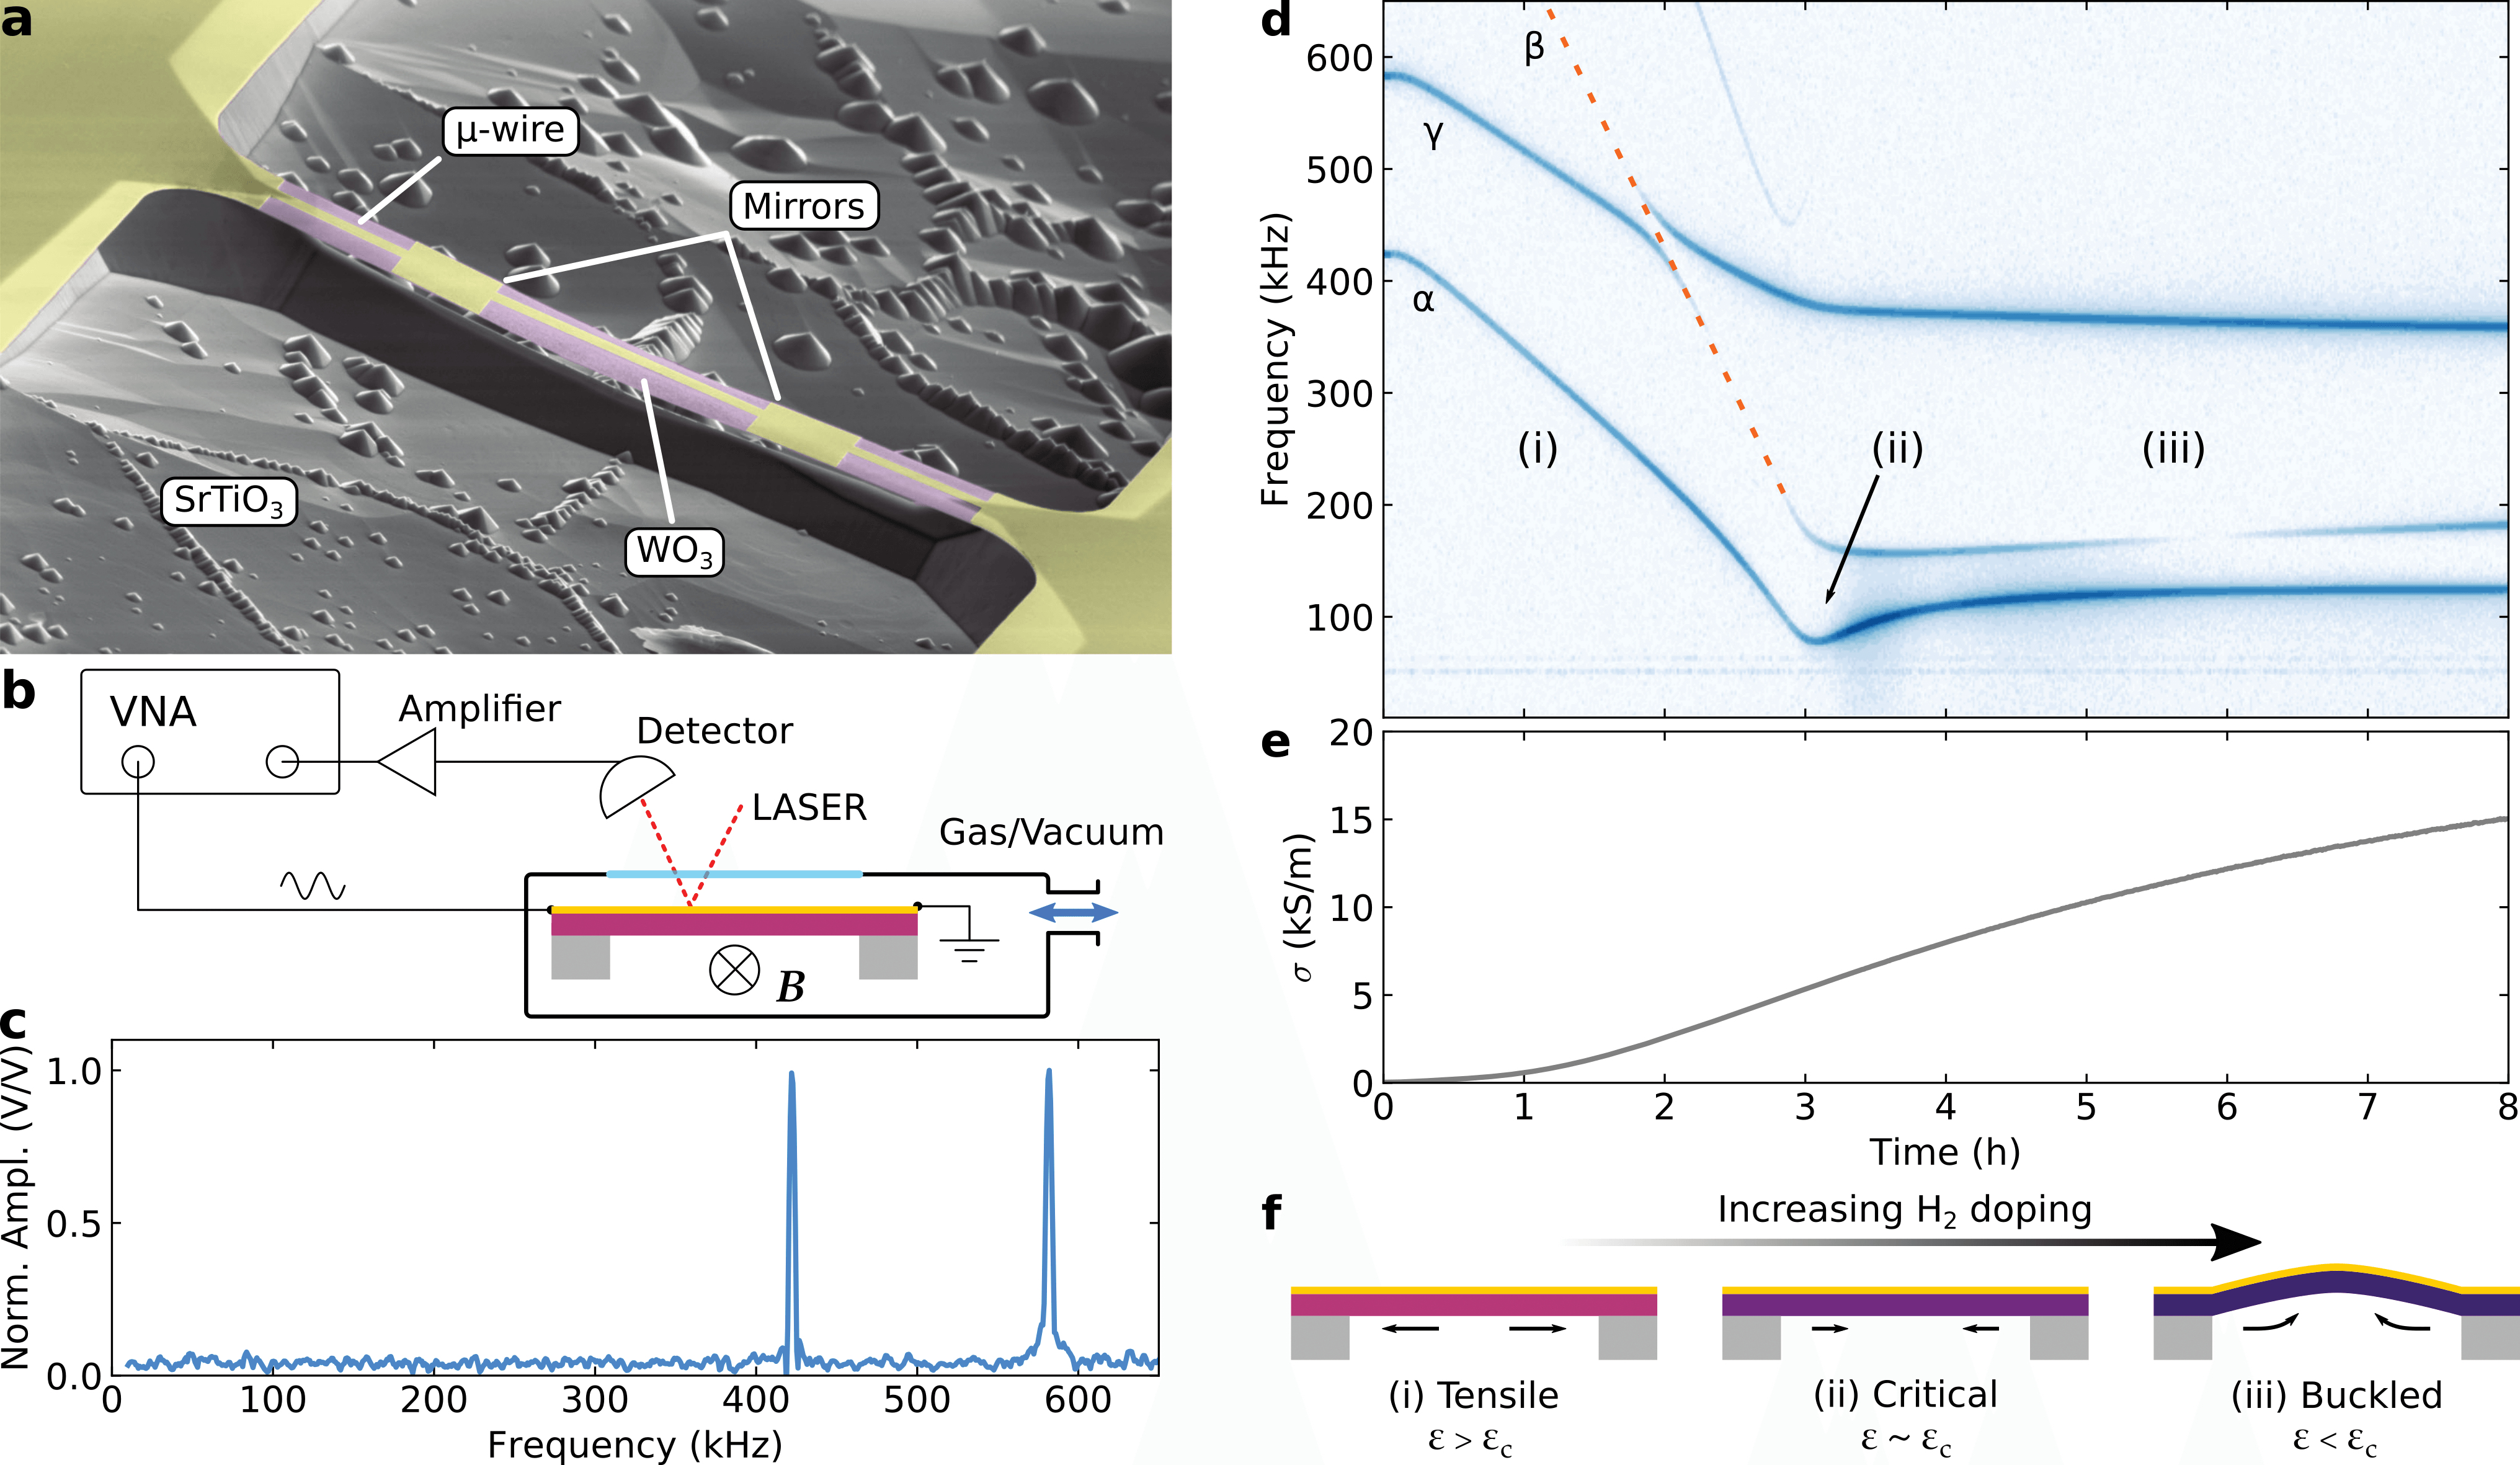
The large lattice expansion induced by hydrogen doping offers the interesting possibility to control the mechanical stress of the material in a reversible manner. To explore this possibility, we realize \ceWO3 freestanding microbridges. The structures are fabricated by using lithographic patterning and combined dry/wet etching processes in order to remove the \ceSrTiO3 substrate, a procedure similar to the one used in previous reports.Manca et al. (2015) (see also Methods section and Supporting Information, Sec. III). Figure 2(a) shows the false-colour micrograph of a typical \ceWO3 microbridge acquired by scanning electron microscopy. The freestanding structure (5 µm-wide, 110 µm-long) is composed of a 50 nm-thick \ceWO3 crystalline thin film (purple), and 50 nm-thick gold elements (yellow) comprising two mirrors and a 1 µm-wide microwire that runs throughout the freestanding region. The mirrors are used to reflect the laser light employed to measure the mechanical motion of the bridge in an optical lever geometry (Fig. 2(b)), while the microwire provides a low-impedance electrical channel required for the electrical excitation. By applying an alternating electrical current through the gold wire, the microstructure is mechanically actuated via the magnetomotive and electrothermal mechanisms (see Methods). The typical mechanical spectra of a pristine 110 µm-long microbridge is shown in Fig. 2(c). We also fabricated microbridges of other lengths between 50 and 110 µm, all of which show similar spectra (see Supporting Information, Sec. IV). The fundamental resonance mode of the longer beams shows a better signal-to-noise ratio compared to the shorter ones, as expected due to a larger deflection. Furthermore, a higher quality factor is observed, which is attributed to lower clamping losses (see Supporting Information, Sec. V). For this reason, we focus on the 110 µm-long microbridge to investigate the changes induced by hydrogen incorporation.
The simultaneous mechanical and electrical characterization is performed in a vacuum chamber with variable gas environment, optical access, and a controlled sample temperature fixed at 25∘C. The \ceWO3 device is initially in an undoped condition and we measure its mechanical spectrum as a function of time in Figure 2(d). Details of the optical setup employed in this experiment are reported in the Supporting Information, Sec VI. At we introduce a 20 % \ceH2/Ar mixture at low pressure (0.5 mbar) to follow the hydrogen intercalation dynamics with minimal damping of the mechanical motion. Hydrogen doping results in a dramatic change in the mechanical behaviour of the microbridge which can be divided into three distinct regions: (i) a steep decrease of the eigenfrequencies, (ii) a transitional regime, and (iii) a flat response. The lowest mechanical mode has a smooth behaviour across the different regions and corresponds to the first flexural mode, as discussed in the following. At the \ceWO3 microbridge is in a tensile strain state originating from the lattice mismatch with the \ceSrTiO3 substrate. In this condition, the structure can be schematically modelled as an ideal thin and long double-clamped beam where the flexural resonance frequencies are given by the Euler–Bernoulli equationTilmans et al. (1992)
| (1) |
with resonance frequency relative to the mode, axial strain , Young modulus , density , Poisson ratio , length , and thickness . and are numerical coefficients related to the mode shape. Eq. (1) shows that the mechanical eigenfrequencies of the microbridge change as a function of strain . In our experiment changes continuously over time due to the large \ceWO3 lattice expansion during hydrogen intercalation (Fig. 1). The most dramatic effect is observed in region (i), where the relaxation of the initial tensile strain results in a large drop of the resonance frequencies. According to Eq. (1) the frequency of the first flexural mode is expected to reach zero at the critical strain value
| (2) |
However, in real systems this is typically not observed because device asymmetry causes the frequency to reach a smooth minimum at the finite strain value .Kim and Dickinson (1986) In our experiment this occurs in region (ii) at , where the resonance frequency of the lowest mode shows a minimum at , about one fifth of its initial value. A further increase of the compressive strain causes out-of-plane buckling. This occurs in region (iii), where Eq. 1 is not applicable and the resonance frequency of increases again as the excess compressive strain energy is stored in the form of out-of-plane deformation (buckling). At the onset of the buckled state, the frequencies of the odd mechanical modes are expected to rise slightly,Kim and Dickinson (1986); Bouwstra and Geijselaers (1991); Nayfeh and Kreider (1995) consistent with the small frequency increase that undergoes in region (ii). Multiple higher-order modes are visible in the spectral map of Fig. 2(d), with frequencies above . Their frequencies cannot be represented by a simple string resonator because interfacial stress and non-uniform mass distribution play an important role. These resonances are probably related to torsional and flexural modes of even order which show different response to strain,Bouwstra and Geijselaers (1991) as discussed in the last part of this work. An avoided crossing between modes and occurs at around , indicating a strong coupling between the mechanical modes. This feature arises as each mode shows a different tuning slope with applied compressive stress.Bouwstra and Geijselaers (1991); Nayfeh and Kreider (1995); Lacarbonara et al. (2005) Finally, we note that the data reported in Fig. 2(d) are in good qualitative agreement with similar measurements performed during hydrogen deintercalation in air, thus showing good reversibility of the process (Supporting Information, Sec. VII).
During hydrogen intercalation we also measure the time dependence of the electrical conductivity of \ceWO3 (), which is reported in Fig. 2(e). In our device design, the conductivity of the microbridge is always determined by the gold microwire, whose constant electrical resistance (50 ) is much lower than that of \ceWO3 at any level of hydrogen doping. For this reason, we monitor on a separate region of the film close to the microbridge. The data shows the progressive metallization of the material due to electronic doping, in agreement with previous reports.Mattoni et al. (2018b) Hydrogen intercalation progresses smoothly during the whole experiment and saturation occurs only towards the end of the measured time span ( h). This indicates that between and h the amount of hydrogen in the \ceWO3 lattice is significantly increasing, even if the mechanical modes show a flat response. We note that, albeit the suspended \ceWO3 microbridge has a higher surface area exposed to \ceH2 gas compared to the clamped film, in both cases the \cePt catalyst is present only on the top surface, thus determining the same rate of hydrogen intercalation. Furthermore, the rate of hydrogen dynamics in this experiment is significantly longer than during the XRD measurements of Fig. 1 because of the low hydrogen pressure, and the different rates of intercalation and deintercalation.Mattoni et al. (2018b) The observed evolution of the microbridge mechanical states is schematically summarised in Fig. 2(f).
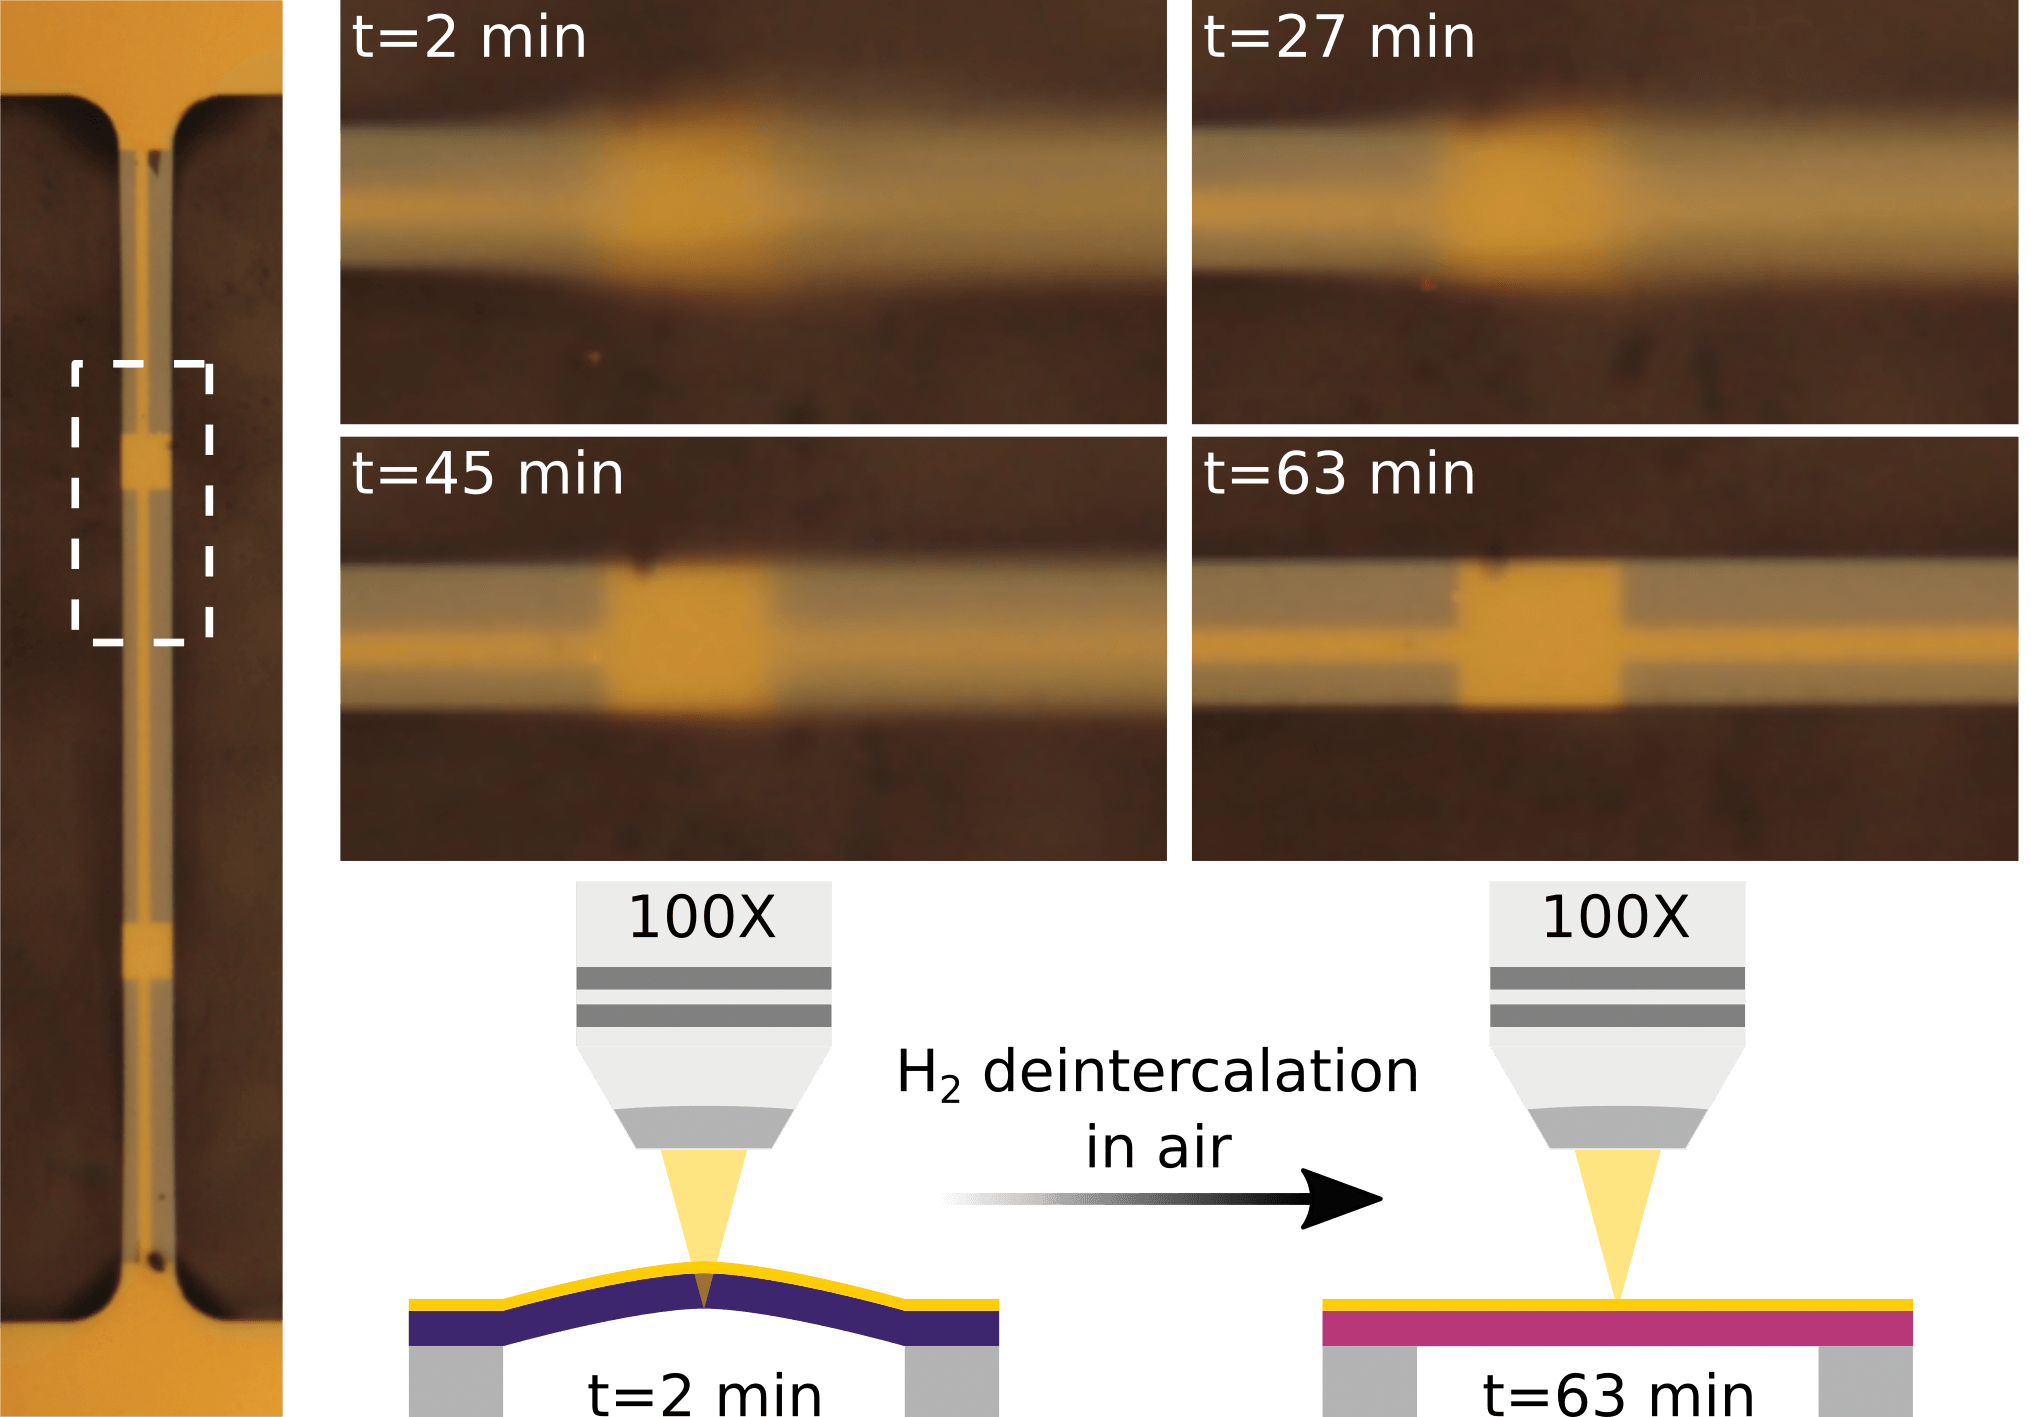
A strong evidence of the insurgence of a buckled state upon the intercalation of hydrogen can be obtained by optical microscopy. For this purpose, we report in Figure 3 a series of photographs showing one gold mirror of the microbridge. For this experiment the microbridge is first prepared in a saturated-doping state and at it is exposed to air at room temperature, the same procedure used in Fig. 1. The photographs are acquired at different times with an objective lens (depth of field of about ) whose focal plane is fixed to have in focus the clamped edges of the microbridge. In the initial state at min the mirror is out of focus, indicating static deformation in the direction perpendicular to the focal plane. The structure gradually gets more in focus at min, and at min, after about one hour in air, the whole microbridge is in focus, indicating the recovery of a flat state in the undoped conditions. We note that this time span of hydrogen deintercalation in 1 bar of air is comparable to the one of the XRD measurements of Fig. 1 and, as previously discussed, much faster than the slow dynamics observed in Fig. 2.
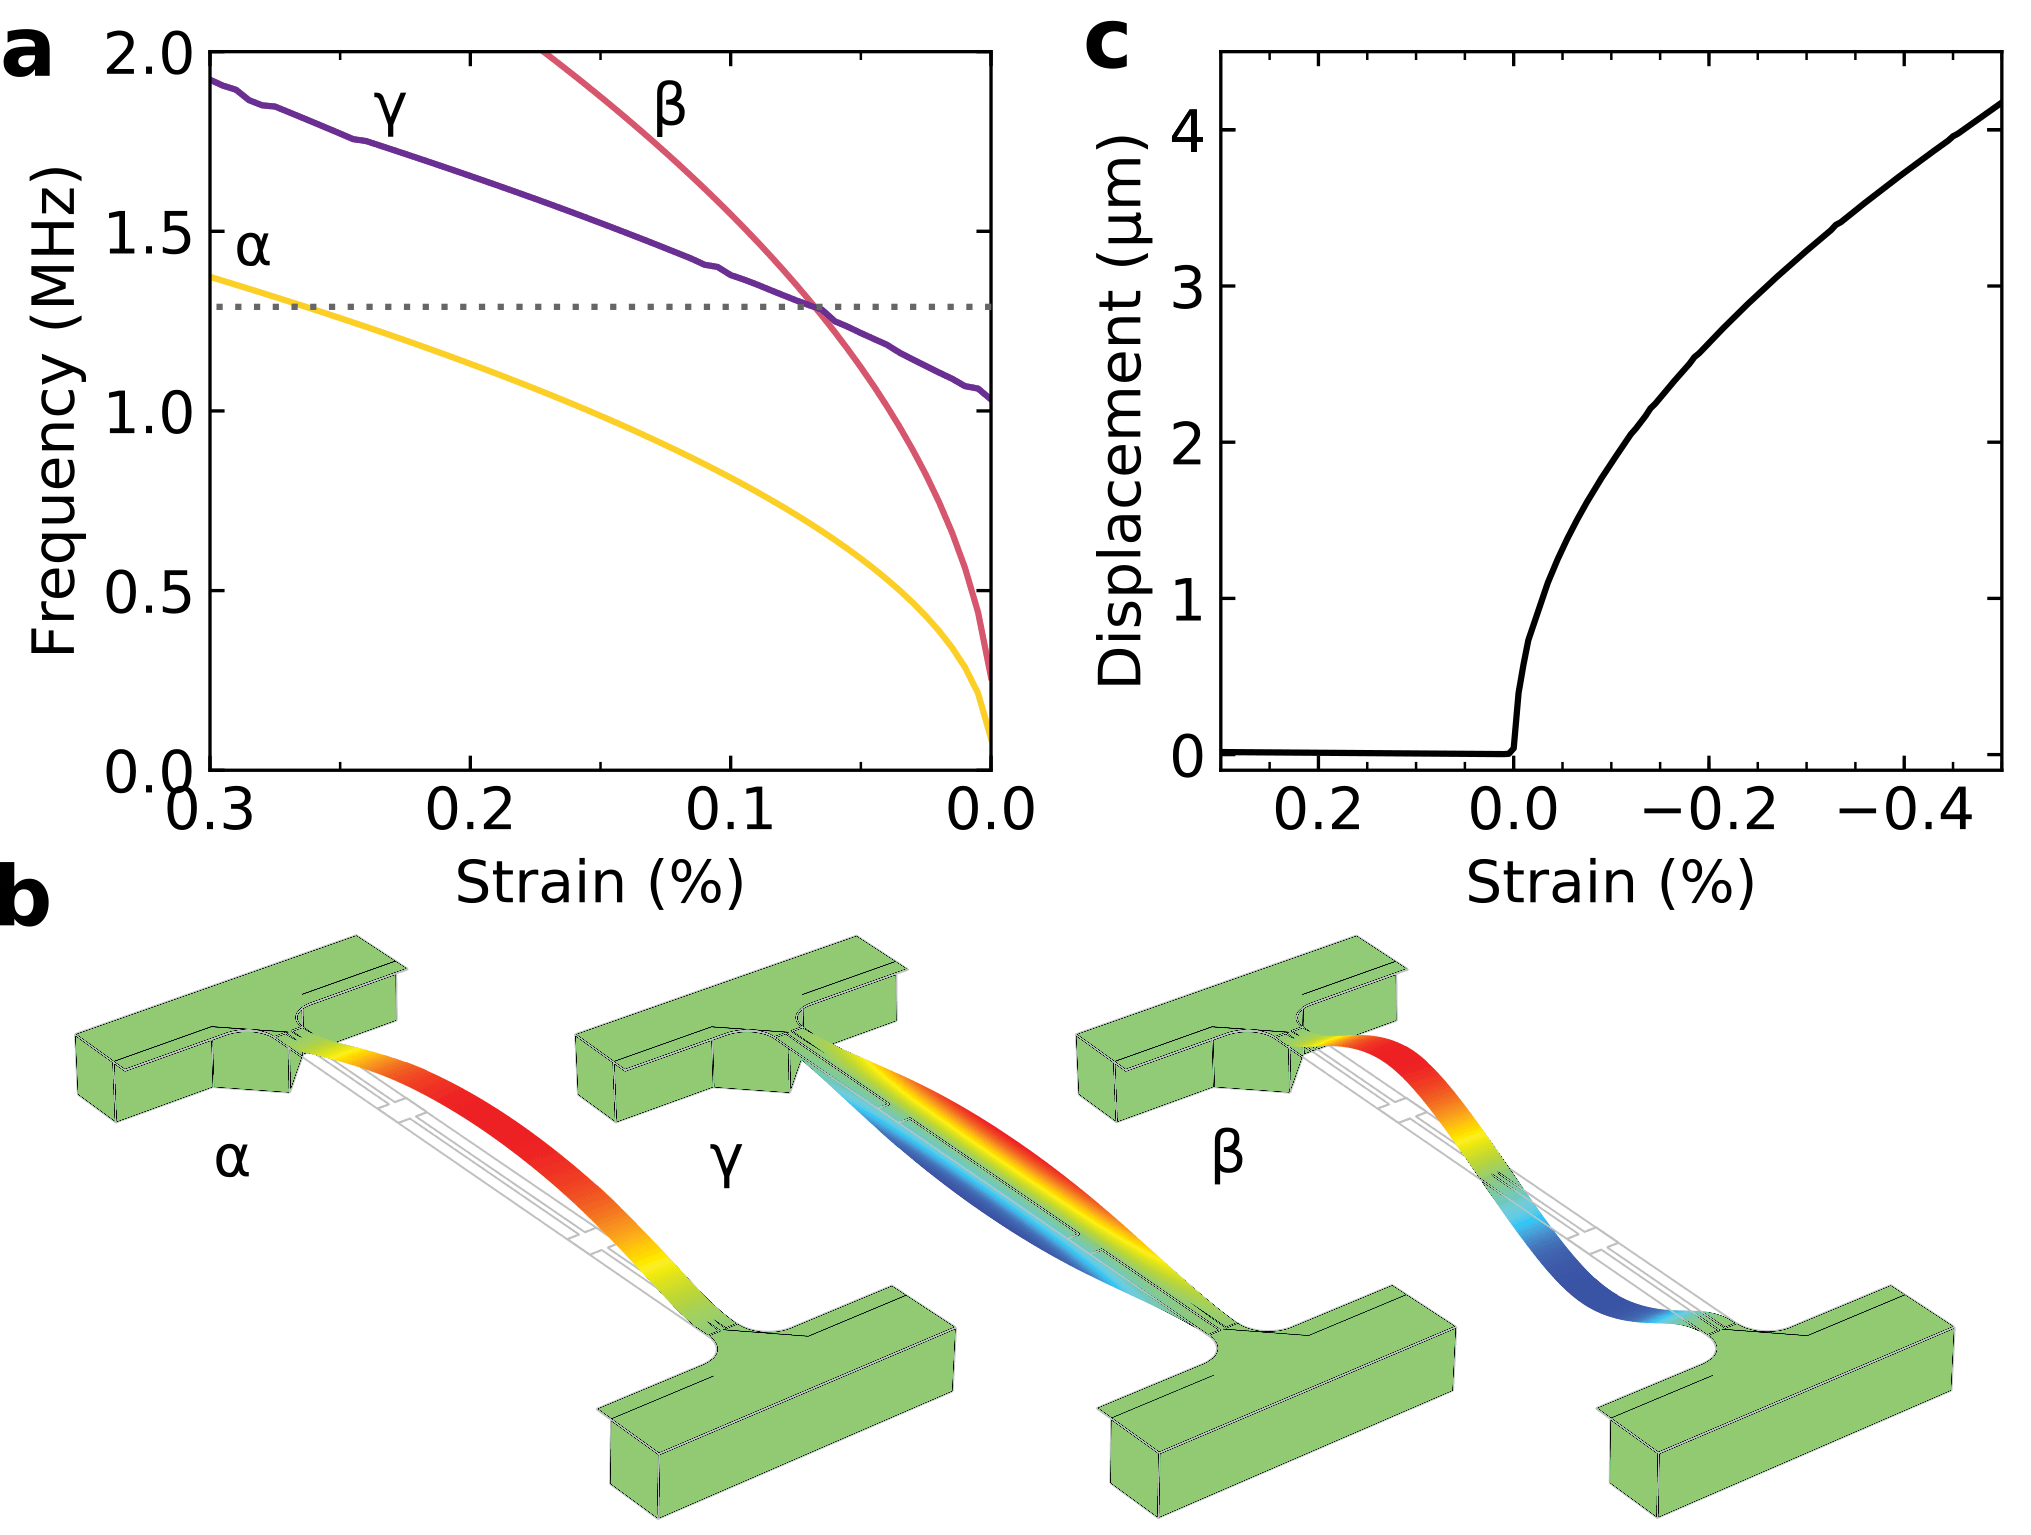
To better understand the changes of the \ceWO3 microbridge mechanical properties, we perform a finite element analysis as a function of strain (details in Methods and Supporting Information, Sec. VIII). The strain-dependence of the three lowest modes of the simulated device and the corresponding mode shapes are reported in Figures 4(a) and 4(b), respectively. The trend of the frequencies well represents our experimental data, with a rapid decrease of the first and second flexural modes , , and a slower variation of the torsional mode . Due to their different slope, and intersect at about MHz (intersection of mode with the grey dotted line). Also the presence of a mode crossing is consistent with our experimental results, where it occurs around MHz (Fig. 2(d)). We note that the experimental crossing frequency is about three times smaller than the simulated one, a discrepancy probably caused by the fact that we used values of and from first principles since no experimental data is available in literature.Liu and Fan (2018) However, the strain value corresponding to the crossing point in our simulations is weakly dependent on and (Supporting Information, Sec VIII), and can thus be used as a reference to estimate the in-plane strain of our experimental device. As an additional reference point, we note that in the experimental data of Fig. 2(d) the frequency of mode at corresponds approximately to the frequency of the avoided mode crossing. Using this information in Figure 4(a), we can estimate the initial strain of the microbridge to be about % (grey dotted line). Surprisingly, this value is rather small compared to the epitaxial mismatch of 3.4 % between \ceWO3 and the \ceSrTiO3 substrate. However, this can be explained considering that oxide compounds can easily accommodate stress with the formation of dislocations or point defects, such as oxygen vacancies. In particular, previous work shows that a low concentration of oxygen vacancies during the growth of \ceWO3 is sufficient to determine a relatively large lattice expansion, thus effectively relaxing the strain while maintaining a high crystal quality.Mattoni et al. (2018a)
It is possible to estimate the total experimental variation of the microbridge strain from the -axis expansion measured by XRD (Fig. 1). For this purpose, we note that by taking into account the different constraints for an epitaxial film and a freestanding structure we have
| (3) |
with out-of-plane lattice parameter in the undoped state , Poisson ratio , and total strain variation (see Supporting Information, Sec. IX). With the parameters employed in the simulation we obtain . Taking the initial microbridge strain as +0.25 % for the discussion above, we can estimate the strain in the saturated doping condition to be about . On the basis of this analysis, we calculate the vertical displacement of the microbridge centre as a function of strain in Fig. 4(c). For positive (tensile) strain the displacement is negligible, while beyond the critical value the structure relaxes the negative (compressive) strain by bending. At % the simulation gives a displacement of 4 µm, a value compatible with the optical measurements of Fig. 3. We note that the crossing point between tensile and compressive strain () lies at one third of the estimated range of experimental strain in Fig. 4(c). This is in good agreement with the experimental data of Fig. 2(d), where the critical condition of region (ii) lies also at about one third of both the total time and the electrical conductivity spans. Finally, we emphasize that in MEMS/NEMS devices it is particularly difficult to generate large compressive stress, a condition that usually requires additional components such as electrostatic actuators, piezoelectric elements or resistive heaters. These components present important drawbacks such as difficulty of focusing the actuation force on the resonator beam, hurdles in high-purity material fabrication, and insurgence of high temperatures. Our approach involving chemical doping proved to be a fundamental step forward over the present difficulties, providing a pathway for strong and localized strain-control of micro and nanodevices.
Conclusion
In summary, we demonstrated a new effective approach for controlling in situ the stress state of oxide-based freestanding structures. We achieved reversible control of the mechanical properties of single-crystal \ceWO3 microbridges, where the large lattice expansion due to hydrogen intercalation allowed us to finely tune the stress state from tensile to compressive, with a final buckled configuration. The proposed approach could be extended in two directions. By exploring the mechanical response of other oxides micromechanical systems to hydrogen doping. By realizing full-oxide heterostructures comprising a \ceWO3 layer acting as functional strain-tuning element. Our work highlights the potential of complex oxides to realise tunable nanomechanical systems or novel sensing devices.
Methods
Device fabrication:
The single-crystal 50 nm-thick \ceWO3 thin film on \ceTiO2-terminated \ceSrTiO3(001) substrate was grown by pulsed laser deposition using substrate temperature, oxygen pressure, laser fluence, and repetition rate. Pt was deposited by e-beam evaporation, its growth rate was monitored using a quartz microbalance. The process was stopped at an equivalent thickness of 0.2 nm. The microbridge structures were realised by a two-step electron-beam patterning using PMMA resist. The first patterning step was used to define the geometry of high-reflectivity mirrors and low-impedance microwire, followed by electron-beam evaporation of a \ceTi/Au overlayer and lift-off in acetone. The second patterning step defined the microbridge mesa and was followed by a 6 min \ceAr etching process (10 mA beam current, 500 eV beam energy, and mbar pure Ar atmosphere), during which a total of 60 nm of \ceWO3/SrTiO3 heterostructure was removed. The microbridges are finally made freestanding by selectively etching the \ceSrTiO3 substrate in a aqueous solution of \ceHF at for , resulting in a total of vertical distance between the etched substrate and the freestanding \ceWO3.
Measurement setup:
The electrical conductance measurements were performed using a four-probe DC configuration on a patterned square of the clamped \ceWO3 film. Contacts to the \ceWO3 film were provided by wire-bonding \ceTi / Au metal pads. The mechanical measurements were performed in a custom setup featuring a controlled gas atmosphere, temperature stability of 50 mK, motion detection of microstructures with optical lever technique and electrical pass-through. The optical images of Fig. 3 were acquired with an Olympus microscope equipped with an UMPlan FI 100X/0.90 objective lens.
Mechanical measurements:
The mechanical modes of the microbridges are excited by biasing the device with an AC voltage across the metal microwire of the form ). Two concurrent mechanisms determine the appearance of a mechanical force: magnetomotive and electro-thermal. The magnetomotive mechanism arises from the Lorentz force exerted on the current flowing in the microbridge by the magnetic field of a permanent magnet located in the sample chamber. The electrothermal mechanism is due to the periodic thermal expansion and contraction of the microbridge determined by periodic Joule heating. Since the resistance of the metal microwire () much lower than the one of the \ceWO3 bridge, even in its most-doped state, the current flowing in the wire does not depend on \ceWO3 doping conditions, hence providing a constant excitation magnitude. We note that the film thickness of 50 nm was chosen to have resonance frequencies falling within the accessible measurement range of our detector (2 MHz) and homogenous doping in the out-pf-plane direction. Thinner samples would improve both aspects, but with the risk of lowering the fabrication yield. The data in Fig. 2 were acquired using a HP4395a vector network analyser with a 1 kHz bandwidth and 5 averages taken over a period of . Details of the optical setup are reported in the Supporting Information, Sec. VI.
Finite element simulation:
Finite element analysis was performed in Comsol Multiphysics® using the structural mechanic module. The calculations employed the “static” and “prestressed eigenfrequency” solvers with a parametric sweep of the strain value. The mechanical parameters used to model the \ceWO3 microbridge are , and , while Au was modelled using the standard material library provided by the software. Further details and device geometry are discussed in the Supporting Information, Sec. VIII.
Contributions
N.M. and G.M. designed the experiment and performed the mechanical measurements. N.M. designed the device geometry and performed the finite element analysis. G.M. fabricated the device and performed the XRD, SEM, and optical measurements. M.P. provided the structural analysis leading to Eq. (3). W.J.V. designed and realized the mechanical characterization setup. N.M. and G.M. wrote the manuscript, with inputs from all authors.
Acknowledgement
We thank P. G. Steeneken, L. Pellegrino, and D. Marré for helpful discussions and valuable comments on the manuscript. This work was supported by The Netherlands Organisation for Scientific Research (NWO/OCW) as part of the Frontiers of Nanoscience program (NanoFront). This work was supported by the EU through the European Research Council Advanced grant No. 677458 (AlterMateria). We acknowledge received funding from the project Quantox of QuantERA ERA-NET Cofund in Quantum Technologies (Grant Agreement N. 731473) implemented within the EU H2020 Programme.
Supporting Infornation
Growth and surface analysis of \ceWO3 thin film, structural analysis by X-ray diffraction, device fabrication, pictures of the final devices, mechanical properties of microbridges of different lengths, details of the finite element model, and analytic model of strain in clamped and free-standing thin films.
References
- MacManus-Driscoll et al. (2008) Judith L. MacManus-Driscoll, Patrick Zerrer, Haiyan Wang, Hao Yang, Jongsik Yoon, Arnaud Fouchet, Rong Yu, Mark G Blamire, and Quanxi Jia, “Strain Control and Spontaneous Phase Ordering in Vertical Nanocomposite Heteroepitaxial Thin Films.” Nat. Mater. 7, 314–320 (2008).
- Rondinelli et al. (2012) James M. Rondinelli, Steven J. May, and John W. Freeland, “Control of Octahedral Connectivity in Perovskite Oxide Heterostructures: An Emerging Route to Multifunctional Materials Discovery,” MRS Bull. 37, 261–270 (2012).
- Ramesh and Schlom (2019) Ramamoorthy Ramesh and Darrell G. Schlom, “Creating Emergent Phenomena in Oxide Superlattices,” Nat. Rev. Mater. 2019 , 1 (2019).
- Manca et al. (2015) Nicola Manca, Luca Pellegrino, and Daniele Marré, “Reversible Oxygen Vacancies Doping in (La0.7,Sr0.3)MnO Microbridges by Combined Self-Heating and Electromigration,” Appl. Phys. Lett. 106, 203502 (2015), arXiv:1702.00826 .
- Swallow et al. (2017) Jessica G. Swallow, Jae Jin Kim, John M. Maloney, Di Chen, James F. Smith, Sean R. Bishop, Harry L. Tuller, and Krystyn J. Van Vliet, “Dynamic Chemical Expansion of Thin-Film non-Stoichiometric Oxides at Extreme Temperatures,” Nat. Mater. 16, 749–754 (2017).
- Yao et al. (2017) Lide Yao, Sampo Inkinen, and Sebastiaan Van Dijken, “Direct Observation of Oxygen Vacancy-Driven Structural and Resistive Phase Transitions in La2/3Sr1/3MnO3,” Nat. Commun. 8, 1–9 (2017).
- Zhang et al. (2018) Kelvin H. L. Zhang, Guoqiang Li, Steven R. Spurgeon, Le Wang, Pengfei Yan, Zhaoying Wang, Meng Gu, Tamas Varga, Mark E. Bowden, Zihua Zhu, Chongmin Wang, and Yingge Du, “Creation and Ordering of Oxygen Vacancies at WO3- and Perovskite Interfaces,” ACS Appl. Mater. Interfaces 10, 17480–17486 (2018).
- Kiliç and Zunger (2002) Çetin Kiliç and Alex Zunger, “n-Type Doping of Oxides by Hydrogen,” Appl. Phys. Lett. 81, 73–75 (2002).
- Wei et al. (2012) Jiang Wei, Heng Ji, Wenhua Guo, Andriy H. Nevidomskyy, and Douglas Natelson, “Hydrogen Stabilization of Metallic Vanadium Dioxide in Single-Crystal Nanobeams,” Nat. Nanotechnol. 7, 357–362 (2012).
- Yoon et al. (2016) Hyojin Yoon, Minseok Choi, Tae-Won W Lim, Hyunah Kwon, Kyuwook Ihm, Jong Kyu Kim, Si-Young Y Choi, and Junwoo Son, “Reversible Phase Modulation and Hydrogen Storage in Multivalent VO2 Epitaxial Thin Films,” Nat. Mater. 15, 1113–1119 (2016).
- Hamdi et al. (2016) Hanen Hamdi, Ekhard K. H. Salje, Philippe Ghosez, and Eric Bousquet, “First-Principles Reinvestigation of Bulk WO3,” Phys. Rev. B 94, 245124 (2016).
- Mattoni et al. (2018a) Giordano Mattoni, Alessio Filippetti, Nicola Manca, Pavlo Zubko, and Andrea D. Caviglia, “Charge Doping and Large Lattice Expansion in Oxygen-Deficient Heteroepitaxial WO3,” Phys. Rev. Mater. 2, 053402 (2018a), arXiv:1711.05106 .
- Leng et al. (2017) X Leng, J Pereiro, J. Strle, G. Dubuis, A. T. Bollinger, A. Gozar, J. Wu, N. Litombe, C. Panagopoulos, D. Pavuna, and I. Božović, “Insulator to Metal Transition in WO3 Induced by Electrolyte Gating,” npj Quantum Mater. 2, 35 (2017).
- Du et al. (2014) Yingge Du, Meng Gu, Tamas Varga, Chongmin Wang, Mark E. Bowden, and Scott A. Chambers, “Strain Accommodation by Facile WO6 Octahedral Distortion and Tilting during WO3 Heteroepitaxy on SrTiO3(001),” ACS Appl. Mater. Interfaces 6, 14253–14258 (2014).
- Svensson and Granqvist (1984) J. S.E.M. Svensson and C. G. Granqvist, “Modulated Transmittance and Reflectance in Crystalline Electrochromic WO3 Films: Theoretical Limits,” Appl. Phys. Lett. 45, 828–830 (1984).
- Svensson and Granqvist (1985) J. S E M Svensson and C. G. Granqvist, “Electrochromic Coatings for Smart Windows: Crystalline and Amorphous WO3 Films,” Thin Solid Films 126, 31–36 (1985).
- Granqvist (2000) C G Granqvist, “Electrochromic Tungsten Oxide Films: Review of Progress 1993-1998,” Sol. Energy Mater. Sol. Cells 60, 201–262 (2000).
- Mattoni et al. (2018b) Giordano Mattoni, Bas de Jong, Nicola Manca, Massimo Tomellini, and Andrea D. Caviglia, “Single-Crystal Pt-Decorated WO3 Ultrathin Films: A Platform for Sub-ppm Hydrogen Sensing at Room Temperature,” ACS Appl. Nano Mater. 1, 3446–3452 (2018b).
- Crichton et al. (2003) WA Crichton, Pierre Bouvier, and Andrzej Grzechnik, “The First Bulk Synthesis of ReO3-Type Tungsten Trioxide, WO3, From Nanometric Precursors,” Mater. Res. Bull. 38, 289–296 (2003).
- Dass et al. (2003) I. Dass, J. Q. Yan, and B. Goodenough, “Oxygen Stoichiometry, Ferromagnetism, and Transport Properties of La2-xNiMnO6+,” Phys. Rev. B - Condens. Matter Mater. Phys. 68, 64415 (2003).
- Tilmans et al. (1992) Harrie A.C. Tilmans, Miko Elwenspoek, and Jan H.J. Fluitman, “Micro Resonant Force Gauges,” Sensors Actuators A Phys. 30, 35–53 (1992).
- Kim and Dickinson (1986) C. S. Kim and S. M. Dickinson, “The Flexural Vibration of Slightly Curved Slender Beams Subject to Axial End Displacement,” J. Sound Vib. 104, 170–175 (1986).
- Bouwstra and Geijselaers (1991) S. Bouwstra and B. Geijselaers, “On the Resonance Frequencies of Microbridges,” TRANSDUCERS ’91 1991 Int. Conf. Solid-State Sensors Actuators. Dig. Tech. Pap. , 538–542 (1991).
- Nayfeh and Kreider (1995) A H Nayfeh and W Kreider, “Investigation of Natural Frequencies and Mode Shapes of Buckled Beams,” AIAA J. 33, 1121–1126 (1995).
- Lacarbonara et al. (2005) Walter Lacarbonara, Haider N. Arafat, and Ali H. Nayfeh, “Non-Linear Interactions in Imperfect Beams at Veering,” Int. J. Non. Linear. Mech. 40, 987–1003 (2005).
- Liu and Fan (2018) Xing Liu and Hui-qing Fan, “Electronic Structure, Elasticity, Debye Temperature and Anisotropy of Cubic WO3 from First-Principles Calculation,” R. Soc. Open Sci. 5, 171921 (2018).
See pages 1 of supplementary_WO3_uBridge_H2-v2.0.pdf See pages 2 of supplementary_WO3_uBridge_H2-v2.0.pdf See pages 3 of supplementary_WO3_uBridge_H2-v2.0.pdf See pages 4 of supplementary_WO3_uBridge_H2-v2.0.pdf See pages 5 of supplementary_WO3_uBridge_H2-v2.0.pdf See pages 6 of supplementary_WO3_uBridge_H2-v2.0.pdf See pages 7 of supplementary_WO3_uBridge_H2-v2.0.pdf See pages 8 of supplementary_WO3_uBridge_H2-v2.0.pdf See pages 9 of supplementary_WO3_uBridge_H2-v2.0.pdf See pages 10 of supplementary_WO3_uBridge_H2-v2.0.pdf