EUROCROPS: A PAN-EUROPEAN DATASET FOR TIME SERIES CROP TYPE CLASSIFICATION
Abstract
We present EuroCrops, a dataset based on self-declared field annotations for training and evaluating methods for crop type classification and mapping, together with its process of acquisition and harmonisation. By this, we aim to enrich the research efforts and discussion for data-driven land cover classification via Earth observation and remote sensing. Additionally, through inclusion of self-declarations gathered in the scope of subsidy control from all countries of the European Union (EU), this dataset highlights the difficulties and pitfalls one comes across when operating on a transnational level. We, therefore, also introduce a new taxonomy scheme, HCAT-ID, that aspires to capture all the aspects of reference data originating from administrative and agency databases. To address researchers from both the remote sensing and the computer vision and machine learning communities, we publish the dataset in different formats and processing levels.
Index Terms— big data, crops, analysis ready data, machine learning, Earth observation
1 INTRODUCTION
Exploration of data-driven models in the domain of Earth observation currently engages an entire branch of scientists, encouraging them to apply insights and developments from recent machine learning research to tackle problems prevalent in remote sensing. However, continued development in the area of satellite data analysis, notably using learning-based techniques, suffers from significant restraint due to insufficient diversity, quantity, and reliability of annotated reference data. In conjunction with the peculiarities of Earth observation data, this creates a high barrier to entry and consequently deters those from outside the field from contributing their ideas to this domain. With EuroCrops, we strive to tackle these issues for the application of crop type classification, particularly by using reliable self-declarations and not retrospective handmade annotations.
2 EUROCROPS
With the development of EuroCrops, we aim to build up a harmonised reference dataset containing agricultural parcel information data together with the crop type on each parcel, based on farmers’ self-declarations following the European subsidy control. It includes all European Union member states that make this data publicly available for research purposes. We want to broaden the target audience of this dataset beyond those interested in remote sensing and agriculture, intending to address computer scientists and data analysts without a strong background in Earth observation and remote sensing. Thus, EuroCrops provides its data in analysis-ready formats.
2.1 Data Acquisition
To achieve pan-European coverage with reference data, we conducted intensive enquiries about all 27 EU member states and their position regarding the data. As most of the countries, at that time, did not offer direct ways to download files in shapefile or GeoJSON format, we got in touch with ministries, agricultural departments, and authorities from 24 states.
2.2 Participating Countries
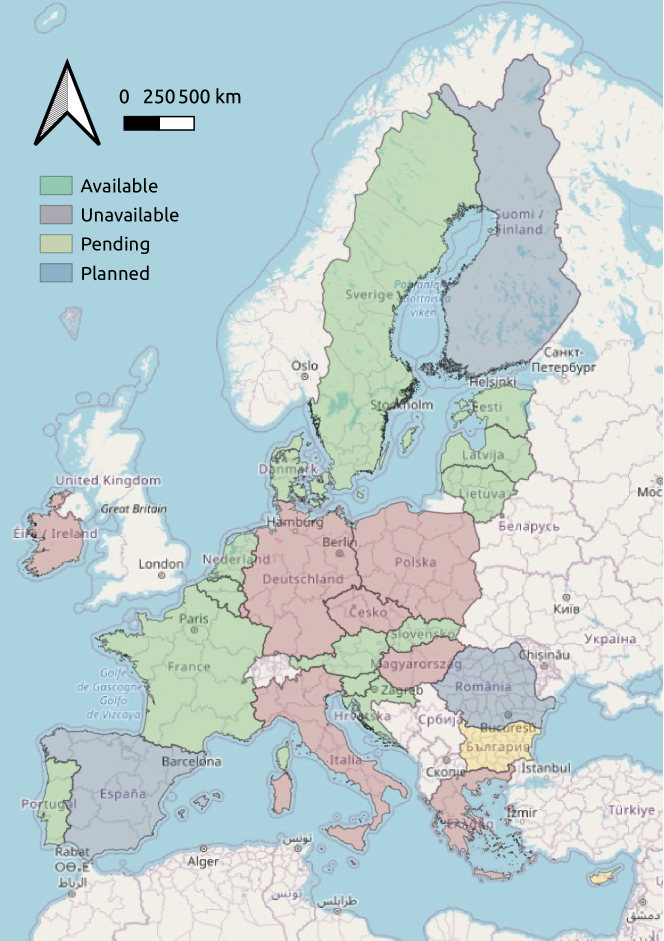
| Availability | Countries |
|---|---|
| available | Austria, Belgium, Croatia, Denmark, Estonia, France, Latvia, Lithuania, Netherlands, Portugal, Sweden, Slovakia, Slovenia |
| planned | Finland, Romania, Spain |
| not planned | Czechia, Germany, Greece, Hungary, Ireland, Italy, Luxembourg, Malta, Poland |
| request pending | Cyprus, Bulgaria |
By April 2021, it was possible to obtain reference data from 13 countries of the European Union, while another three are planning to release the data within 2021. Figure 1 provides a map of all participating countries, while the corresponding detailed line-up is listed in table 1. The acquisition process will be continued in the next years to not only achieve maximum regional but also temporal coverage.
2.3 Taxonomy
Although the European Union aims to achieve a common agricultural policy, current reference data hardly comes in a harmonised and uniform format, or even with English crop names. One of the biggest challenges of creating this dataset was to find one foundation of taxonomy into which all country-dependent schemes fit into. Consequently, we adapted the EAGLE matrix [1] developed by the European Environment Agency. Its Characteristics (CH) block represents additional land cover classes, including a section Crop Type with a segregation into classes according to EU regulation (EC) 1200/2009, annex II, chapter 2 [2]. To ensure optimal granularity, supplementary classes were added to the matrix. In addition, we propose an eight-digit taxonomy system, the Hierarchical Crop and Agriculture Taxonomy Identifier (HCAT-ID), in which the classes are represented numerically, while also encoding the hierarchical precision of the chosen crop names. It ranges, e.g., from Cereals as 33--1--01--00--0 (level 4) to Summer Oats as 33--1--01--05--1 (level 6), or generally
This way, it is easily possible to cut the HCAT-ID at the desired level of granularity on-the-fly and to use the label without any preprocessing and further refinement. By eliminating the last digit, for instance, the seasonal attribute of the crops can be omitted and a differentiation will only be made between Rye and Oats. The distinction is also shown in fig. 2, where each concentric circle represents one of the levels. They consist of blocks that are either a crop group, which include several classes from an outward circle, or an atomic crop class itself. For further information, the entire taxonomy and any updates on it, will also be published on our website and GitHub.
3 DEMO DATASET AND ANALYSIS
For a first study, a subset of the available data was gathered, harmonised and the corresponding Sentinel-2 images downloaded. By having a meaningful foundation and already being aware of all the difficulties, extending the dataset to the entire region of Europe will then follow a designated route.
3.1 Regions
| Country | Sentinel-2 Tile Name | Number of Parcels | Year |
|---|---|---|---|
| Austria | T33UWP | 2020 | |
| Denmark | T32VNH | 2019 | |
| Slovenia | T33TWM | 2020 |
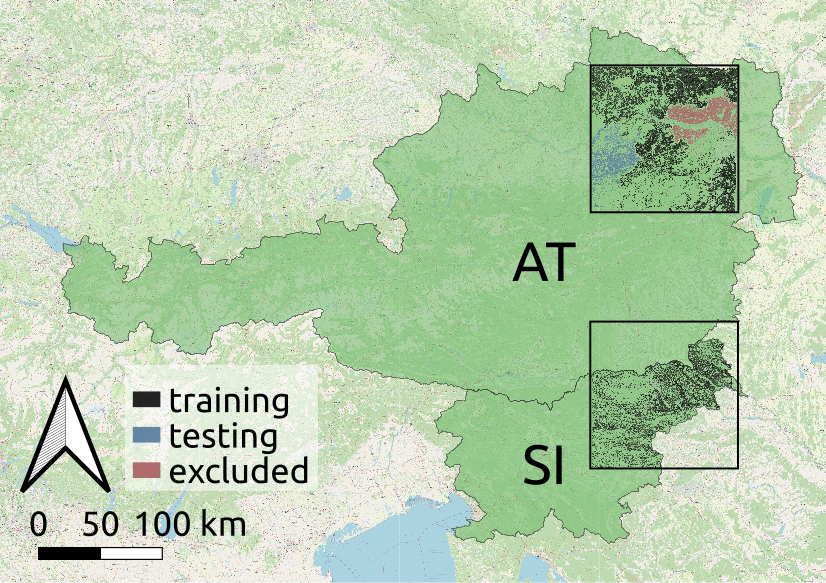
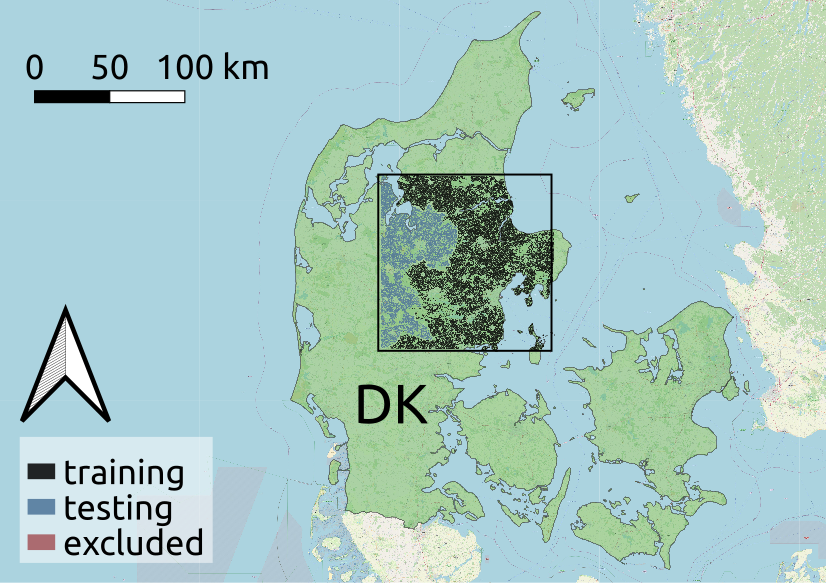
The regions for the demo dataset were chosen such that the agricultural diversity of Europe and its influence on the outcome of classification methods can be evaluated: Firstly, by choosing the adjacent countries Austria and Slovenia, the impact of national borders and, therefore, expected differences in cultivation of agricultural land is addressed. These two countries share approximately the same climate conditions, leading to the choice of Denmark as a third remote region for the demonstration. This way, it is possible to examine the effect of the latitude on the accuracy of crop type classification algorithms. While the declarations from Austria and Slovenia were surveyed for the year 2020, Denmark only released the data from 2019. In order to keep the satellite data processing straightforward and use roughly an equal areal coverage of each region, one Sentinel-2 tile per country was chosen, as visualised in fig. 3 and listed in table 2. The resulting dataset includes nearly one million field parcels and their annotations.
3.2 Class Distributions
Similarly to other crop type datasets covering the temperate climate zone, an evident class imbalance towards Meadow is present in our demo dataset as well. Figure 4 illustrates this trend by showing a near-linear decrease of crop class occurrences in logarithmic scale. In addition, the different geographic regions, as well as the impact of national borders, give rise to different class distributions amongst the demo areas. As mentioned before, harmonising the data also leads to discrepancies between the occurring classes. Denmark and Slovenia, for instance, are both only utilising the level 5 crop class Common Wheat/Spelt, while Austria includes seasonal level 6 cultivation attributes as Winter, shown in the diagrams for classes and in fig. 5. Of all available HCAT groups, our harmonised demo dataset uses 43 classes in the granularity reported by the respective authorities of the countries.
3.3 Train-Test Split
Earth observation satellite imagery is likely to be heavily influenced by spatial auto-correlation, which makes it a priority to deliberate on the choice of training and test split as early as possible. This implies to refrain from using adjacent parcels when training and testing a machine learning algorithm for addressing remote sensing problems. Therefore, we extracted one test area from Austria and another one from Denmark, following the Nomenclature of Territorial Units for Statistics (NUTS) scheme. One additional region in Austria has been excluded for future benchmarking purposes and challenges. Visually, this dissociation is shown in fig. 3.
3.4 Remote Sensing Dataset
To address the remote sensing community, we publish our harmonised reference vector data in GeoJSON format including the geo-referenced geometry of the parcels and the corresponding crop cultivated on this parcel. This way, any available satellite data can be used together with the labels. Additionally, corresponding Sentinel-2 imagery is available.
3.5 Time Series Dataset
As we also wanted to create a dataset to challenge the entire machine learning community, and notably those unfamiliar with remote sensing and Earth observation satellite data, a second, much more compact dataset will be released. In doing so, we got rid of the spatial component and concentrated on an easy-to-use and analysis-ready data format including two types of files: csv files with the crop labels and HDF5 files with a representative reflectance value from a Sentinel-2 L1C product for each parcel and band. These 13 values, each corresponding to one Sentinel-2 spectral band, were then gathered for each timestep within the observation period, resulting in a dataset ready for time series analysis. The structure of the reflectances is visualised in fig. 6. We want to point out that we purposely used raw top-of-atmosphere satellite data, including clouds and without atmospheric corrections, as any processing induces bias to the data. We hope to give methods the chance to explore all available underlying properties themselves.
3.6 Publication of the Demo Dataset
There are several options available on how to obtain the dataset: Firstly, as mentioned before, www.eurocrops.tum.de provides the up-to-date status of the project, as well as download resources and a link to a GitHub repository. Secondly, it will be made accessible through the Sinergise Sentinel Hub in the scope of the Global Earth Monitor (GEM) project. Lastly, we encourage scientists doing research on this topic to reach out and we will be happy to provide them the data directly.
4 CONCLUSION
We presented EuroCrops, a dataset that will help in advancing the research in the domain of crop type classification. Inspired by the success of previously published datasets from Rußwurm et al. [3] and Turkoglu et al. [4], we strive to curate a dataset with similar properties, but a larger regional coverage and a wider range of classes. As a first step, we publish a demo dataset covering regions in three different countries, which will then be extended in near future to contain several entire member states of the European Union. In addition to that, we introduced an extension to the EAGLE taxonomy scheme, which we encourage everyone to adapt and use. Finally, our dataset shows where the pitfalls of transnational datasets lie and therefore builds a new foundation for research targeting this area.
REFERENCES
- Arnold et al. [2013] Stephan Arnold, Barbara Kosztra, Gebhard Banko, Geoff Smith, Gerard Hazeu, Michael Bock, and Nuria Valcarcel Sanz. The EAGLE concept – a vision of a future european land monitoring framework. In EARSeL Symposium proceedings, "Towards Horizon 2020", pages 551–568, 2013.
- ec2 [2009] Commission Regulation (EC) 1200/2009. Official Journal of the European Union, L 329:1–28, 2009.
- Rußwurm et al. [2020] Marc Rußwurm, Charlotte Pelletier, Maximilian Zollner, Sébastien Lefèvre, and Marco Körner. Breizhcrops: A time series dataset for crop type mapping. International Archives of the Photogrammetry, Remote Sensing and Spatial Information Sciences ISPRS, 2020.
- Turkoglu et al. [2021] Mehmet Ozgur Turkoglu, Stefano D’Aronco, Gregor Perich, Frank Liebisch, Constantin Streit, Konrad Schindler, and Jan Dirk Wegner. Crop mapping from image time series: deep learning with multi-scale label hierarchies. 2021, arXiv: 2102.08820 [cs.CV].