Appendix: Parsing Imperfect Transcripts: Prosody Still Helps!
The following descriptions are based on the Reproducibility Checklist.
Experimental Settings
-
•
A clear description of the mathematical setting, algorithm, and/or model: this is in main paper, Section 3.
-
•
Submission of a zip file containing source code, with specification of all dependencies, including external libraries, or a link to such resources (while still anonymized): we have included a zip file with our code; more details on experimental steps and preprocessing can be found in the README.md doc that comes with the code.
-
•
Description of computing infrastructure used: we ran all our experiments on a 64-bit Linux CPU machine, Intel(R) Core(TM) i7-8700 CPU 3.20GHz.
-
•
Average runtime for each approach: it took approximately 15 minutes for each ranker’s hyperparameter search per feature set. This applies for the Support Vector Machine classifier (SVC); for the Logistic Regression (LR) classifier, it took approximately 5 minutes per configuration.
-
•
Number of parameters in each model: this depends on the features used, so these range from 4 to 12 weight parameters. The smallest feature set includes: parse score, ASR score, ASR length, and edit count. The largest features set includes: parse score, ASR score, raw parse score, normalized ASR score, ASR length, edit count, tree depth, total constituent count, INTJ count, NP count, VP count, and PP count. The best performing feature set includes parser score, ASR score, ASR length, tree depth, and count of the following nodes: NP, VP, PP, INTJ, EDITED.
-
•
Corresponding validation performance for each reported test result: all of the results are included in log files (folder log_medians).
-
•
Explanation of evaluation metrics used, with links to code: the code that implemented the metrics is included. Constituency parsing for written text is commonly evaluated with using evalb,111https://nlp.cs.nyu.edu/evalb/ i.e. reporting F1 score, the harmonic mean of precision and recall on predicted constituent tuples , where denotes the constituent label, and and denote the starting and ending indices of the constituent. However, this measure only works when the predicted parse and the reference parse have the same words. For evaluating parses on ASR transcripts, we use SParseval [Roark2006], a scoring program similar to evalb but has mechanisms to take into account ASR errors.
For bracket F1, SParseval requires an alignment between word sequences of the gold and predicted parses. We obtain this alignment with Gestalt pattern matching.222https://docs.python.org/3.6/library/difflib.html SParseval also has the option to compute dependency F1, which does not require the reference and predicted sequences to have the same words, as this measure is based on head-percolated tuples of where is the head word, is the dependent, and is the relation between and .
Experiments with Hyperparameter Search
-
•
Bounds for each hyperparameter: we tuned the regularization parameter (C) in LR and SVC with grid search: [0.0005, 0.0001, 0.005, 0.001, 0.05, 0.01, 0.5, 0.1, 1.0, 5.0, 10.0, 50.0, 100.0]
-
•
Hyperparameter configurations for best-performing models: for LR and for SVC.
-
•
Number of hyperparameter search trials: 5, for 5 different random seeds.
-
•
The method of choosing hyperparameter values: the hyperparameters were chosen based on best performance on the validation set, based on the corresponding F1 score (also mentioned in Section 3 in the paper).
Datasets Used
-
•
Relevant statistics such as number of examples: we described these in main paper, Section 2.
-
•
Details of train/validation/test splits: we described this in main paper, Section 2 and 3.
-
•
Explanation of any data that were excluded, and all pre-processing steps: we described this in the main paper, Section 2 and 3.
-
•
A link to a downloadable version of the data: we used the standard Switchboard dataset, which can be obtained with an LDC license, as described in Section 2.
-
•
For new data collected, a complete description of the data collection process, such as instructions to annotators and methods for quality control: not applicable.
Additional Results
Table 1 shows the detailed results of parsing with and without prosody on the test set. Focusing on labeled bracket F1, the relative improvement from using a ranker over the 1-best hypothesis is 1.5% for the best text parser, and 2% for the prosody parser. Achievable improvement in relation to the gap between oracle F1 score (sentence selected by best F1 score), the prosody parser helps cover 12.4% of the gap, compared to 9.8% by the text-based parser.
| unlabeled | labeled | |||
|---|---|---|---|---|
| dep | brk | dep | brk | |
| ASR | 0.612 | 0.700 | 0.491 | 0.676 |
| trans. | 0.619 | 0.714 | 0.494 | 0.687 |
| +pros | 0.622 | 0.715 | 0.504 | 0.690 |
| oracle F1 | 0.704 | 0.807 | 0.576 | 0.783 |
| %,trans. | 1.1% | 2.0% | 0.7% | 1.5% |
| %,+pros | 1.7% | 2.2% | 2.5% | 2.0% |
| %,trans. | 7.2% | 13.0% | 4.0% | 9.8% |
| %,+pros | 11.1% | 14.2% | 14.7% | 12.4% |
| bracket F1 | WER | |||
|---|---|---|---|---|
| Sents | 1-best | ranker | 1-best | ranker |
| w/ error | 0.648 | 0.660 | 0.235 | 0.237 |
| w/o error | 0.693 | 0.707 | 0.169 | 0.181 |
Table 2 shows F1 score and WER comparing sentences with and without transcription errors, where “corrected transcripts” are those based on the Mississippi State (MS-State) University correction project \citepDeshmukh1998. Within 5854 test sentences, 1616 have at least one transcription error based on the MS-State corrections. The bracket F1 score in sentences without transcription errors are higher both for for the parser-reranker (0.707 vs. 0.660) and the 1-best hypothesis system (0.693 vs. 0.648). Similarly, the WER lower in sentences without transcription errors.
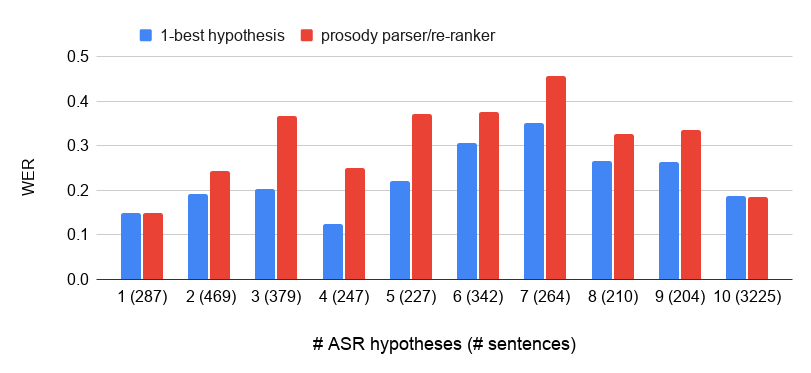
Figure 1 shows the word error rate on the test set grouped by the number of ASR hypotheses. The best system (transcript+prosody) parser-reranker results in better WER in short (single-hypothesis) sentences or where all 10 hypotheses are present.