A Decade of Discoveries
by the Daya Bay Reactor Neutrino Experiment
Abstract
With the end of Daya Bay experimental operations in December 2020, I review the history, discoveries, measurements and impact of the Daya Bay reactor neutrino experiment in China.
keywords:
reactor; neutrino; antineutrino.Received (Day Month Year)Revised (Day Month Year)
PACS Nos.: 14.60.pq, 14.60.St
1 Introduction
The Daya Bay reactor antineutrino experiment ended data-taking operations on 12 December 2020, over nine years from the start of data-taking in September 2011. Over this period, Daya Bay accumulated an unprecedented sample of over 6.3 million electron antineutrinos (s) detected via inverse beta decay with multiple detectors from the six nuclear reactors comprising the Daya Bay nuclear power plant near Shenzhen, China. Results during this time include the first definitive observation of short baseline reactor neutrino disappearance, constraints on sterile neutrinos and measurement of both the flux and spectrum of reactor from the fission of and , the main fissioning isotopes of commercial reactors.
2 Motivation for the Daya Bay experiment
James Chadwick’s observation in 1914 [1] of a continuous energy spectrum was perplexing because it seemed to imply non-conservation of energy and momentum. Wolfgang Pauli proposed in 1930, in his famous letter [2], “a desperate remedy to save…the law of conservation of energy” by proposing a light, neutral, spin particle, later dubbed the “neutrino” by Enrico Fermi. Pauli lamented in his letter that the neutrino was likely unobservable. In the 1950’s, the challenge was overcome by Frederick Reines and Clyde Cowan when they definitively observed produced by a nuclear reactor using the inverse beta-decay (IBD) reaction . [3]
Numerous experiments since then showed that neutrinos come in three flavors, have mass and oscillate. The oscillations of neutrinos involve two mass-squared differences and , three mixing angles , and a CP-violating phase . Around the turn of the century, it was known that , , and [4]. From the CHOOZ reactor neutrino experiment [5, 6], it was known that at .
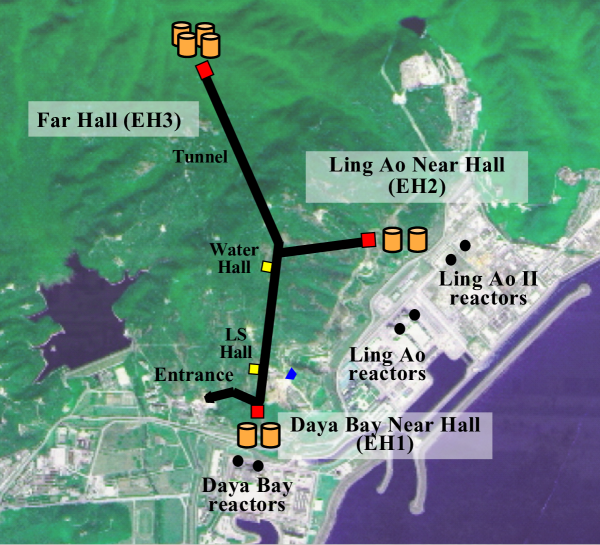
A 2004 white paper [4] outlined a strategy to use multiple, identical detectors to reduce uncertainties due to reactor flux, detection efficiency and target mass which were major factors limiting CHOOZ’s sensitivity to . The Daya Bay collaboration was formed and proposed a reactor neutrino experiment in southern China with eight “identical” antineutrino detectors (ADs) in three underground experimental halls (EHs) near the six reactors of the Daya Bay nuclear power plant (Figure 1) [7].
A Daya Bay AD utilizes a cylindrical 3-zone design with the zones divided by thin acrylic vessels [8]. The target comprises 20 tons of Gd-loaded liquid scintillator (GdLS) in a 3 m high, 3 m diameter inner acrylic vessel (IAV). The next zone is 21 tons pure LS in a 4 m high, 4 m diameter outer acrylic vessel (OAV) denoted as the “gamma catcher”. The outermost zone contains 192 8” photomultiplier tubes (PMTs) arranged azimuthally outside the gamma catcher submerged in 40 tons of mineral oil contained within the 5 m high, 5 m diameter stainless steel vessel. Reflective disks at the top and bottom of the gamma catcher create, to first order, an optically infinite cylinder. The scintillator light yield and photomultiplier coverage enabled an AD light yield of about 160 photoelectrons per MeV of deposited energy.
The AD target scintillator contains 0.1% Gd by mass to take advantage of Gd’s large neutron capture cross-section and the emission of of gamma-ray energy. [10, 11, 12, 13] The high capture energy enhances discrimination against backgrounds from natural radioactivity with typical energies and the typical capture time of 28 s in GdLS for IBD neutrons suppresses combinatoric background. Selecting nGd captures efficiently selects IBDs occurring in the target.
Each AD is equipped with three Automated Calibration Units (ACUs) that allow remote deployment of radioactive sources (, and ) and light-emitting diodes. [14] ACUs A and B deploy sources along the central axis and near the wall of the IAV, respectively. ACU-C deploys sources in the gamma catcher. produces two s with a total energy of 2.506 MeV used for energy calibration. The positron annihilation source enables determination of the efficiency for positrons produced at IBD threshold. The source is designed to produce single neutrons without s. [15]
The ADs are deployed in 10 m deep water pools in each EH such that there is at least 2.5 m of water shielding around every AD. The water volume is divided into inner and outer regions by highly reflective tyvek sheets and 8” PMTs are deployed in both regions to actively shield the ADs. Four layers of resistive plate chambers are deployed over the water pools for additional active shielding. Full details can be found in Refs. \refciteDayabay:2014vka,Chow:2015ere. As shown in Figure 1, EH1 and EH2 are near the Daya Bay and Ling Ao reactor complexes, respectively, and EH3 is the far site.
Nuclear reactors produce from beta decay of the daughters of the fissioning isotopes. Commercial reactors such as Daya Bay produce about . Each of the six Daya Bay reactors operates at 2.9 . The observed reactor energy spectrum is the result of the convolution of the steeply falling spectrum from beta decay and the rising IBD cross-section with a threshold of MeV. The spectrum peaks around 3 to 4 MeV and drops to zero at about 8 MeV. [18]
Disappearance of is governed by
| (1) |
where is valid for the energy () and baseline () ranges of Daya Bay [9]. Note that is related to the actual mass splitting
| (2) |
where the () sign corresponds the normal(inverted) hierarchy. The term is negligible for Daya Bay baselines.
The two competing, contemporaneous experiments, Double Chooz [19] in France and RENO [20] in South Korea, are compared with Daya Bay in Table 2. Daya Bay has advantages in signal yield thanks to significantly greater target mass and comparable or greater reactor power and reduced cosmogenic background due to greater overburden.
Comparison of the reactor power, target mass, overburden and far site baseline of the Double Chooz, RENO and Daya Bay experiments. The parameters of the upcoming JUNO experiment are also provided. [21] Reactor Target (tons) Overburden (m.w.e) Baseline (km) Experiment power (GWth) Near Far Near Far Far Double Chooz 8.6 8 8 120 300 1.05 RENO 16.5 16 16 120 450 1.38 Daya Bay 17.4 80 80 250 860 1.65 JUNO 26.6 — 20000 — 1800 53
3 Observation of non-zero
In 2011, long baseline accelerator neutrino experiments MINOS [22] and T2K [23] had hints of non-zero from putative appearance in beams. Additional indications of non-zero included Double Chooz [24] results using only their far detector and an analysis using the combination of solar neutrino and KamLAND results [25]. These results motivated Daya Bay to re-evaluate the deployment and commissioning plan in mid-2011. At the time, it was known that RENO would soon start data-taking and that T2K might resume data-taking before the end of 2011. Daya Bay’s altered plan called for a “2-1-3” deployment of two ADs in EH1, one AD in EH2 and three ADs in EH3 with a goal of a first publication in March 2012.
EH1 operation began 23 September 2011, EH2 operation in mid-October and EH3 operation on 24 December 2011. With the initial three months of EH1 operation with two ADs from 23 Sept. to 23 Dec. 2011, Daya Bay demonstrated that the two ADs were indeed “functionally identical” with measured inter-detector systematic uncertainties better than required [26].
The Daya Bay collaboration held an analysis workshop at the start of 2012 at the Daya Bay site in southern China. Preliminary analysis results from the first five days of “2-1-3” data-taking were presented at the workshop on 3 January 2012. These results indicated a deficit in IBD events in EH3 with respect to the prediction based on the near sites, EH1 and EH2, of roughly three standard deviations. Needless to say, this surprising indication of a large was quite a motivation to the collaboration to re-double the effort to meet the March 2012 goal.
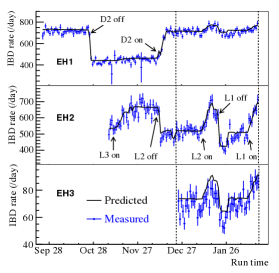
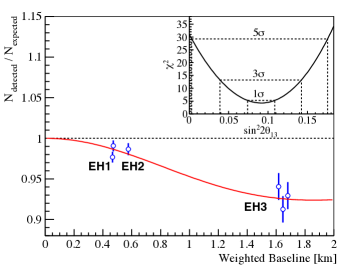
The initial results using 55 days of data confirmed the indications of the first five days of data and yielded the first definitive observation of non-zero at 5.2 standard deviations. [27] Figure 2 shows that the observed IBD candidates at each site tracked the expectation based on the reactor power information provided by the reactor company as well as the clear deficit in EH3 rate with respect to EH1 and EH2. Interpretation of the observation using Eqn. 1 results in .
As noted in Ref. \refciteConrad:2012zzb, a large value of enables the pursuit of the mass hierarchy and CP violation in appearance experiments that should take data soon. It also reinforces the quantitative differences between the quark and lepton mixing matrices.
A coordinated series of seminars around the world at collaborating Daya Bay institutions announced the results on 8 March 2012 with the first (earliest) seminar at IHEP in Beijing. RENO confirmed the results about one month later [29]. The results were hailed as one of the top ten breakthroughs of 2012 by Science [30]. Daya Bay, along with the SuperK, T2K, KamLAND and SNO experiments, were awarded the 2016 Breakthrough Prize in Fundamental Physics in recognition of investigation of neutrino oscillations[31].
An improved measurement was reported by Daya Bay at the Neutrino 2012 conference [32] with about 2.5 times more data. [33] Operations were paused after 217 days of data in the “2-1-3” configuration to install the final two ADs in the summer of 2012. A manual calibration system, capable of placing radioactive sources throughout the target volume, was deployed during summer 2012. [34] Daya Bay operated in the “2-2-4” mode until January 2017 when an AD in EH1 was repurposed for JUNO LS development. [35] The experiment operated in a “1-2-4” mode until the end of operations in December 2020.
4 Selection of IBD candidates
As noted in Section 2, the inverse beta-decay reaction provides a pair of time-correlated energy deposits. The positron ionizes and annihilates, producing a prompt energy deposit in the 1 to 8 MeV range. In the GdLS volume, the neutron captures with a characteristic time of with 84% of captures on either or with relative probabilities of 81.5% and 18.5%, respectively. The energy released per capture is 7.95 MeV for and 8.54 MeV for . The remainder of captures (16%) occur on hydrogen which releases a single 2.22 MeV .
These characteristics allow a straightforward selection of IBD candidates using nGd captures in the Daya Bay ADs. [36]
-
1.
The prompt energy is required to be in the range 0.7 to 12 MeV, ensuring nearly 100% efficiency for the prompt candidate.
-
2.
The delayed energy must be in the range 6 to 12 MeV which enables high efficiency for the nGd capture s.
-
3.
The delayed candidate is required to be later than the prompt candidate by . Candidates with are rejected since they would fall within a single triggered readout of the detector.
-
4.
Additional criteria, dubbed the multiplicity veto, are applied to reject occurrences of more than two signals close in time that result in confusion as to which pair is the result of an interaction. The multiplicity veto required only one signal in the 400 s before the delayed candidate and no signal in the 200 s after the delayed candidate.
-
5.
Cosmogenic backgrounds are suppressed by rejecting candidates that occur within of a signal in either the inner or outer regions of the water pool, or
-
6.
candidates that occur within of a signal with photoelectrons in the AD, or
-
7.
within of a signal with photoelectrons in the AD.
Daya Bay typically had two sets of selection criteria devised by two largely independent analysis teams. [36] Criteria (1)–(3) were used by both Selection A and B. Selection B in Ref. \refciteAn:2016ses used the criteria (4)–(7). Selection A used analogous criteria targetting the same backgrounds.
Both Selections rejected instrumental background, caused by light emission from PMTs, by exploiting the sharing and pattern of light among the PMTs. These criteria were determined to have a efficiency for IBD events with negligible background. See Ref. \refciteAn:2016ses for details.
Two uncorrelated signals can be selected as an IBD candidate. This background is dubbed “accidentals” and can be precisely estimated by pairing uncorrelated signals satisfying the prompt and delayed criteria.
There were four significant correlated backgrounds:
-
1.
Fast neutrons: Energetic neutrons can be generated by muons passing through or near the AD. A nuclear collision of a fast neutron in the scintillator producing a recoiling proton can mimic a prompt signal and the subsequent capture is identical to the delayed signal. Criteria (5)–(7) suppress this background to (all percentages are relative to signal).
- 2.
-
3.
neutron sources: Neutrons from the calibration sources parked in the ACUs can produce s correlated in time that enter the active AD volume. This background occurs at .
-
4.
interactions: Natural radioactivity within the detector produces s that can interact with stable nuclei to produce neutrons with interactions being the most abundant. Protons from neutron recoil or de-excitation s provide the prompt candidate. Contamination from this background is .
The magnitude and energy spectra of the IBD signal and backgrounds are shown in Figure 3 with the results from Ref. \refciteAn:2013zwz based on the full six-AD running period. The background-to-signal ratio is and in the near and far sites, respectively, demonstrating the effects of reactor power, total detector mass and overburden shown in Table 2.
5 Precision neutrino oscillation measurements
Subsequent to establishing non-zero , Daya Bay has made a series of measurements of increasing precision of the neutrino oscillation parameters in Eqn. 1, namely and . Measurement of the latter requires precise knowledge of the detector energy response to IBD positrons since the energy is given by where is the prompt energy (both the positron kinetic energy and the annihilation energy) and is the average neutron recoil energy. The non-linearity in the AD energy response is dominated by two effects: the particle-type dependency of the scintillator light yield and charge-dependence of the PMT readout electronics. The light yield non-linearity is related to intrinsic scintillator quenching and Cherenkov light emission. The electronics non-linearity results from the interaction of the scintillation light time profile and the charge-collection characteristics of the electronics. Each effect is at the 10% level.
The energy response model has evolved as the details of the response have become better understood. Model parameters were determined from gamma-ray lines in AD calibration data obtained from deployed and naturally occurring sources as well as the continuous -decay spectrum of from muon spallation in the GdLS volume. The initial model attained an overall uncertainty of about 1.5% on and differed by among the 6 ADs which had negligible impact on the initial measurement. [37] The subsequent model reduced the absolute uncertainty to for and the uncorrelated uncertainty between ADs to 0.2%. [38] The most recent model achieves an absolute uncertainty of less than 0.5% for and 0.1% among ADs by taking into account subtle optical effects of the source enclosures and deployment system. [39] It also takes advantage of a dual readout system installed on one AD in EH1 in December of 2015 where a full FADC readout system acquired data simultaneously with the original readout system. [40]
The latest oscillation measurements from Daya Bay are based on nearly four million IBD candidates from 1958 days of data and yield and assuming the normal mass hierarchy and assuming the inverted hierarchy. [41] The measurement of from electron antineutrino disappearance is compared to that from muon neutrino disappearance in Table 5. The precision of the Daya Bay result is comparable or superior to all currently published results. The consistency of the results provides strong confirmation of the 3-flavor model of neutrino mixing.
Latest measurements of from reactor experiments and under the normal (NH) and inverted (IH) hierarchy assumptions from muon and electron neutrino disappearance measurements. () Experiment NH IH Reference Daya Bay \refciteAdey:2018zwh RENO \refciteBak:2018ydk Double Chooz \refciteDoubleChooz:2019qbj NOVA \refciteAcero:2019ksn SuperK \refciteAbe:2017aap T2K \refciteAbe:2018wpn
With the full data sample of over six million IBD candidates registered by nGd capture, the relative precision on and is expected to improve from 3.4% and 2.8%, respectively, to 2.7% and 2.1%. The ultimate Daya Bay precision is likely to be exceeded by JUNO [21] and experiments in long baseline muon neutrino beams in the next decade. The precision of Daya Bay’s final measurement is unlikely to be surpassed for decades.
6 Sterile neutrinos
In 2011, an improved prediction of reactor antineutrino spectra was calculated for the four main fissioning isotopes , , and . [47] Notably, this new calculation predicted about 3% higher flux from commercial reactors. The disagreement between the prediction and the available measurements of flux at 98.6% C.L. was dubbed the “Reactor Antineutrino Anomaly” (RAA). [48] One explanation of the RAA postulated the existence of a fourth, non-standard neutrino with and . An independent calculation verified the improved prediction. [49] The combination of the two calculations, referred to as the “Huber-Mueller” model, became the de facto standard for calculation of reactor antineutrino spectra.
Reactor antineutrino experiments would be sensitive to such a new neutrino state if the disappearance of deviated from Eqn. 1. For short baselines, such as those available at Daya Bay, disappearance would be described by
| (3) |
if there were a fourth neutrino state. This fourth neutrino is referred to as a “sterile” neutrino because it has nearly zero interaction amplitude with the and bosons of the Standard Model. [50]
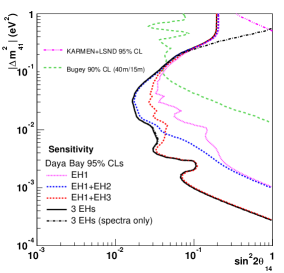
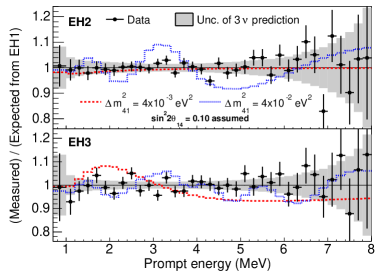
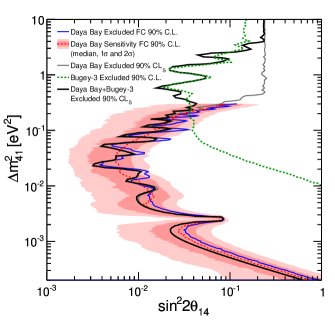
The multiple baselines of Daya Bay provide sensitivity to the region of 50 to 200 m/MeV, corresponding to in the 0.001 to 0.1 region. As with the measurement, the comparison of different EHs removes sensitivity to the knowledge of the absolute antineutrino flux. The combination of EH1 and EH3 better constrains the region while EH1 and EH2 better constrains the region as shown in Figure 4. Sensitivity to , near the region favored by the RAA, is based on the comparison of the measurement of the absolute flux in the near sites, primarily EH1, with the prediction. The uncertainty on the absolute flux measurement is conservatively set at 5% as illustrated in Figure 4. No evidence for a sterile neutrino from disappearance was found in Daya Bay’s initial search [51] or subsequently. [54, 55]
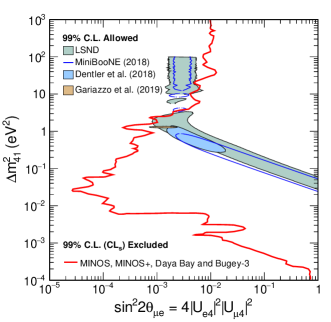
The LSND experiment reported evidence [56] for appearance for . MiniBooNE, operating in an accelerator muon neutrino beam with the same as LSND, has observed low-energy excesses attributed to and [57] that show consistency with LSND, but are not definitive. The standard 3-neutrino mixing model can be extended by adding one or more sterile neutrinos to describe muon neutrino to electron neutrino transitions consistent with the LSND and MiniBooNE observations. [58] In this case the appearance probability is given by . The relation between appearance and disappearance probabilities yields
| (4) |
in the limit of small mixing with one sterile neutrino.
Daya Bay has collaborated with MINOS [59] and MINOS+ [55] to combine disappearance results with the muon neutrino disappearance measurements to constrain electron neutrino appearance from muon neutrino sources. The resulting limit on as a function of , taken from Ref. \refciteAdamson:2020jvo, is shown in Figure 5. As stated in Ref. \refciteAdamson:2020jvo, “…the LSND and MiniBooNE 99% C.L. allowed regions are excluded at 99% CLs for .” The results further reduce the viability of a sterile neutrino explanation of putative electron neutrino appearance and null disappearance results.
7 Measuring the reactor flux and spectrum
The RENO experiment presented preliminary results at the Neutrino 2014 conference [60] that showed an excess of IBD candidates near 5 MeV in prompt energy with respect to the Huber-Mueller model. [61] When the observed IBD yield is normalized to the prediction for 0.5 to 4.0 MeV, then the 5 MeV excess corresponds to of the total expected flux. In 2016, Daya Bay published a measurement of the absolute flux and spectrum that confirmed the excess near 5 MeV. [62] The measured total flux, in terms of the IBD yield per fission, of was in agreement with previous reactor antineutrino measurements. The flux was relative to the prediction from the Huber-Mueller model. The uncertainty in the flux measurement is dominated by the knowledge of the IBD detection efficiency and the number of protons in the target.
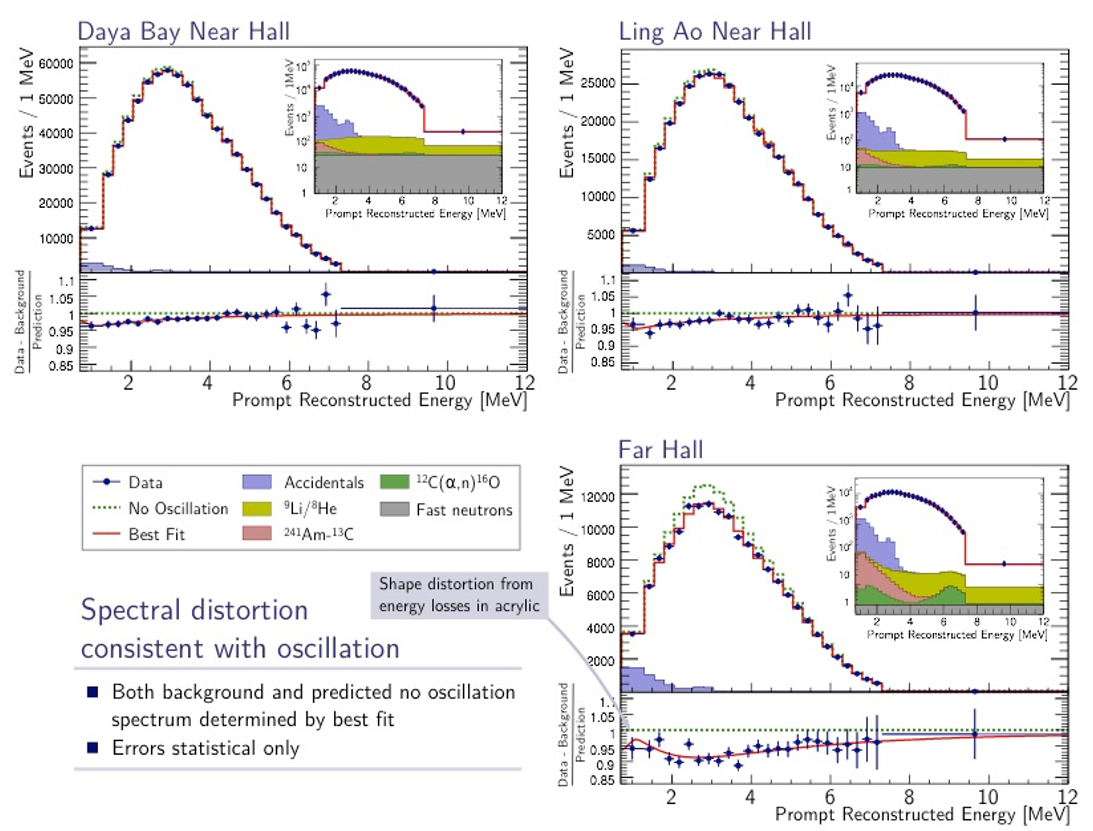
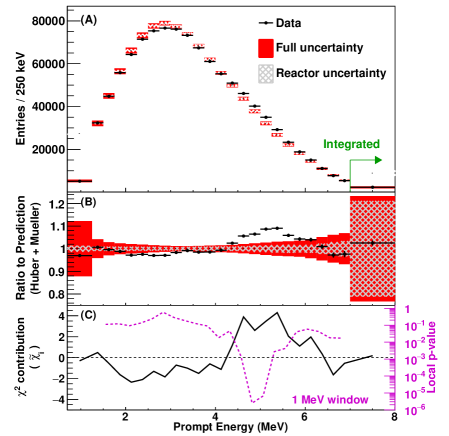
A subsequent measurement of the spectrum with higher statistics not only observed the 5 MeV excess with high significance but also showed that the low-energy spectrum () was not well described by the Huber-Mueller model. [63] As shown in Figure 6, the shape of the measured spectrum is inconsistent with the prediction for nearly the entire prompt-energy range. Reference \refciteAn:2016srz also provided a “generic antineutrino spectrum” to serve as model-independent input for reactor antineutrino experiments. The Daya Bay-provided spectrum was subsequently used by the NEOS experiment to set stringent limits on sterile neutrinos in the RAA region, [64] and by the CONUS experiment to constrain elastic neutrino nucleus scattering. [65]
The precision on the reactor antineutrino flux was subsequently improved thanks to a comprehensive neutron calibration campaign. [15] Detailed analysis of data and simulation reduced the uncertainty in the neutron detection component of the IBD detection efficiency by 56%. The improved IBD yield was measured to be or of the Huber-Mueller prediction where the first (second) uncertainty is experimental (theoretical). [66]
As commercial nuclear reactors operate, the composition of the fissioning elements, known as the fuel, varies. Over the course of a reactor cycle, the fraction of decreases from to while () increases from () to (). The fraction remains roughly constant at . Since both the rate and spectrum of production differs for these isotopes, both the flux and spectrum of IBD events are expected to change during the reactor cycle. Previous experiments with a single detector exposed to a single reactor observed flux evolution [67, 68]. Daya Bay exploited these effects to determine the flux produced by and .
Daya Bay defines effective fission fractions viewed by each AD at time as [69]
| (5) |
where is the thermal power of the reactor, is the mean survival probability, is the distance from the AD to the reactor, is the fraction of fissions from isotope and reactor , and with being the average energy released from isotope , where runs over the isotopes , , and . With this definition, the measured IBD yield per nuclear fission is simply the sum of IBD yields from the individual isotopes, . Thermal power and fission fraction data were provided on a weekly basis by the power company, validated by Daya Bay, and used to calculate effective fission fractions using Eqn. 5. The effective fission fraction varied from about 0.23 to 0.36 for the ADs in the two near sites, EH1 and EH2, for the results in Ref. \refciteAn:2017osx. Weekly IBD datasets were grouped into eight bins in with roughly equal statistics per bin to study the effect of fuel evolution. The data were fitted using
| (6) |
where is the total -averaged IBD yield, is the average effective fission fraction and is the change in yield per unit fission fraction. The best fit results are and with . These observations differ by and from the expectations of the Huber-Mueller model of and , respectively. The inconsistency between data and prediction for points to additional tension beyond the established differences in the total IBD yield .
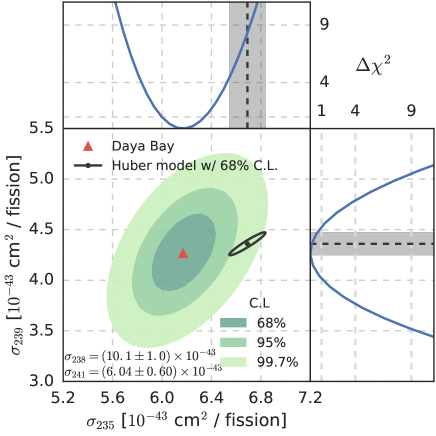
The observed evolution was used to measure the IBD yields of and by assuming 10% relative uncertainties on the yields on the minor fission isotopes and taken from the Huber-Mueller model. The resulting IBD yields for and were determined to be and , respectively. As shown in Figure 7, the predicted and measured yields from the main fissioning isotope, , differ significantly while the measurement and prediction of are consistent. The hypothesis that all isotopes have equal fractional deficits with respect to the prediction is disfavored at . This provides strong evidence that the RAA is likely due to the incorrect prediction of the yield from a single isotope, , and not solely due to sterile neutrinos.
There are additional experimental results that strongly disfavor sterile neutrinos as the explanation of the RAA. STEREO [70] recently measured in good agreement with Daya Bay’s measurement. A recent experiment measured the ratio of beta decay spectra from and using a technique quite different from that used to form the basis of the Huber-Mueller model. [71] The beta decay ratio implies according to Ref. \refciteKopeikin:2021rnb in good agreement with 1.44 determined by Daya Bay and inconsistent with 1.52 calculated by Huber-Mueller. (The authors of Ref. \refciteKopeikin:2021rnb claim the uncertainties in the beta decay ratio are small, but do not provide a quantitative estimate.) Recent sterile neutrino searches by short-baseline experiments NEOS [64],DANSS [72], STEREO [73] and PROSPECT [74] rule out the best-fit point of the RAA at C.L., C.L., C.L. and C.L., respectively.
These results all suggest that the calculated IBD flux and spectra predicted by the Huber-Mueller model are incorrect. The theoretical uncertainties in the prediction are discussed in detail in Ref. \refciteHayes:2016qnu which estimates that the methodology of the Huber-Mueller prediction incur an uncertainty of 5% that requires new experiments to resolve. Until such experiments are performed and analyzed, direct experimental measurements of the reactor flux and spectra can provide an alternative to the models.
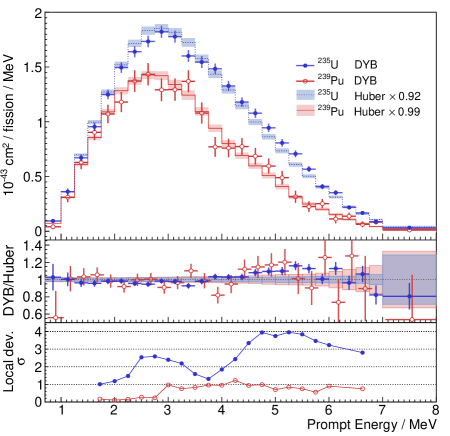
Daya Bay has extended the fuel evolution analysis in bins of prompt energy to extract measurements of the IBD spectra from and fission as shown in Figure 8. [76] The resulting spectrum is consistent with spectra measured at research reactors fueled exclusively by . This is the first experimental measurement of the IBD spectrum from fission daughters.
Daya Bay in a recent paper deconvolves the detector response from the directly measured IBD sample and extracts , and prompt-energy spectra to produce spectra in energy. [77] Here is the combined spectra from and since the evolution of these spectra are correlated. These spectra can then be utilized to predict the IBD energy spectrum from an arbitrary reactor with fission fractions (, , , ) as
| (7) |
where where is the effective fission fraction for isotope for the Daya Bay measurement, is the ratio of to fission fractions, , and are the spectra from Daya Bay while and are taken from the Huber-Muller model. Note that the terms containing serve as corrections to so that the corrections for the and fractions are small. Ref. \refciteAdey:2021rty also provides the relevant correlations between the to allow determination of the uncertainty on . This technique predicts the energy spectrum to a 2% precision for typical commercial reactors.
8 Other Daya Bay measurements
Daya Bay has also produced an independent measurement of using neutrons captured on hydrogen, rather than gadolinium. [78, 79] Since the delayed energy from nH captures is 2.22 MeV rather than MeV of nGd, more stringent criteria are required to suppress background. The prompt energy is required to be greater than 1.5 MeV, compared to 0.7 MeV for the nGd analysis. Captures on nH are selected by requiring the delayed energy to be within standard deviations of the nH capture peak and the distance between the reconstructed prompt and delayed energy deposits is required to be cm. The coincidence time interval between the prompt and delayed is increased to [1, 400] s due to the longer capture time in the gamma catcher region. Even with these more stringent criteria, the background from accidental coincidences is large. The signal-to-background rate in EH3 (EH1 and EH2) is about 1 (7). Based on 404 days in the eight-AD configuration combined with 217 days in the six-AD configuration, is determined to be , consistent with the nGd measurement. About half the uncertainty is due to statistics and about 40% is due to the distance criterion and the delayed-energy criterion.
Using the same 621 day data sample, Daya Bay also searched for a time-varying signal over 704 calendar days. [80] No significant signal was observed for periods from 2 hours to nearly 2 years. The lack of a sidereal modulation in the time spectra was also used to limit Lorentz and CPT violating effects where Daya Bay’s unique layout of multiple directions from the three reactor pairs to the three experimental halls provides unique constraints.
Daya Bay data were also examined in a model which describes the neutrino by a wave packet with relative intrinsic momentum dispersion [81]. Limits on were derived. The effects due to the wave packet nature of neutrino oscillation were determined to be negligible for detected in the Daya Bay experiment ensuring unbiased measurements of and within the commonly used plane wave model.
Two papers studied cosmogenic phenomena in Daya Bay. The seasonal variation of the underground muon flux in the three experimental halls over a two-year period were measured. [83] The results were in agreement with similar measurements by other underground experiments. Cosmogenic production of neutrons in the Daya Bay scintillator was also measured and compared with GEANT4 [84] and FLUKA [85] simulations. [82] The measured production rates were 25% to 35% higher than the simulations in EH1 and EH2. The EH3 rate agreed with FLUKA’s prediction but was about 30% higher than GEANT.
9 Predicting the future
Daya Bay is in the process of completing final analyses using all data from 24 December 2011 to 12 December 2020. As described in Section 5, with the full data sample, the relative precision on and is expected to be 2.8% and 2.1%, respectively. Higher statistics measurements of the total, and IBD antineutrino flux and spectra should be produced. The higher statistics should also yield improved limits on sterile neutrinos. Daya Bay and PROSPECT plan to produce combined results on the spectrum and sterile neutrino searches.
Many of the scientists that participated in Daya Bay are now collaborating on the JUNO experiment [21] that has the potential to reveal much more about the physics of neutrinos. I wish them luck.
Acknowledgements
I thank my Daya Bay colleagues Ming-chung Chu, Logan Lebanowski, Kam-Biu Luk, Kirk McDonald and Dmitry Naumov for comments on drafts of this article. I also wish to thank my BNL colleague Milind Diwan for encouraging me to write this article. My research is supported by the U.S. Department of Energy under contract DE-SC0012704.
References
- [1] A. Pais, Radioactivity’s two early puzzles, Rev. Mod. Phys. 49 (1977), 925-938.
- [2] See, for example, Brown, Laurie M. The idea of the neutrino, Physics Today 31 (9): 23-28 (1978)
- [3] Reines, F., Cowan, C. L., Harrison, F. B., McGuire, A. D. and Kruse, H. W., Detection of the free anti-neutrino, Phys. Rev. 117 (1960) 159.
- [4] Anderson, K. et al., White paper report on Using Nuclear Reactors to Search for a value of , arXiv:hep-ex/0402041.
- [5] Apollonio, M. et al., Search for neutrino oscillations on a long baseline at the CHOOZ nuclear power station, Eur. Phys. J. C 27 (2003) 331.
- [6] Apollonio, M. et al., Limits on neutrino oscillations from the CHOOZ experiment, Phys. Lett. B 466 (1999) 415.
- [7] Guo, X. et al., Daya Bay Collaboration, A Precision measurement of the neutrino mixing angle using reactor antineutrinos at Daya-Bay, arXiv:hep-ex/0701029.
- [8] F. P. An et al., Daya Bay Collaboration, The Detector System of The Daya Bay Reactor Neutrino Experiment, Nucl. Instrum. Meth. A 811 (2016), 133-161, arXiv:1508.03943.
- [9] Adey, D. et al., Daya Bay Collaboration, Response to Comment on Daya Bay’s definition and use of arXiv:1905.03840.
- [10] M. Yeh, A. Garnov and R. L. Hahn, Gadolinium-loaded liquid scintillator for high-precision measurements of antineutrino oscillations and the mixing angle, Theta(13), Nucl. Instrum. Meth. A 578 (2007), 329-339.
- [11] Y. Ding, J. Liu, Z. Wang, Z. Zhang, P. Zhou and Y. Zhao, A new gadolinium-loaded liquid scintillator for reactor neutrino detection, Nucl. Instrum. Meth. A 584 (2008), 238-243.
- [12] M. Yeh, J. B. Cumming, S. Hans and R. L. Hahn, Purification of lanthanides for large neutrino detectors: Thorium removal from gadolinium chloride, Nucl. Instrum. Meth. A 618 (2010), 124-130.
- [13] W. Beriguete, J. Cao, Y. Ding, S. Hans, K. M. Heeger, L. Hu, A. Huang, K. B. Luk, I. Nemchenok and M. Qi, et al., Production of a gadolinium-loaded liquid scintillator for the Daya Bay reactor neutrino experiment, Nucl. Instrum. Meth. A 763 (2014), 82-88, arXiv:1402.6694.
- [14] J. Liu, B. Cai, R. Carr, D. A. Dwyer, W. Q. Gu, G. S. Li, X. Qian, R. D. McKeown, R. H. M. Tsang and W. Wang, et al. Automated calibration system for a high-precision measurement of neutrino mixing angle with the Daya Bay antineutrino detectors, Nucl. Instrum. Meth. A 750 (2014), 19-37, arXiv:1305.2248.
- [15] J. Liu, R. Carr, D. A. Dwyer, W. Q. Gu, G. S. Li, R. D. McKeown, X. Qian, R. H. M. Tsang, F. F. Wu and C. Zhang, Neutron Calibration Sources in the Daya Bay Experiment, Nucl. Instrum. Meth. A 797 (2015), 260-264, arXiv:1504.07911.
- [16] F. P. An et al., Daya Bay Collaboration, The muon system of the Daya Bay Reactor antineutrino experiment, Nucl. Instrum. Meth. A 773 (2015), 8-20, arXiv:1407.0275.
- [17] K. Chow et al., Daya Bay Collaboration, Waterproofed Photomultiplier Tube Assemblies for the Daya Bay Reactor Neutrino Experiment, Nucl. Instrum. Meth. A 794 (2015), 25-32, arXiv:1502.06652.
- [18] C. Bemporad, G. Gratta and P. Vogel, Reactor Based Neutrino Oscillation Experiments, Rev. Mod. Phys. 74 (2002), 297, arXiv:hep-ph/0107277.
- [19] F. Ardellier et al., Double Chooz Collaboration, Double Chooz: A Search for the neutrino mixing angle theta(13), arXiv:hep-ex/0606025.
- [20] J. K. Ahn et al., RENO Collaboration, RENO: An Experiment for Neutrino Oscillation Parameter Using Reactor Neutrinos at Yonggwang, arXiv:1003.1391.
- [21] A. Abusleme et al., JUNO Collaboration, JUNO Physics and Detector, arXiv:2104.02565.
- [22] P. Adamson et al., MINOS Collaboration, Improved search for muon-neutrino to electron-neutrino oscillations in MINOS, Phys. Rev. Lett. 107 (2011), 181802, arXiv:1108.0015.
- [23] K. Abe et al., T2K Collaboration, Indication of Electron Neutrino Appearance from an Accelerator-produced Off-axis Muon Neutrino Beam, Phys. Rev. Lett. 107 (2011), 041801, arXiv:1106.2822.
- [24] Y. Abe et al., Double Chooz Collaboration, Indication of Reactor Disappearance in the Double Chooz Experiment, Phys. Rev. Lett. 108 (2012), 131801, arXiv:1112.6353.
- [25] G. L. Fogli, E. Lisi, A. Marrone, A. Palazzo and A. M. Rotunno, Evidence of 0 from global neutrino data analysis, Phys. Rev. D 84 (2011), 053007, arXiv:1106.6028.
- [26] F. P. An et al., Daya Bay Collaboration, A side-by-side comparison of Daya Bay antineutrino detectors, Nucl. Instrum. Meth. A 685 (2012), 78-97, arXiv:1202.6181.
- [27] F. P. An et al., Daya Bay Collaboration, Observation of electron-antineutrino disappearance at Daya Bay, Phys. Rev. Lett. 108 (2012), 171803, arXiv:1203.1669.
- [28] J. Conrad, Viewpoint: Rethinking the Neutrino, APS Physics 5 (2012), 47.
- [29] J. K. Ahn et al. [RENO], Observation of Reactor Electron Antineutrino Disappearance in the RENO Experiment, Phys. Rev. Lett. 108 (2012), 191802, arXiv:1204.0626.
- [30] Science 338 6114 (2012) 1525–1532.
- [31] breakthroughprize.org/Laureates
- [32] The XXV International Conference on Neutrino Physics and Astrophysics, neu2012.kek.jp.
- [33] F. P. An et al., Daya Bay Collaboration, Improved Measurement of Electron Antineutrino Disappearance at Daya Bay, Chin. Phys. C 37 (2013), 011001, arXiv:1210.6327.
- [34] H. X. Huang, X. C. Ruan, J. Ren, C. J. Fan, Y. N. Chen, Y. L. Lv, Z. H. Wang, Z. Y. Zhou, L. Hou and B. Xin, et al., Manual Calibration System for Daya Bay Reactor Neutrino Experiment, JINST 8 (2013), P09013, arXiv:1305.2343.
- [35] A. Abusleme et al. [JUNO and Daya Bay], Optimization of the JUNO liquid scintillator composition using a Daya Bay antineutrino detector, Nucl. Instrum. Meth. A 988 (2021), 164823, arXiv:2007.00314.
- [36] F. P. An et al., Daya Bay Collaboration, Measurement of electron antineutrino oscillation based on 1230 days of operation of the Daya Bay experiment, Phys. Rev. D 95 (2017) 072006, arXiv:1610.04802.
- [37] F. P. An et al., Daya Bay Collaboration, Spectral measurement of electron antineutrino oscillation amplitude and frequency at Daya Bay, Phys. Rev. Lett. 112 (2014), 061801, arXiv:1310.6732.
- [38] F. P. An et al., Daya Bay Collaboration, New Measurement of Antineutrino Oscillation with the Full Detector Configuration at Daya Bay, Phys. Rev. Lett. 115 (2015) 111802, arXiv:1505.03456.
- [39] D. Adey et al., Daya Bay Collaboration, A high precision calibration of the nonlinear energy response at Daya Bay, Nucl. Instrum. Meth. A 940 (2019), 230-242, arXiv:1902.08241.
- [40] Y. Huang, J. Chang, Y. Cheng, Z. Chen, J. Hu, X. Ji, F. Li, J. Li, Q. Li and X. Qian, et al. The Flash ADC system and PMT waveform reconstruction for the Daya Bay Experiment, Nucl. Instrum. Meth. A 895 (2018), 48-55, arXiv:1707.03699.
- [41] D. Adey et al., Daya Bay Collaboration, Measurement of the Electron Antineutrino Oscillation with 1958 Days of Operation at Daya Bay, Phys. Rev. Lett. 121 (2018) 241805, arXiv:1809.02261.
- [42] M. A. Acero et al. [NOvA], First Measurement of Neutrino Oscillation Parameters using Neutrinos and Antineutrinos by NOvA, Phys. Rev. Lett. 123 (2019) 151803, arXiv:1906.04907.
- [43] K. Abe et al. (Super-Kamiokande Collaboration), Atmospheric neutrino oscillation analysis with external constraints in Super-Kamiokande I-IV, Phys. Rev. D 97 (2018) 072001, arXiv:1710.09126.
- [44] K. Abe et al. (T2K Collaboration), Search for CP Violation in Neutrino and Antineutrino Oscillations by the T2K Experiment with Protons on Target, Phys. Rev. Lett. 121 (2018) 171802, arXiv:1807.07891.
- [45] G. Bak et al. (RENO Collaboration), Measurement of Reactor Antineutrino Oscillation Amplitude and Frequency at RENO, Phys. Rev. Lett. 121 (2018) 201801, arXiv:1806.00248.
- [46] H. de Kerret et al., Double Chooz Collaboration, Double Chooz 13 measurement via total neutron capture detection, Nature Phys. 16 (2020) 558-564, arXiv:1901.09445.
- [47] T. A. Mueller, D. Lhuillier, M. Fallot, A. Letourneau, S. Cormon, M. Fechner, L. Giot, T. Lasserre, J. Martino and G. Mention, et al., Improved Predictions of Reactor Antineutrino Spectra, Phys. Rev. C 83 (2011), 054615, arXiv:1101.2663.
- [48] G. Mention, M. Fechner, T. Lasserre, T. A. Mueller, D. Lhuillier, M. Cribier and A. Letourneau, The Reactor Antineutrino Anomaly,’ Phys. Rev. D 83 (2011), 073006, arXiv:1101.2755.
- [49] P. Huber, On the determination of anti-neutrino spectra from nuclear reactors, Phys. Rev. C 84 (2011), 024617, [erratum: Phys. Rev. C 85 (2012), 029901, arXiv:1106.0687.
- [50] D. V. Naumov, The Sterile Neutrino: A short introduction, EPJ Web Conf. 207 (2019), 04004, arXiv:1901.00151.
- [51] F. P. An et al., Daya Bay Collaboration, Search for a Light Sterile Neutrino at Daya Bay, Phys. Rev. Lett. 113 (2014), 141802, arXiv:1407.7259.
- [52] Y. Declais, J. Favier, A. Metref, H. Pessard, B. Achkar, M. Avenier, G. Bagieu, R. Brissot, J. F. Cavaignac and J. Collot, et al., Search for neutrino oscillations at 15-meters, 40-meters, and 95-meters from a nuclear power reactor at Bugey, Nucl. Phys. B 434 (1995), 503-534.
- [53] J. M. Conrad and M. H. Shaevitz, Limits on Electron Neutrino Disappearance from the KARMEN and LSND -Carbon Cross Section Data, Phys. Rev. D 85 (2012), 013017, arXiv:1106.5552.
- [54] F. P. An et al., Daya Bay Collaboration, Improved Search for a Light Sterile Neutrino with the Full Configuration of the Daya Bay Experiment, Phys. Rev. Lett. 117 (2016) 151802, arXiv:1607.01174.
- [55] P. Adamson et al. , MINOS+ and Daya Bay Collaborations, Improved Constraints on Sterile Neutrino Mixing from Disappearance Searches in the MINOS, MINOS+, Daya Bay, and Bugey-3 Experiments, Phys. Rev. Lett. 125 (2020) 071801, arXiv:2002.00301.
- [56] A. Aguilar-Arevalo et al., LSND Collaboration, Evidence for neutrino oscillations from the observation of appearance in a beam, Phys. Rev. D 64 (2001), 112007, arXiv:hep-ex/0104049.
- [57] A. A. Aguilar-Arevalo et al., MiniBooNE Collaboration, A Combined and Oscillation Analysis of the MiniBooNE Excesses, arXiv:1207.4809.
- [58] P. A. Zyla et al., Particle Data Group, Review of Particle Physics, PTEP 2020 (2020) 083C01.
- [59] P. Adamson et al. , Daya Bay and MINOS], Limits on Active to Sterile Neutrino Oscillations from Disappearance Searches in the MINOS, Daya Bay, and Bugey-3 Experiments, Phys. Rev. Lett. 117 (2016) 151801, arXiv:1607.01177.
- [60] The 26th International Conference on Neutrino Physics and Astrophysics (Neutrino 2014), http://neutrino2014.bu.edu/.
- [61] Seo, Seon-Hee, New results from RENO and the 5 MeV excess, AIP Conference Proceedings 1666 (2015) 080002.
- [62] F. P. An et al., Daya Bay Collaboration, Measurement of the Reactor Antineutrino Flux and Spectrum at Daya Bay, Phys. Rev. Lett. 116 (2016) 061801 , erratum: Phys. Rev. Lett. 118 (2017) 099902, arXiv:1508.04233.
- [63] F. P. An et al., Daya Bay Collaboration, Improved Measurement of the Reactor Antineutrino Flux and Spectrum at Daya Bay, Chin. Phys. C 41 (2017) 013002, arXiv:1607.05378.
- [64] Y. J. Ko et al., NEOS Collaboration, Sterile Neutrino Search at the NEOS Experiment, Phys. Rev. Lett. 118 (2017) 121802, arXiv:1610.05134.
- [65] H. Bonet et al. [CONUS], Constraints on Elastic Neutrino Nucleus Scattering in the Fully Coherent Regime from the CONUS Experiment, Phys. Rev. Lett. 126 (2021) 041804, arXiv:2011.00210.
- [66] D. Adey et al., Daya Bay Collaboration, Improved Measurement of the Reactor Antineutrino Flux at Daya Bay, Phys. Rev. D 100 (2019) 052004, arXiv:1808.10836.
- [67] Y. V. Klimov, V. I. Kopeikin, L. A. Mikaélyan, K. V. Ozerov and V. V. Sinev, Neutrino method remote measurement of reactor power and power output, At. Energy 76 (1994) 123.
- [68] N. S. Bowden, A. Bernstein, S. Dazeley, R. Svoboda, A. Misner and T. Palmer, Observation of the Isotopic Evolution of PWR Fuel Using an Antineutrino Detector, J. Appl. Phys. 105 (2009), 064902, arXiv:0808.0698.
- [69] F. P. An et al., Daya Bay Collaboration, Evolution of the Reactor Antineutrino Flux and Spectrum at Daya Bay, Phys. Rev. Lett. 118 (2017) 251801, arXiv:1704.01082.
- [70] H. Almazán et al. (STEREO Collaboration), Accurate Measurement of the Electron Antineutrino Yield of 235U Fissions from the STEREO Experiment with 119 Days of Reactor-On Data, Phys. Rev. Lett. 125 (2020) 201801, arXiv:2004.04075.
- [71] V. I. Kopeikin, Y. N. Panin and A. A. Sabelnikov, Measurement of the Ratio of Cumulative Spectra of Beta Particles from 235U and 239Pu Fission Products for Solving Problems of Reactor-Antineutrino Physics, Phys. Atom. Nucl. 84 (2021) 1-10.
- [72] I. Alekseev et al. (DANSS Collaboration), Search for sterile neutrinos at the DANSS experiment, Phys. Lett. B 787 (2018), 56-63, arXiv:1804.04046.
- [73] H. Almazán et al. (STEREO Collaboration), Improved sterile neutrino constraints from the STEREO experiment with 179 days of reactor-on data, Phys. Rev. D 102 (2020) 052002, arXiv:1912.06582.
- [74] M. Andriamirado et al. [PROSPECT], Improved short-baseline neutrino oscillation search and energy spectrum measurement with the PROSPECT experiment at HFIR, Phys. Rev. D 103 (2021) 032001, arXiv:2006.11210.
- [75] A. C. Hayes and P. Vogel, Reactor Neutrino Spectra, Ann. Rev. Nucl. Part. Sci. 66 (2016), 219-244, arXiv:1605.02047.
- [76] D. Adey et al., Daya Bay Collaboration, Extraction of the 235U and 239Pu Antineutrino Spectra at Daya Bay, Phys. Rev. Lett. 123 (2019) 111801, arXiv:1904.07812.
- [77] F. P. An et al., Daya Bay Collaboration, Antineutrino Energy Spectrum Unfolding Based on the Daya Bay Measurement and Its Applications, arXiv:2102.04614 (submitted to Chin. Phys. C).
- [78] F. P. An et al., Daya Bay Collaboration, New measurement of via neutron capture on hydrogen at Daya Bay, Phys. Rev. D 93 (2016) 072011, arXiv:1603.03549.
- [79] F. P. An et al., Daya Bay Collaboration, Independent measurement of the neutrino mixing angle via neutron capture on hydrogen at Daya Bay, Phys. Rev. D 90 (2014) 071101, arXiv:1406.6468.
- [80] D. Adey et al., Daya Bay Collaboration, Search for a time-varying electron antineutrino signal at Daya Bay, Phys. Rev. D 98 (2018) 092013, arXiv:1809.04660.
- [81] F. P. An et al., Daya Bay Collaboration, Study of the wave packet treatment of neutrino oscillation at Daya Bay, Eur. Phys. J. C 77 (2017) 606, arXiv:1608.01661.
- [82] F. P. An et al., Daya Bay Collaboration, Cosmogenic neutron production at Daya Bay, Phys. Rev. D 97 (2018) 052009, arXiv:1711.00588.
- [83] F. P. An et al., Daya Bay Collaboration, Seasonal Variation of the Underground Cosmic Muon Flux Observed at Daya Bay, JCAP 01 (2018) 001, arXiv:1708.01265.
- [84] S. Agostinelli et al. [GEANT4], GEANT4–a simulation toolkit, Nucl. Instrum. Meth. A 506 (2003), 250-303.
- [85] T. T. Böhlen, F. Cerutti, M. P. W. Chin, A. Fassò, A. Ferrari, P. G. Ortega, A. Mairani, P. R. Sala, G. Smirnov and V. Vlachoudis, The FLUKA Code: Developments and Challenges for High Energy and Medical Applications, Nucl. Data Sheets 120 (2014), 211-214.