Study of an intermediate age open cluster IC 1434 using ground-based imaging and Gaia DR2 astrometry
Abstract
We present a detailed photometric and kinematical analysis of poorly studied open cluster IC 1434 using CCD VRI, APASS, and Gaia DR2 database for the first time. By determining the membership probability of stars, we identified the 238 most probable members with a probability higher than by using proper motion and parallax data as taken from the Gaia DR2 catalog. The mean proper motion of the cluster is obtained as and mas yr-1 in both the directions of right ascension and declination. The radial distribution of member stars provides cluster extent as 7.6 arcmin. We have estimated the interstellar reddening (E(B-V)) as 0.34 mag using the transformation equations from literature. We obtained the values of cluster age and distance are Myr and Kpc.
.
Open star cluster IC 1434 \addkeywordColor Magnitude Diagram \addkeywordAstrometry
0.1 INTRODUCTION
Open clusters (OCs) are important tools to probe the Galactic disk properties (see, e.g., Friel 1995). OCs are very advantageous to interpret many queries regarding the assessment of chemical abundance gradients in the disk (see, e.g., Twarog, Ashman & Anthony-Twarog 1997; Chen, Hou & Wang 2003), Galactic structure and evolution (e.g., Janes & Adler 1982; Janes & Phelps 1994), interactions between thin and thick disks (e.g., Sandage 1988), as well as the theories of stellar formation and evolution (e.g., Meynet, Mermilliod & Maeder 1993; Phelps & Janes 1993). It’s not an easy task to segregate cluster members from field stars considering OCs are generally projected against the Galactic disc stars. The second data release (DR2) (Gaia Collaboration et al. 2016a) contains 1.7 billion sources and was made public on 2018 April 24 (Jordi et al. 2010; Gaia Collaboration et al. 2016a,b; Salgado et al. 2017). The Gaia DR2 data contains photometric magnitudes in three bands (, , and ) and astrometric data at the sub-milliarcsecond level along with the parallax (Gaia Collaboration et al. 2018a). Gaia data has been used recently by many authors to estimate the membership probability of stars lying towards the cluster regions (Cantat-Gaudin et al. 2018; Gao 2018; Rangwal et al. 2019; Bisht et al. (2019, 2020a, 2020b)).
The open cluster IC 1434 (, ; =99∘.937, =-2∘.700) is located in the second Galactic quadrant. Tadross (2009) analyzed this object using 2MASS and NOMAD data sets. He obtained the age, interstellar reddening (), and distance of this object as 0.32 Gyr, 0.66 mag, and pc, respectively. In this paper, our main goal is to accomplish a deep and precise analysis of an intermediate-age open cluster IC 1434 using CCD , APASS, and Gaia DR2 data.
The layout of the paper is as follows. A brief description of data used, data reduction, and calibration are described in Section 2. Section 3 deals with the study of proper motion and determination of membership probability of stars. The structural properties and derivation of fundamental parameters using the most probable cluster members have been carried out in Section 4. The conclusions are presented in Section 5.
0.2 Observations and calibration of CCD data
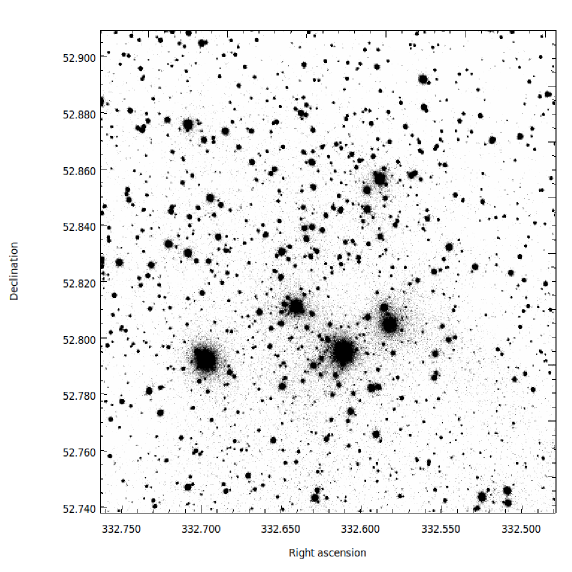
The CCD photometric observations of IC 1434 was carried out using the 74-inch Kottamia astronomical observatory (KAO) of NRIAG in Egypt. Images were collected using a CCD system. The observations were taken at the Newtonian focus with a field area of and a pixel scale of 0′′.305 pixel-1 on November 2013. The read-out noise was 3.9 e-/pixel. Observations were organized in several short exposures with the air mass ranges of 1.32-1.62 in each of the filter as described in Table 1. All CCD frames observed with two amplifiers, which treated for overscan, bias, and flat field corrections using an IRAF’s code written by one of the authors (Y.H.M. Hendy), see Tadross et al. (2018). To perform the photometry, we have used a DAOPHOT package on IRAF (Stetson 1987, 1992). The data reduction procedure has been well explained by Bisht et al. (2019). The identification chart for IC 1434 based on our -band observations is shown in Fig. 1.
To obtain the instrumental magnitudes of stars in the observed field, we used the point spread function of Stetson (1987). We have transformed the pixel coordinates (X and Y) into the right ascension and declination using the astrometry website
(https://nova.astrometry.net/).
| Band | Exposure Time | Date |
|---|---|---|
| (in seconds) | ||
| 1203, 601 | 8th November 2013 | |
| 1202, 601 | ,, | |
| 1203, 601 | ,, |
To transform the instrumental magnitudes into Johnson and Kron-Cousin standard magnitudes, we have used the photometric data available in -band from Maciejewski & Niedzielski (2008) and -bands from the USNO-B1.0 catalog (Monet et al. 2003).
The transformation equations for converting the instrumental magnitude in to standard magnitude, are as follows:
The respective errors in zero points and color coefficients are 0.03 mag shown in the above transformation equations.
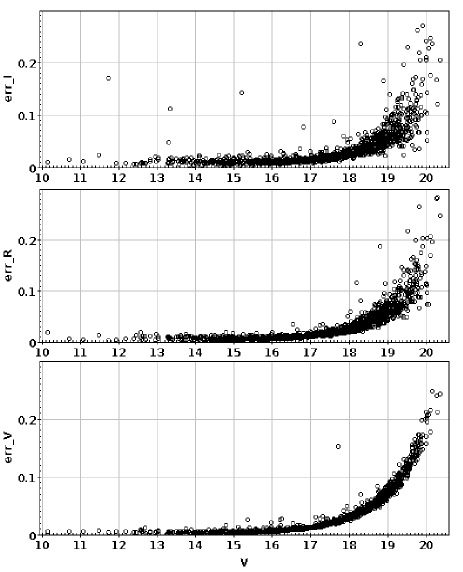
The internal errors derived from DAOPHOT are plotted against magnitude shown in Fig. 2. This figure shows that
the average photometric errors are 0.02 mag at mag, while it is 0.1 mag at mag.
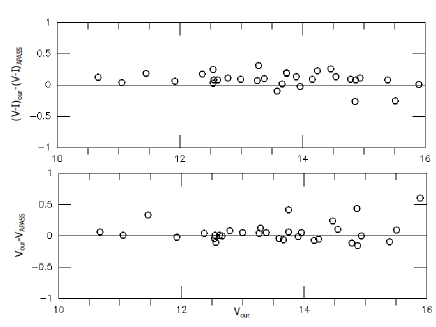
To compare the photometry, we have cross-identified the stars in our observed data with the American Association of Variable Star Observers (AAVSO) Photometric All-Sky Survey (APASS) DR9 catalog. We have assumed that stars are accurately matched if the difference in position is less than 1 arcsec and in this way, we have found 32 common stars accordingly. The APASS survey is cataloged in five filters , , , , and . The range of magnitude in the band is from 7 to 17 mag (Heden & Munari 2014). The DR9 catalog covers almost about 99 of the sky (Heden et al. 2016). To obtain the Cousins band using Sloan photometric bands from the APASS catalog ( = -(0.337 0.191) (-)-(0.370 )), we have adopted the method given by Tadross & Hendy (2016).
The difference indicates that present and (-) measurements are in fair agreement with those stars given in the APASS catalog. The comparable difference is found as 0.07 in the band and 0.08 in (-) as shown in Fig. 3.
0.2.1 Gaia DR2
Gaia DR2 (Gaia Collaboration et al. 2018b) database within a 20′ radius of the cluster is used for the astrometric analysis.
This data consists of positions on the sky , parallaxes and proper motions
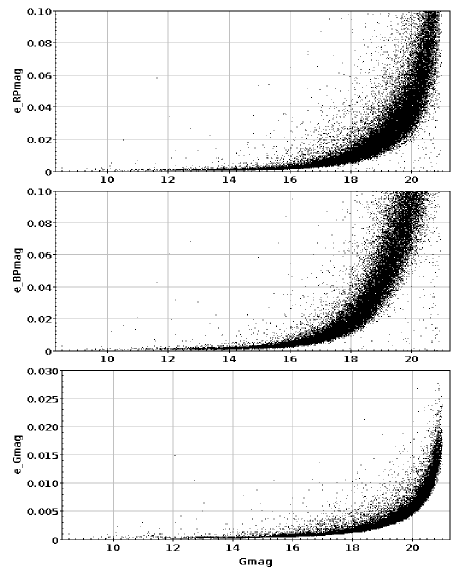
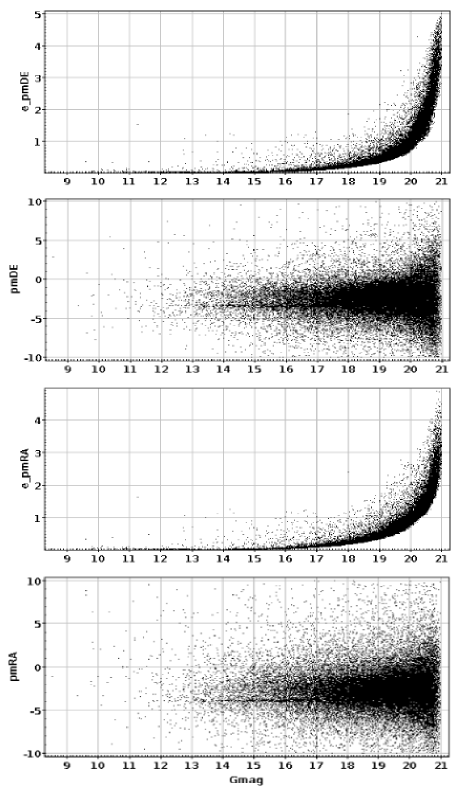
() with a limiting magnitude of mag. The errors in photometric
magnitudes (, , and ) with G mag are shown in Fig 4. In this figure, we find the mean errors in G the band is 0.01 mag while the mean errors in and bands are 0.1 mag at 20 mag. The proper
motions with their respective errors are plotted against magnitude is shown in Fig. 5. The uncertainties in the
corresponding proper motion components are 0.06 mas (for mag), 0.2 mas (for mag), and 1.2 mas (for mag).
0.3 Proper motion study and membership probabilities of stars
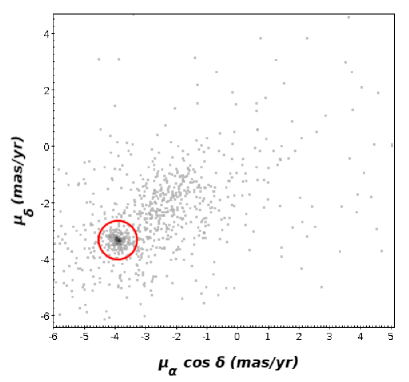
The proper motion of a cluster is a change in its angular position with time as seen from the center of mass of the solar system. Proper motions play an influential role to eliminate non-members from the cluster’s main sequence (Yadav et al. 2013; Bisht et al. 2020a). We have cross-matched our observational data in VRI bands and data from the Gaia DR2 catalog. A circle of 0.6 around the cluster center in the VPD characterizes our membership criteria as shown in Fig. 6. The chosen radius in VPD is a compromise between losing members with poor proper motions and the inclusion of field region stars.
The OCs are highly contaminated by a large number of foreground/background stars especially towards the fainter end of the main sequence.
Vasilevskis et al. (1958) have set up a
mathematical model to obtain membership probabilities of stars using proper motion data. A revised technique was developed
by Stetson (1980) and Zhao & He (1990) to check the membership of stars in OCs based on proper motions. To find the membership
probability of stars towards the region of IC 1434, we have adopted the criteria as discussed by Kharchenko et al. (2004). This
method has been previously used by Bisht et al. (2018) for OCs Teutsch 10 and Teutsch 25. Hendy (2018) also has been used this method for
open cluster FSR 814. The kinematical probability of stars is expressed as:
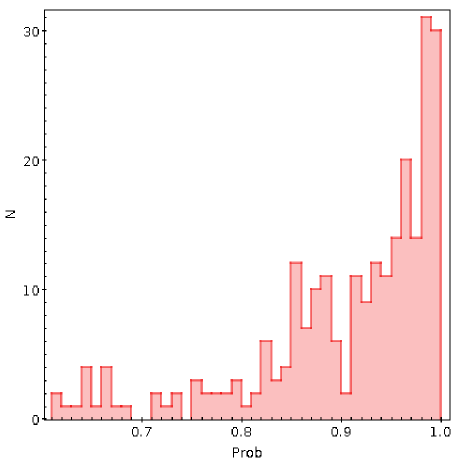
where and . Here and are the proper motion of a particular star, while and are the corresponding errors. The and are the mean value of proper motions, while and are their corresponding standard deviations. Using the above method, we have identified possible members of IC1434 if the membership probability of stars higher than which can be seen in Fig. 7.
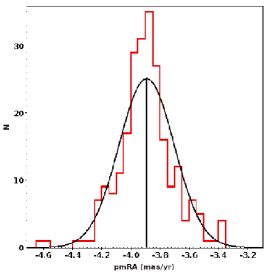
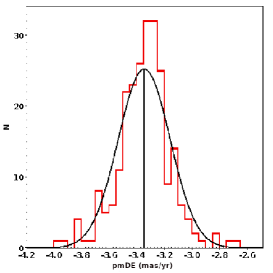
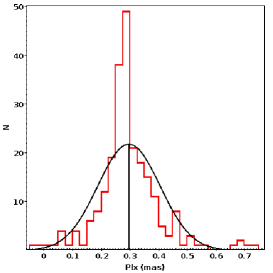
We have used only probable cluster members to estimate the mean value of proper motions and parallax of IC 1434. We have fitted Gaussian profile to the construct histograms shown in Fig. 8. We obtained the mean-proper motion of IC 1434 and mas yr-1 in RA and DEC directions, respectively. We determined the mean value of parallax mas. Our findings are very close with the values given by Cantat-Gaudin et al. (2018).
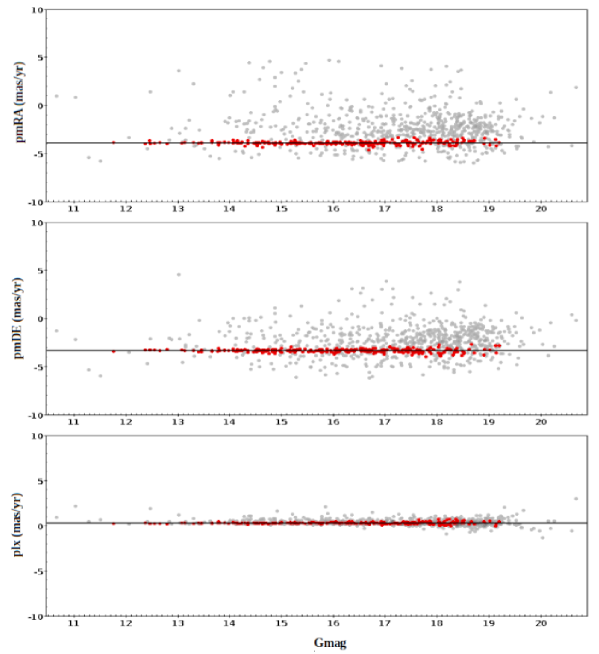
Finally, we have considered a star as the most probable member if it lies within 0.6 mas/yr radius in VPD, having a membership probability higher than and a parallax within from the mean parallax of the cluster IC 1434. In Fig. 9, we have plotted the proper motions and parallax distribution of most probable members as denoted by red dots & all observed stars as denoted by gray dots against magnitude. In this figure, the horizontal solid line indicates the mean value of proper motions and parallax.
0.4 Structural properties of IC 1434
0.4.1 Spatial structure:radial density profile
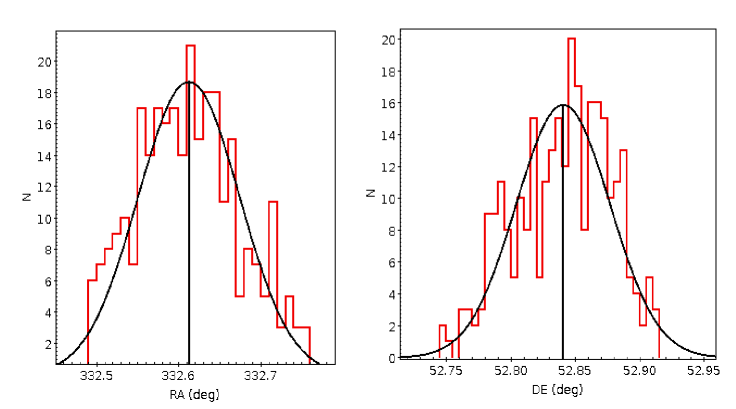
The accuracy of central coordinates is very important for the reliable estimation of the cluster’s main fundamental parameters (e.g., age, distance, reddening, etc.). We applied a star-count technique to obtain the center coordinates towards the area of IC 1434. The resulting histograms in both the RA and DEC directions are shown in the left panel of Fig. 10. The Gaussian curve-fitting at the central zones provides the center coordinates as deg () and deg (). These estimated values are in very good agreement with the values given by Dias et al. (2002) and Cantat-Gaudin et al. (2018).
Radial density profile (RDP) has been plotted in Fig. 11 to estimate the radius of the cluster. We divided the
observed area of IC 1434 into several concentric rings. The number density, , in the ith zone is determined by
using the formula = , where is the number of stars and is the area of the ith
zone. This RDP flattens at 7.6 arcmin and begins to merge with the background density as clearly shown in the right panel
of Fig. 11. Therefore, we consider 7.6 arcmin as the cluster radius. A smooth continuous line represents the fitted King (1962) profile:
| Name | |||||
|---|---|---|---|---|---|
| IC 1434 |
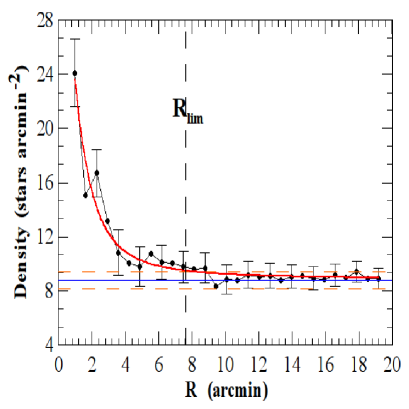
where , , and are the core radius, central density, and the background density level, respectively. By fitting the King model to RDP, we estimated the structural parameters of IC 1434 are listed in Table 2.
We have estimated the concentration parameter using equation ), as given by Peterson & King 1975). In the present study, the concentration parameter is found to be 0.78 for IC 1434. Maciejewski & Niedzielski (2007) reported that may vary for individual clusters from 2 to 7. The estimated value of ( 6.1) shows a fair agreement with the Maciejewski & Niedzielski (2007). We obtained the density contrast parameter () for IC 1434 as 3.7. It is lower than as derived by Bonatto & Bica (2009). This demonstrates that IC 1434 is a sparse cluster.
0.4.2 Age and distance estimation using CMD
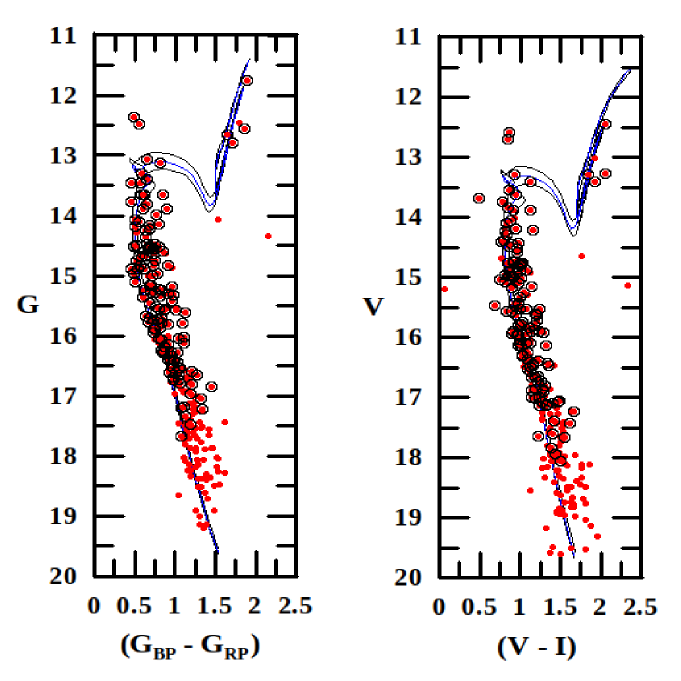
Age and distance are important parameters to trace the structure and chemical evolution of the Milky Way Galaxy using OCs (Friel & Janes 1993). The (, ), and (, ) color magnitude diagrams (CMDs) are shown in Fig. 12. In this figure, filled dots are the most probable cluster members with membership probability 60 while open circles are matched ones with the catalog given by Cantat-Gaudin et al. (2018). The age of IC 1434 has been estimated by fitting the theoretical isochrones of Marigo et al. (2017) with metallicity of to the CMDs as shown in Fig. 12. In this figure, we used the isochrones of different ages of log(age) = (8.75, 8.80 and 8.85). We found the best global fit at log(age)=8.80, which is corresponding to Myr of cluster’s age.
Our estimated value of color-excess in Gaia bands () is 0.43 mag from the isochrones fitting to the CMD’s. We have calculated the interstellar reddening () as 0.34 mag using the transformation equations (= 0.785 ) as taken from Abdelaziz et al. (2020). Distance modulus (=12.51 mag) of IC 1434 provides the heliocentric distance as kpc. Our estimated values of and distance modulus are in fair agreement with the values and =12.43 as obtained by Angelo et al. (2020).
We obtained the Galactocentric distance as kpc by assuming 8.3 kpc distance of the Sun to the Galactic center. The Galactocentric coordinates are estimated as kpc, kpc and kpc. The estimated values of Galactocentric coordinates are very close to the values obtained by Cantat-Gaudin et al. (2018).
We also have checked the distance of IC 1434 using a parallax of stars from the Gaia DR2 catalog. We found the distance of this object as 3.3 kpc which is very close to our estimation from the isochrone fitting method. Angelo et al. (2020), Cantat-Gaudin (2020), Kharchenko et al. (2013), and Tadross (2009) have been determined the distance value of IC 1434 as 3.1, 3.3, 3.2, and 3.0 kpc, respectively. Our derived value of distance is showing very good agreement with Angelo et al. (2020), Cantat-Gaudin (2020), and Kharchenko et al. (2013). The distance estimation of IC 1434 by Tadross (2009) is based on 2MASS and NOMAD data. Our obtained value of the distance is much precise than Tadross (2009) because our estimation is based on good quality optical data along with the high precision Gaia DR2 astrometry.
0.5 Conclusions
We presented the photometric and kinematic study of poorly studied open cluster IC 1434 using CCD and Gaia DR2 data. We have estimated the membership probabilities of stars towards the region of IC 1434 and have found 238 members with a membership probability 60. We have used those probable members to derive the fundamental parameters. The main results of the current investigation are as follows:
-
•
The updated cluster center coordinates are estimated as: deg () and deg () using the most probable cluster members. Cluster radii is obtained as 7.6 arcmin using radial density profile.
-
•
On the basis of the vector point diagram and membership probability estimation of stars, we identified 238 most probable cluster members for IC 1434. The mean PMs of the cluster are estimated and mas yr-1 in both the RA and DEC directions, respectively.
-
•
Distance to the cluster IC 1434 is determined as kpc. This value is well supported by the distance estimated using mean parallax as 3.3 kpc. Age is estimated as Myr by comparing the cluster CMD with the theoretical isochrone given by Marigo et al. (2017) with .
0.6 Acknowledgements
The authors are thankful to the anonymous referee for useful comments, which improved the contents of the paper significantly.
This work is supported by the IMHOTEP collaboration program No. 42088ZK between Egypt and France. D. Bisht is supported by the Natural
Science Foundation of China (NSFC-11590782, NSFC-11421303). This work has made use of data from the European Space Agency (ESA) mission
Gaia (https://www.cosmos.esa.int/gaia), processed by the Gaia Data Processing and Analysis Consortium
(DPAC, https://www.cosmos.esa.int/web/gaia/dpac/consortium). Funding for the
DPAC has been provided by national institutions, in
particular the institutions participating in the Gaia Multilateral Agreement. This work has mad use the TOPCAT http://www.starlink.ac.uk/topcat.
It has been developed mostly in the UK within various UK and Euro-VO projects (Starlink, AstroGrid, VOTech, AIDA, GAVO, GENIUS, DPAC) and
under PPARC and STFC grants. Its underlying table processing facilities are provided by the related packages STIL and STILTS.This research
has made use of Vizier catalogue access tool, CDS, Aladin sky atlas developed at CDS, Strasbourg Observatory, France. This work has made use
of data from the American Association of Variable Star Observers (AAVSO) Photometric All-Sky Survey (APASS) DR9 catalog.
0.7 References
Abdelaziz A.E., Hendy Y.H.M., Shokry A., et al., 2020, Revista Mexicana
de Astronomia y Astrofisica, 56, 245
Angelo M. S., Santos J. F. C., and Corradi W. J. B., 2020, MNRAS, 493,
3473
Bisht D., Ganesh Shashikiran, Yadav R.K.S., et al., Geeta, 2018,
Adv. Space Res., 61, 517
Bisht D., Yadav R.K.S., Ganesh Shashikiran., et al., 2019, MNRAS, 482,
1471B
Bisht D., Zhu Qingfeng., Yadav R.K.S., et al., 2020a, MNRAS, 494, 607-623
Bisht D., Elsanhoury W.H., Zhu Qingfeng, et al. 2020b, AJ, 160, 119B
Bonatto C., and Bica E., 2009, MNRAS 397, 1915
Cantat-Gaudin T., Jordi C., Vallenari A., et al., 2018, A&A, 618, 93
Cantat-Gaudin T., Anders F., and Castro-Ginard A., 2020, A&A, 640A, 1C
Chen L., Hou J.L., and Wang J.J., 2003, AJ, 125, 1397
Dias W. S., Alessi B.S., Moitinho A, et al., 2002, A&A, 389, 873
Friel, E. D., & Janes, K. A. 1993, A&A, 267, 75
Friel E.D., 1995, ARA&A, 33, 381F
Gaia Collaboration et al., 2016a, A&A, 595, A1
Gaia Collaboration et al., 2016b, A&A, 595, A2
Gaia Collaboration et al., 2018a, A&A, 616, A10
Gaia Collaboration et al., 2018b, A&A, 616, A17
Gao Xin-hua, 2018, PASP, 130, 124101
Henden A., Munari U., 2014, Contrib. Astron. Obs. Skalnate Pleso,
43, 518
Heden A., Templeton M., Terrell D., et al. 2016, VizieR Online
Data Catalog, II/336
Hendy Y.H.M., 2018, NRIAG Journal of Astronomy and Geophysics, 7,
180H
Janes K., and Adler D., 1982, ApJS, 49, 425J
Janes K.A., and Phelps R.L., 1994, AJ, 108, 1773J
Jordi C., Gebran M., Carrasco J.M., et al., 2010, A&A, 523, A48
Kharchenko N.V., Piskunov A.E., Roser S., et al., 2004, Astron. Nachr., 325,
740
Kharchenko N.V., Piskunov A.E., Schilbach E., et al., 2013, A&A, 558, A53
King I., 1962, AJ, 67, 471
Marigo P., Girardi L., Bressan A., et al., 2017, ApJ, 835, 77
Maciejewski G., and Niedzielski A., 2007, A&A, 467, 1065
Maciejewski G., and Niedzielski A., 2008, Astron. Nachr., 329, 602
Meynet G., Mermilliod J.-C., and Maeder A., 1993, A&AS, 98, 477M
Monet David G., Levine Stephen E., Canzian Blaise, et al., 2003, AJ, 125,
984M
Peterson C.J., and King I.R., 1975, AJ, 80, 427
Phelps R. L., and Janes K.A., 1993, AJ, 106, 1870
Rangwal G., Yadav R. K.S., Durgapal A., et al., 2019, MNRAS, 490, 1383
Salgado J., Gonzalez-Nunez J., Gutierrez-Sanchez R., et al., 2017, A&C, 21,
22S
Salpeter E.E., 1955, ApJ, 121, 161
Sandage A., 1988, BAAS, 20, 1037S
Spitzer L., and Hart M., 1971, ApJ, 164, 399
Stetson P.B., 1980, AJ, 85, 387
Stetson P.B., 1987, PASP, 99, 191
Stetson P.B., 1992. In: Warrall, D.M., Biemesderfer, C., Barnes J., (Eds.),
Astronomical Data Analysis Software and System I. ASP Conf. Ser.
vol. 25, Astron. Soc. Pac., San Francisco, pp. 297
Tadross A. L., 2009, New Astronomy, 14, 200
Tadross A.L., and Hendy Y.H.M., 2016, Journal of the Korean
Astronomical Society, 49, 57
Tadross A.L., Bendary R., Hendy Y., et al., 2018, Astron. Nachr., 339,
698
Twarog Bruce A., Ashman Keith M., and Anthony-Twarog Barbara J.,
1997, AJ, 114, 2556T
Vasilevskis S., Klemola A., and Preston G., 1958, AJ, 63, 387
Yadav R.K.S., Sariya D.P., and Sagar R., 2013, MNRAS, 430, 3350
Zhao J.L., and He Y.P., 1990, A&A, 237, 54