Quantum oscillations, Magnetic breakdown and thermal Hall effect in Co3Sn2S2
Abstract
Co3Sn2S2 is a ferromagnetic semi-metal with Weyl nodes in its band structure and a large anomalous Hall effect below its Curie temperature of 177 K. We present a detailed study of its Fermi surface and examine the relevance of the anomalous transverse Wiedemann Franz law to it. We studied Shubnikov-de Haas oscillations along two orientations in single crystals with a mobility as high as 103 cm2V-1s-1 subject to a magnetic field as large as 60 T. The angle dependence of the frequencies is in agreement with density functional theory (DFT) calculations and reveals two types of hole pockets (H1, H2) and two types of electron pockets (E1, E2). An additional unexpected frequency emerges at high magnetic field. We attribute it to magnetic breakdown between the hole pocket H2 and the electron pocket E2, since it is close to the sum of the E2 and H2 fundamental frequencies. By measuring the anomalous thermal and electrical Hall conductivities, we quantified the anomalous transverse Lorenz ratio, which is close to the Sommerfeld ratio () below 100 K and deviates downwards at higher temperatures. This finite temperature deviation from the anomalous Wiedemann-Franz law is a source of information on the distance between the sources and sinks of the Berry curvature and the chemical potential.
I Introduction
Magnetic topological materials have attracted tremendous recent attentionPRL2014 ; Nakatsuji2015 ; Yan2017 ; Smej . Co3Sn2S2 is one of them, which has a kagome lattice and becomes ferromagnetic below 177 K Vaqueiro . It is a half-metal, as the spin degeneracy of its carriers is almost entirely lifted in the ferromagnetic phase Schnelle ; Holder . It is a semimetal with an equal number of electrons and holes. The density of these carriers is in the range of 1019cm-3 Ding2019 , so that one electron and one hole is shared by more than a thousand atoms.
The observation of a sizeable anomalous Hall effect in this context makes this solid an appealing platform. Because of the low carrier density, the anomalous Hall angle becomes remarkably large LiuEnke2018 ; Lei2018 , as large as 33% in iron-doped samples at low temperature AFM2020 . Angle-resolved photoemission spectroscopy ChenYulin2019 and scanning tunneling microscopy Morali2019 and magneto-optical studies MO2020 confirm that is a magnetic Weyl semimetal with a topologically non-trivial electronic structure. The high mobility of carriers in this low-density semi-metal generates an ordinary Nernst coefficient Behnia2016 on top of the anomalous Nernst response. A study of its thermoelectric response Ding2019 has documented the contrasting evolution of the ordinary and anomalous components of the Nernst response. As expected in a Berry-curvature picture, increasing disorder enhances the anomalous Nernst effect and reduces the ordinary Nernst effect. Ding2019 .
In this paper, we present two distinct experimental studies of Co3Sn2S2. First of all, we report on the fermiology of this system by studying quantum oscillations on high-mobility crystals in presence of strong magnetic fields. Our sample has a residual resistivity ratio (RRR) of 30 and its mobility is as large as 2.7103 cm2V-1s-1. Using pulsed magnetic fields up to 61 T and low temperatures, we tracked quantum oscillations with magnetic field perpendicular and parallel to the -axis([0001]). The angle dependence of the observed frequencies was compared with what is expected according to the density functional theory (DFT) calculations. There were consistent. In addition, we found an unexpected frequency emerging at high field and attributed it to a magnetic breakdown orbit between a hole-like and an electron-like orbit. In a type II Weyl semimetal, magnetic breakdown between Weyl nodes in momentum space is reminiscent of Klein tunneling Brien2016 . However, the observed breakdown frequency is close to the sum of the two fundamental frequencies (and not their difference, which was predicted Brien2016 ). In this respect, magnetic breakdown in Co3Sn2S2 is reminiscent of what has been observed in WTe2 Zhu2015 and in elemental metals, Mg Shoenberg and Be Shoenberg and contrasts with what was reported in the case of ZrSiSMuller2020 . The second component of the present report is a quantitative study of the thermal Hall effect. This complements previous studies of the anomalous Hall LiuEnke2018 ; Lei2018 ; Ding2019 and anomalous Nernst Ding2019 effects in this system. Putting the anomalous Lorenz ratio (i.e. the ratio of anomalous thermal and electrical conductivities divided by temperature) under scrutiny, we found that the anomalous transverse Wiedemamn-Franz law ((WF law)) holds at low temperature, but a downward deviation starts above 100K. In this regard, Co3Sn2S2 is reminiscent of Mn3Ge Xu2020 and contrasts with Mn3Sn Li2018 , in which the anomalous WF law holds even at room temperature. As argued previously Xu2020 , the temperature at which the departure from the anomalous WF law occurs depends on the details of the Berry curvature in the vicinity of the Fermi level.
II Experimental and computational details
High quality single crystals of Co3Sn2S2 were grown by the self-flux method as in a previous work Growth2020 . A stoichiometric ratio of Co, Sn and S powders was sealed in a quartz tube. The quartz tube was loaded into a box furnace and heated to 673 K and held for 24 hours. Then the tube was heated to 1273 K and held for 12 hours, then slowly cooled to 1073 K and the furnace was turned off. Shining crystals were obtained by mechanical separation carefully. The low-field transport measured by a standard four-probe method was performed on a physical property measurement system (Quantum Design PPMS-9). High-field magnetotransport measurements were carried out under pulsed magnetic field in Wuhan National High Magnetic Field Center, each contact resistance was less than 3 in all the measurements.
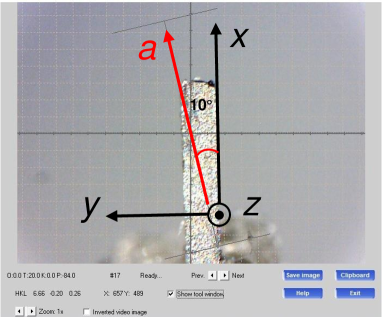
Our calculations were performed using the density-functional theory (DFT) in the framework of the generalized gradient approximation PBE1996 ) with the Vienna ab-intio packageKresse1999 . To interpolate the 3D Fermi surfaces, we obtained by a tight-binding Hamiltonian, based on localized Wannier functions Mostofi2008 projected from the DFT Bloch wave functions. We note that the orientations of is defined as the current direction, and the angle between and the [21̄1̄0] orientation is about 10∘ (see more details in supplementary material SM and Fig.1a), is defined as [0001] orientation.
III Carrier density, mobility and the anomalous Hall conductivity
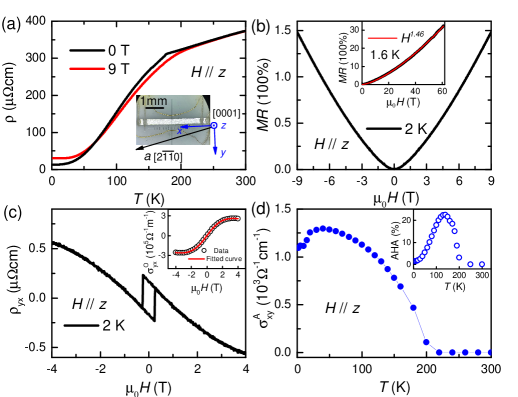
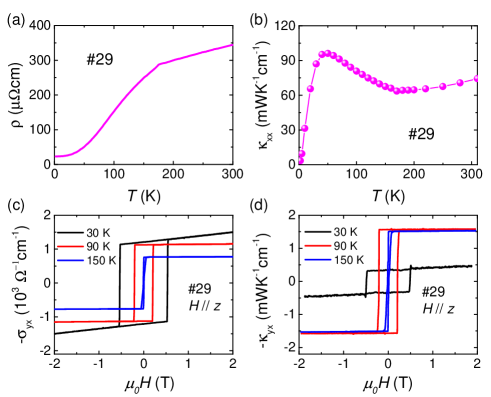
Fig. 1(a) shows the temperature dependence of resistivity measured as the current was applied along -axis at zero field (black) and 9 T (red) along -axis. A kink at Curie temperature 175 K is visible in at zero field. The temperature dependence of resistivity shows a metallic behavior with a residual resistivity rate of RRR . This is larger than what has been reported previously LiuEnke2018 ; Lei2018 ; Ding2019 ; Tanaka2020 ; nano2020 , indicating the high quality of the sample. Accordingly, the residual resistivity cm is also smaller than was found before LiuEnke2018 ; Lei2018 . The higher mobility leads to a larger magnetoresistance. This has been explored in other semi-metals, such as WTe2 Ali2014 ; Zhu2015 , WP2 Kumar2017 , PtBi2 Gao2017 ; Zhao2018 and in Sb Fauque2018 . Fig. 1(b) displays the non-saturated positive magnetoresistance (MR = ) to 150% under the magnet field of 9 T. As shown in the inset, the MR curve shows dependence up to 61 T at 1.6 K.
Fig. 1(c) shows the nonlinear field dependence of the Hall resistivity at 2 K. The inset shows the field dependence of the ordinary Hall conductivity () after subtracting anomalous partDing2019 . The red line represents a two-band fit to the data, using the expression:
| (1) |
This allowed us to deduce the carrier density of holes (electrons): cm-3 ( cm-3) and hole (electron) mobilities of cm2V-1s-1 ( cm2V-1s-1). The average transport mobility can also be extracted from residual resitivity at zero magnetic field , using cm2V-1s-1.
Fig. 1(d) shows the temperature dependence of the anomalous Hall conductivity (AHC) attains 1290 cm-1 at 40 K and 1093 cm-1 at 2 K, the anomalous Hall angle AHA reaches at 140 K, similar to previous reportsLiuEnke2018 ; Lei2018 . In contrast to dirtier samples, the anomalous Hall conductivity slightly decreases below 50 K. Such a behavior was previously noticed in cleaner samples Ding2019 .
IV The Fermi surface
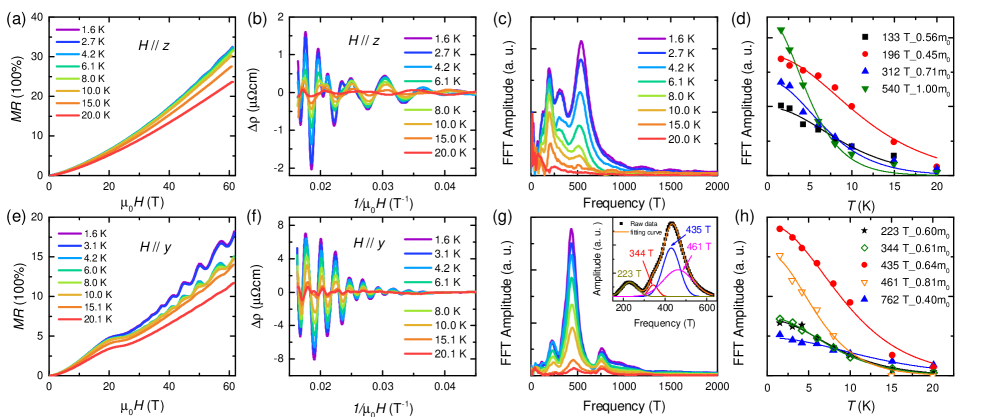
Fig. 2 (a) and Fig. 2 (e) display the temperature dependence of magnetoresistance under high magnetic field along -axis and -axis. Quantum oscillations of resitivity, known as the Shubnikov-de Haas (SdH) effect, are observed when the magnetic field exceeds 20 T. A plateau in magnetoresistance appears around 20 T when the magnetic field is parallel to the -axis. When the magnetic field is parallel to the plane, the saturation field for magnetization is about 23 T Shen2019 . Therefore, the resistivity plateau is concomitant with the field-induced rotation of the magnetic moments from -axis to the -plane.
As shown in Fig. 2 (b) and (f), the SdH oscillations become clearly visible by subtracting a polynomial background from the data. Fig. 2 (c) and (g) present the fast Fourier transformation (FFT) spectrum of the oscillating component, at different temperatures. Some of the broad asymmetric peaks in the FFT spectrum , such as the peak around 430 T for are caused by superposition of multiple peaks. We fit them, using the Gauss multi-peak methodYBCO2009 . The evolution of these peaks at different temperatures is shown in the inset of the Fig.2g.
We can identify four peaks in the case of and five peaks in , respectively. These frequencies observed in FFT spectra are closely related with the orthogonal extremal cross-sectional area () of the Fermi pockets by the Onsager relation . We extracted the effective mass by fitting the temperature dependence of the oscillation amplitude with the thermal damping term of the Lifshitz-Kosevich (L-K) formula LK1956 , where and is the effective cyclotron mass. We obtain the effective masses of different frequencies as shown in the Fig. 2(d) and (h). The parameters for pockets in two orientations are summarized in Table 1. We note that the Dingle mobility is about 30 times lower than the transport mobility. A much larger difference between the two mobilities has been reported in other semi-metals, such as Sb, WP2 and Cd3As2. In all cases, transport mobility is significantly larger than quantum mobility. In other words, the mean-free-path for momentum relaxation is longer than the one associated with the distance between collisions which broaden the Landau levels Jaoui2020 .
| E1 | E2 | H1 | H2 | E1 | H1 | E2 | H2 | H1’ | ||
| 208 | 297 | 118 | 418 | 235 | 219 | 356 | 395 | 432 | ||
| (Å-2) | 19.9 | 28.4 | 11.2 | 39.9 | 22.4 | 20.9 | 34 | 37.7 | 41.8 | |
| (T) | 196 | 312 | 133 | 540 | 214 | 343 | 429 | 462 | ||
| (Å-2) | 18.9 | 30.3 | 12.7 | 51.5 | 20.4 | 32.7 | 40.9 | 44.1 | ||
| (me) | 0.45 | 0.71 | 0.56 | 1.00 | 0.52 | 0.64 | 0.53 | 0.81 | ||
| (meV) | 50.4 | 50.8 | 27.5 | 62.5 | 47.6 | 62.0 | 93.7 | 66.0 | ||
| (K) | 30.8 | 15.1 | 22.9 | |||||||
| (cm2/Vs) | 106 | 221 | 191 |
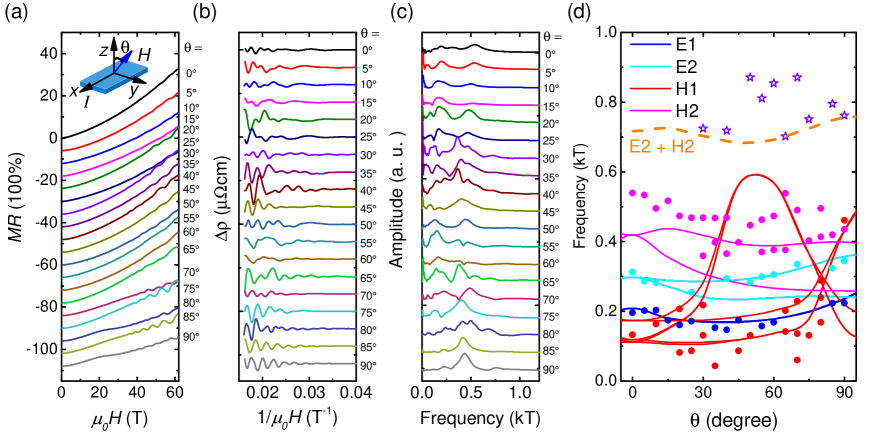
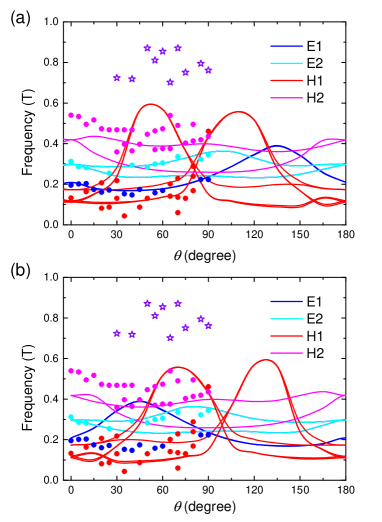
We studied the evolution of the SdH oscillations at 1.6 K with rotation. Fig. 3(a) presents the angle-dependence of MR which decreases gradually when the field rotates away from the -axis to the -axis. is defined by the angle between the field and the -axis, the MR reaches a minimum value at when the field is parallel to the axis. Fig. 3(b) shows SdH oscillations for each angle after subtracting a fitted polynomial. The angle dependencies of the frequencies extracted from the SdH oscillations are summarized in Fig. 3 (d). Symbols show the data and lines represent the DFT calculations.
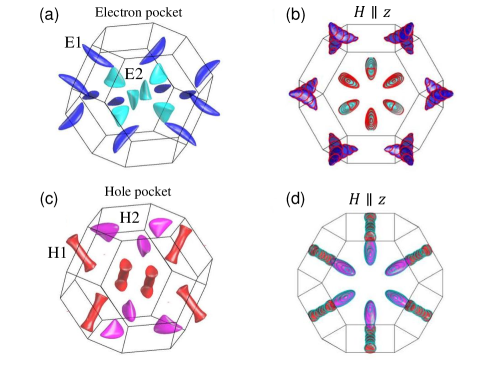
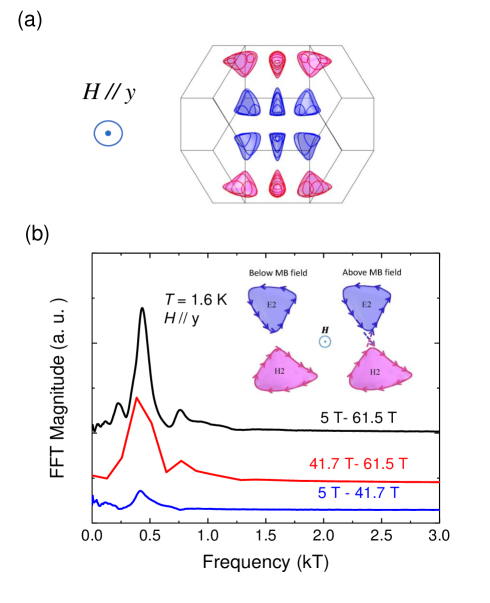
According to the DFT calculations, Co3Sn2S2 has two types of electron pockets and two types of hole pockets. We labeled each pocket as shown in Fig. 4. In the case of electrons, there are twelve banana-shape pockets(E1) across the Brillouin zone, and six triangle-like pockets (E2) near the point shown in the Fig. 4(a). In the case of holes, there are six cylinder-like pockets (H1) across the Brillouin zone and six triangular-like pocket(H2) close to the kz boundary shown in the Fig. 4(c).
We rotated the magnetic field in the plane. When the magnetic field is aligned along the -axis () the extreme cross-section is identical for each type of pocket and one expects to see four distinct frequencies. When the magnetic field has a finite angle with the axis, the extreme cross-section degeneracy of pockets of the same type is lifted and more than four frequencies is expected. The calculated H1 pocket can have two maximum extreme cross-section and one local minimum cross-section, since it has a quasi- cylindrical shape. Note that the calculated SdH frequencies are not symmetric between + to direction and – to direction. (see the SM for more discussionSM ).
Fig. 4 shows the calculated Fermi surface pockets and their projections along high-symmetry -axis. The electron pockets are in blue and the hole pockets are in red. The Fermi pockets distribution follow the My symmetry and inversion symmetry. The total volume of the Fermi pockets yields the the theoretical carrier densities. The calculated hole density is 1.82 1020 cm-3 and for the electron carrier density is 1.59 1020 cm-3 at meV with respect to the charge neutral point. As discussed above, our experimental Hall conductivity together with two-band fitting yields a carrier density, which is approximately twice lower. A similar discrepancy between experimental and theoretical carrier density was observed in the case of WTe2 Zhu2015 .
V Magnetic breakdown
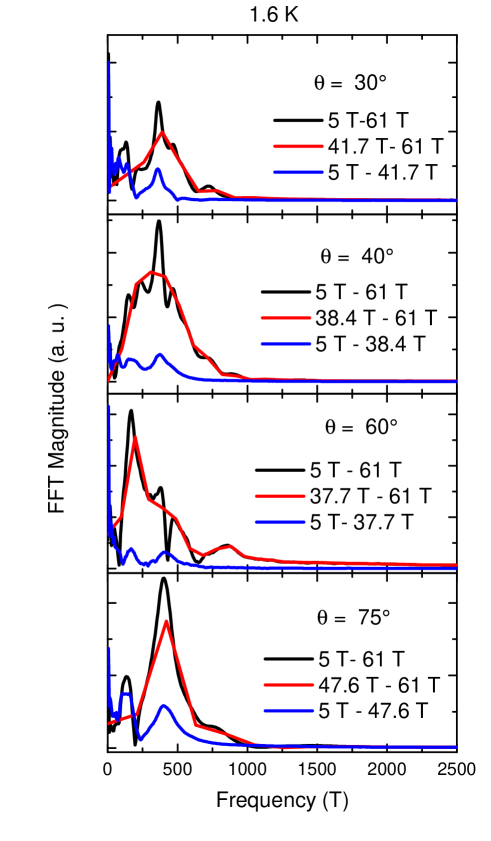
As shown in the Fig. 3(d), there is a satisfactory consistency between experimental and theoretical results. DFT calculations do not expect any frequency larger than 600 T. However, a FFT peak is present at 760 T, when the magnetic field is parallel to the -axis. We attribute this frequency to a magnetic breakdown orbit. As shown in Fig. 3(d), this frequency is observed in the angular range of to and it corresponds roughly to sum of E2 and H2 frequencies. Fig.5(a) shows the cross sections of the E2 and H2 pockets when the field is parallel to -axis.
For , the 760 T frequency suddenly appears above a threshold field of 41.7 T. This can be seen in Fig. 5(b), which presents the FFT spectrum for different field windows. We suggest that above 41.7 T magnetic breakdown occurs between the electron pocket E2 and the hole pocket H2, which according to the DFT calculations are close to each other in the momentum space. When the field is in the axis (), each of these pockets has two distinct extreme orbits and therefore two distinct frequencies. The fundamental frequencies of 343 T (for E2) and 429 (for H2) are the larger ones and their sum is close to the observed frequency of 760 T. The angle dependence of the magnetic breakdown frequency is roughly consistent with the sum of fundamental frequencies of the E2 and H2 in the Fig.3(d). The breakdown field which is defined as varies with rotation between 35 T and 48 T (See the SM for more details).
Magnetic breakdown in momentum space between an electron and hole pocket resembles the Klein tunneling at a junction in real space Brien2016 . We note, however, that theory expects that this Klein tunneling leads to a breakdown frequency equal to the difference between the two original fundamental frequencies and not the sum as we observe here. Previous experiments have reported the observation of magnetic breakdown in two other topological materials, WTe2Zhu2015 and ZrSiSMuller2020 . In the case of WTe2, the breakdown frequency is the sum of two fundamental frequencies. But, this breakdown may occur between the adjacent two hole pockets. In ZrSiSMuller2020 , magnetic breakdown is found to happen between pockets of opposite signs. There are multiple breakdown frequencies, which include not only the difference between frequencies, but also different combinations fundamental frequencies.
VI The anomalous thermal Hall effect and the Wiedemann-Franz law
Non-vanishing summation of the electronic Berry curvature is known to generate the intrinsic anomalous Hall effect (AHE). Measuring the thermoelectric (Nernst) and the thermal (Righi-Leduc) counterparts of the anomalous Hall effect provides additional information on the topological origin of the AHE. The amplitude of the anomalous transverse thermoelectric conductivity has been found to correlate with the amplitude of the anomalous Hall conductivityXu2020b . In this section we focus on the correlation between anomalous electrical and thermal Hall conductivities.
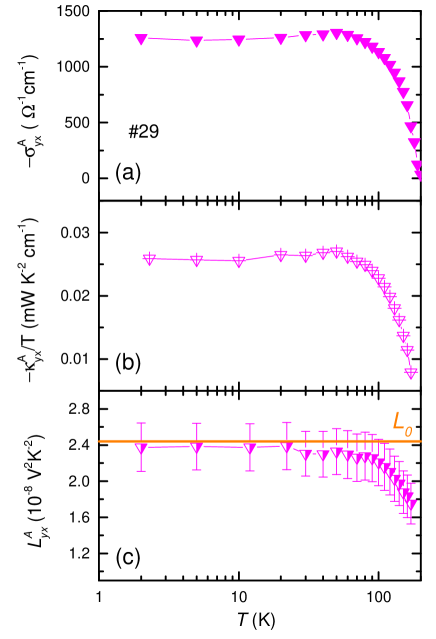
Fig.6(a,b) show the temperature dependence of the anomalous Hall conductivity () and the anomalous thermal Hall conductivity () in another sample #29 (See the supplement for the raw dataSM ), grown by chemical vapor transport method Ding2019 . Below the Curie temperature, both increase rapidly with decreasing temperature and saturate to an almost temperature-independent magnitude below 100 K. The magnitude of is consistent with the previous reportsLiuEnke2018 ; Lei2018 ; Ding2019 . Our data allows to check the validity of the anomalous Wiedemann-Franz Law for transverse response Li2018 ; Xu2020 by comparing the anomalous Lorenz number with the Sommerfeld value where and are the elementary charge of electron and the Boltzmann constant, respectively.
As seen in Fig.6(c), the Wiedemann-Franz Law holds below 100 K. This confirms once again that the anomalous Hall response is a Fermi surface (and not a Fermi sea) property as originally argued by Haldane Haldane . However, above 100 K, a downward deviation in the the Wiedemann-Franz Law emerges. As argued previously Xu2020 , this deviation can be understood as the manifestation of the way the Berry curvature is averaged by thermal and electric probes. In a manner similar to Mn3Ge Xu2020 , the downward deviation from the WF law in Co3Sn2S2 arises when is evolving with temperature. Interestingly, according to a recent study of optical conductivity, in the ferromagnetic phase of Co3Sn2S2, bands shift with increasing magnetization on Co sites. Such an evolution with temperature approaching the Curie temperature can generate a difference between the way Berry curvature is integrated in the electrical and the thermal channels Yang2020 .
VII Summary
In summary, we performed a study of quantum oscillations of magnetoresistance in high-quality single crystals of Co3Sn2S2 up to 61 T. We found a good agreement between the frequency of these oscillations and the Fermi surface of Co3Sn2S2 according to DFT calculations. The Fermi surface consists of two types of electron pockets and two types of hole pockets. We detected an additional frequency and attributed it to magnetic breakdown between an electron and a hole pocket. We also found that the anomalous transverse Wiedemann-Franz law holds at low temperature, but a downward deviation emerges at finite temperature.
VIII Acknowledgments
This work was supported by the National Science Foundation of China (Grant No. 51861135104 and 11574097), the National Key Research and Development Program of China (Grant No.2016YFA0401704), and the Fundamental Research Funds for the Central Universities (Grant no. 2019kfyXMBZ071). B.Y. acknowledges the financial support by the Willner Family Leadership Institute for the Weizmann Institute of Science, the Benoziyo Endowment Fund for the Advancement of Science, Ruth and Herman Albert Scholars Program for New Scientists, and the European Research Council (ERC) under the European Union’s Horizon 2020 research and innovation programme (grant agreement No. 815869). K. B. was supported by the Agence Nationale de la Recherche (ANR-18-CE92-0020-01; ANR-19-CE30-0014-04).
†binghai.yan@weizmann.ac.il
*kamran.behnia@espci.fr
‡zengwei.zhu@hust.edu.cn
References
- (1) Chen H, Niu Q and Macdonald A H 2014 Phys. Rev. Lett. 112 017205
- (2) Nakatsuji S, Kiyohara N and Higo T, 2015 Nature 527 212
- (3) Yan B and Felser C 2017 Annu. Rev. Condens. Matter Phys. 8 337
- (4) Šmejkal L, Mokrousov Y, Yan B and MacDonald A H 2018 Nat. Phys. 14 242-251
- (5) Vaqueiro P and Sobany G G 2009 Solid State Sci. 11 513
- (6) Holder M, Dedkov Y S, Kade A, Rosner H, Schnelle W, Leithe-Jasper A, Weihrich R and Molodtsov S L 2009 Phys. Rev. B 79 205116
- (7) Schnelle W, Leithe-Jasper A, Rosner H, Schappacher F M, Pöttgen R, Pielnhofer F and Weihrich R 2013 Phys. Rev. B 88, 144404
- (8) Behnia K and Aubin H 2016 Rep. Prog. Phys. 79 046502
- (9) Ding L, Koo J, Xu L, Li X, Lu X, Zhao L, Wang Q, Yin Q, Lei H, Yan B, Zhu Z and Behnia K 2019 Phys. Rev. X 91 41061
- (10) Liu E, Sun Y, Kumar N, Muechler L, Sun A, Jiao L, Yang S-Y, Liu D, Liang A, Xu Q, Kroder J, SüßV, Borrmann H, Shekhar C, Wang Z, Xi C, Wang W, Schnelle W, Wirth S, Chen Y, Goennenwein S T B and Felser C 2018 Nat. Phys. 14 1125
- (11) Wang Q, Xu Y, Lou R, Liu Z, Li M, Huang Y, Shen D, Weng H, Wang S and Lei H 2018 Nat. Commun. 9 3681
- (12) J Shen, Zeng Q, Zhang S, Sun H, Yao Q, Xi X, Wang W, Wu G, Shen B, Liu Q and Liu E 2020 Adv. Funct. Mater. 32 2000830
- (13) Liu D F, Liang A J, Liu E K, Xu Q N, Li Y W, Chen C, Pei D, W. Shi J, Mo S K, Dudin P, Kim T, Cacho C, Li G, Sun Y, Yang L X, Liu Z K, Parkin S S P, Felser C and Chen Y L 2019 Science 365 1282
- (14) Morali N, Batabyal R, Nag P K, Liu E, Xu Q, Sun Y, Yan B, Felser C, Avraham N and Beidenkopf H 2019 Science 365 1286
- (15) Okamura Y, Minami S, Kato Y, Fujishiro Y, Kaneko Y, Ikeda J, Muramoto J, Kaneko R, Ueda K, Kocsis V, Kanazawa N, Taguchi Y, Koretsune T, Fujiwara K, Tsukazaki A, Arita R, Tokura Y and Takahashi Y 2020 Nat. Commun. 11 4619
- (16) O’Brien T E, Diez M and Beenakker C W J 2016 Phys. Rev. Lett. 116 236401
- (17) Zhu Z, Lin X, Liu J, Fauqué B, Tao Q, Yang C, Shi Y and Behnia K 2015 Phys. Rev. Lett. 114 176601
- (18) D. Shoenberg, Magnetic oscillations in metals, Cambridge University Press (1984)
- (19) Müller C S A, Khouri T, van Delft M R, Pezzini S, Hsu Y T, Ayres J, Breitkreiz M, Schoop L M, Carrington A, Hussey N E; Wiedmann S 2020 Physical Review Research 2 023217
- (20) Xu L, Li X, Lu X, Collignon C, Fu H, Koo J,Fauqué B, Yan B, Zhu Z and Behnia K 2020 Sci. Adv. 6 eaaz3522
- (21) Li X, Xu L, Ding L, Wang J, Shen M, Lu X, Zhu Z and Behnia K 2017 Phys. Rev. Lett. 119 056601
- (22) Xu Y, Zhao J, Yi C, Wang Q, Yin Q, Wang Y, Hu X, Wang L, Liu E, Xu G, Lu L, Soluyanov A A, Lei H, Shi Y, Luo J and Chen Z G 2020 Nat. Commun. 11 3985
- (23) Perdew J P, Burke K and Ernzerhof M 1996 Phys. Rev. Lett. 77 3865
- (24) Kresse G and Joubert D 1999 Phys. Rev. B 59 1758
- (25) Mostofi A A, Yates J R, Pizzi G, Lee Y S, Souza I, Vanderbilt D and Marzari N 2014 Comput. Phys. Commun. 185 2309-2310
- (26) Please see the SM for more discussions
- (27) Tanaka M, Fujishiro Y, Mogi M, Kaneko Y, Yokosawa T, Kanazawa N, Minami S, Koretsune T, Arita R, Tarucha S, Yamamoto M and Tokura Y 2020 Nano Lett. 20 7476-7481
- (28) Yang S Y, Noky J, Gayles J, Dejene F K, Sun Y, Dörr M, Skourski Y, Felser C, Ali M N, Liu E and Parkin S S P 2020 Nano Lett. 20 7860-7867
- (29) Ali M N, Xiong J, Flynn S, Tao J, Gibson Q D, Schoop L M, Liang T, Haldolaarachchige N, Hirschberger M, Ong N P and Cava R J 2014 Nature 514 205-208
- (30) Kumar N, Sun Y, Xu N, Manna K, Yao M, Süss V, Leermakers I, Young O, Förster T, Schmidt M, Borrmann H, Yan B, Zeitler U, Shi M, Felser C and Shekhar C 2017 Nat. Commun. 8 1642
- (31) Gao W, Hao N, Zheng F W, Ning W, Wu M, Zhu X, Zheng G, Zhang J, Lu J, Zhang H, Xi C, Yang J, Du H, Zhang P, Zhang Y and Tian M 2017 Phys. Rev. Lett. 118 256601
- (32) Zhao L, Xu L, Zuo H, Wu X, Gao G and Zhu Z 2018 Phys. Rev. B 98 085137
- (33) Fauqué B, Yang X, Tabis W, Shen M, Zhu Z, Proust C, Fuseya Y, and Behnia K 2018 Phys. Rev. Materials 2 114201
- (34) Shen J, Zeng Q, Zhang S, Tong W, Ling L, Xi C, Wang Z, Liu E, Wang W, Wu G and Shen B 2019 Appl. Phys. Lett. 115 212403
- (35) Audouard A, Jaudet C, Vignolles D, Liang R, Bonn D A, Hardy W N, Taillefer L and Proust C 2009 Phys. Rev. Lett. 103 157003
- (36) Lifshits I and Kosevich A M 1956 Sov. Phys. JETP 2 636-645
- (37) Jaoui A, Fauqué B and Behnia K 2020 Nat. Commun. 12 195
- (38) Yang R, Zhang T, Zhou L, Dai Y, Liao Z, Weng H and Qiu X 2020 Physical Review Letters 124 077403
- (39) Xu L, Li X, Ding L, Chen T, Sakai A, Fauqué B, Nakatsuji S , Zhu Z and Behnia K 2020 Phys. Rev. B 101 180404(R)
- (40) Haldane F D M 2004 Phys. Rev. Lett. 93 206602
Supplemental Materials for ”Bulk Fermi surface of the ferromagnetic Kagome-lattice semimetal Co3Sn2S2”
S1 determining the in-plane orientation of the sample
High quality single crystals of Co3Sn2S2 were grown by the self-flux method, the nature cleavage plane is the -plane of the single crystals. The -axis can be identified easily, while the orientations of the single crystal in -plane were confirmed by single-crystal XRD technique. The angle between -axis and the is about 10∘, as the figure S1 shows.
S2 Raw data of Hall conductivity and thermal Hall conductivity
By measuring the field dependence of resistivity Fig. S2(a) and Hall resistivity Fig. S2(b), we can deduce the Hall conductivity through as the field is along or the axis. After plotted the Hall conductivity in the Fig. S2(c), the anomalous Hall conductivity can be easily obtained by extrapolate the normal part of the Hall effect to zero field. The intersect at the the axis of the =0 in the Fig. S2(d) is the anomalous Hall conductivity. On the other hand, the thermal Hall conductivity can be obtained by measuring transverse thermal gradient with the measured longitudinal thermal conductivity sm_Xiaokang2017 , where the is the thermal density along . The anomalous thermal Hall effect then is obtained by the same method as described for anomalous Hall effect.
S3 The breakdown fields for different angles
| E2 (T) | H2 (T) | MB (T) | ||
|---|---|---|---|---|
| ∘ | 343 | 429 | 760 | 41.7 |
| ∘ | 323 | 416 | 789 | 43.4 |
| ∘ | 403 | 751 | 47.6 | |
| ∘ | 376 | 702 | 35.1 | |
| ∘ | 305 | 473 | 854 | 37.7 |
| ∘ | 299 | 462 | 810 | 38.2 |
| ∘ | 293 | 468 | 718 | 38.4 |
| ∘ | 468 | 724 | 41.7 |
The breakdown fields for different angles were determined by carrying out FFT in different field ranges in the Fig. S3. The black lines are for a field range from 5 T to 61 T. The blue lines are for the field range where no breakdown peak presents, while the red lines for the field range where breakdown peak presents. The table S1 shows the summary of the results from experiments. The absence of the E2 in the table S1 is due to the small amplitude of the peak in the FFT. Below 30∘, the breakdown frequency is not observable.
S4 The angle-dependence of FFT lines in theoretical calculation
As mentioned in the main text, the calculated SdH frequencies are not symmetric between + to direction (a) and – to direction(b), because of the low symmetry in the plane. From our experimental data, we can’t distinguish the plane the sample was rotated from + to direction or – to direction. By the comprising with the experimental data in the Fig.S4(a), the Fig. 3d shows better overlap between theoretical and experimental results.
References
- (1) Li X, Xu L, Ding L, Wang J, Shen M, Lu X, Zhu Z and Behnia K 2017 Phys. Rev. Lett. 119 056601