Effect of the metallicity on the capacitance of gold – aqueous sodium chloride interfaces
Abstract
Electrochemistry experiments have established that the capacitance of electrode-electrolyte interfaces is much larger for good metals such as gold and platinum than for carbon-based materials. Despite the development of elaborate electrode interaction potentials, to date molecular dynamics simulations were not able to capture this effect. Here we show that changing the width of the Gaussian charge distribution used to represent the atomic charges in gold is an effective way to tune its metallicity. Larger Gaussian widths lead to a capacitance of aqueous solutions (pure water and 1 molar NaCl) in good agreement with recent ab initio molecular dynamics results. For pure water, the increase in the capacitance is not accompanied with structural changes, while in the presence of salt the Na+ cations tend to adsorb significantly on the surface. For a strongly metallic gold electrode, these ions can even form inner sphere complexes on hollow sites of the surface.
I Introduction
Classical molecular dynamics simulations of electrode – electrolyte interfaces bring important microscopic insights for the interpretation of electrochemistry experiments Scalfi, Salanne, and Rotenberg (2021). They are not only relevant in the case of concentrated electrolytes, for which classical theories fail to capture many effects such as ion-ion correlations Kornyshev (2007), but also in cases where the molecular structure of the solvent can impact the interfacial properties Son and Wang (2021). Even though most of the recent works were dedicated to the study of supercapacitors Salanne et al. (2016), in which the electrode is generally a carbon material and the electrolyte an organic or ionic liquid, systems made of good metals such as platinum or gold put in contact with water were also considered. Such studies have evidenced very interesting phenomena, such as the formation of a strongly bound water adlayer at the surface of the metal displaying hydrophobic features Willard et al. (2009); Limmer et al. (2013); Willard et al. (2013). Recently, the role of this adlayer on the adsorption of hydrophobic solutes and on the energetics of electrochemical reactions occurring at the interface was further investigated Serva et al. (2021). However, these simulations were not able to reproduce one of the key experimental quantities, namely the capacitance of the interface. Extracting quantitative numbers from experiments is difficult due to many specific adsorption processes, but it is well accepted that this value should typically be in the range of 20 to 50 F cm-2, although recent experiments on platinum suggest even larger values Ohja et al. (2020), up to 100–200 F cm-2. So far, simulation studies only reported single-electrode capacitances in the range of 5–10 F cm-2 for aqueous electrolytes Willard et al. (2009).
Although such lower capacitance could be attributed to specific interactions occurring at the interface, including chemisorption effects that would not be captured by conventional force fields, recent ab initio molecular dynamics simulations of interfaces with gold electrodes do not support this hypothesis Goldsmith, Calegari Andrade, and Selloni (2021); Li et al. (2019). Indeed these calculations yield estimates of the capacitance of 15 F cm-2 to 30 F cm-2, while the structure of the adsorbed water layer is very similar to the one of previous classical simulations. This therefore points towards a limitation of the classical models used in the molecular dynamics to describe the metal and its interactions with the electrolyte. In particular, its metallicity, or metallic character, reflects the strength of the electronic response to external fields such as the ones due to the adsorption of charged or polarized species, and is expected to play an important role. In a recent work, we have introduced a semi-classical Thomas-Fermi electrode model to account for the kinetic energy of the electrons. This allowed us to study the effect of the Thomas-Fermi screening length on the accumulation of charge at the electrode surface, the structure of the interfacial electrolyte and the capacitance in conditions corresponding to materials with poor metallic properties such as carbon Scalfi et al. (2020a). In parallel, Sato and co-workers have shown that similar effects can be expected by changing the width of the Gaussian charge distributions which are used for the electrode atoms Nakano and Sato (2019); Oshiki, Nakano, and Sato (2021). Here we build on these works to investigate the impact of the latter parameter in the case of gold electrodes put in contact with aqueous solutions. We show that increasing the Gaussian width may lead to a substantial increase of the capacitance, which is accompanied by changes of the ionic adsorption profiles, while the water layers remain largely unchanged.
II Choice of the electrode model parameters
Over the past decade, fluctuating-charge models have been widely used to simulate electrochemical systems in which the potential of electrode atoms is fixed. First introduced by Siepmann and Sprik Siepmann and Sprik (1995), the main ingredients are (i) the use of atom-centered Gaussian charge distributions for the electrode atoms:
| (1) |
where is the width of the distribution and is the position of atom , and (ii) the application of a constant potential condition for all the atoms within an electrode material. As discussed at length in Ref. 13, the use of the Gaussian charges introduces a self-interaction term inversely proportional to , which can thus be linked to the hardness parameter of the charge-equilibration method Mortier, Ghosh, and Shankar (1986); Rappe and Goddard III (1991) as . The latter is generally used in other contexts, but it was recently used in a series of works devoted to electrode-electrolyte interfaces Onofrio, Guzman, and Strachan (2015); Onofrio and Strachan (2015); Buraschi, Sansotta, and Zahn (2020). Note that besides this self-energy term, the Gaussian width also impacts all the electrostatic interactions involving electrode atoms so that the two approaches are not strictly equivalent.
It is thus instructive to compare the value of the hardness corresponding to the usual choice for the Gaussian width with typical hardness values from the literature. Siepmann and Sprik proposed to adjust this value in order to match the energy of a system made of a single charge adsorbed on a flat metallic surface to the one obtained in the continuum limit, yielding Å for platinum Siepmann and Sprik (1995). In the absence of a generic criterion, this value was then also used for other materials. It is worth noting that most of these studies focused on carbon and generally yielded interfacial properties in good agreement with experiments. Yet, as discussed in Ref. 14, this corresponds to a hardness 20 eV, quite far from the expected gas-phase value for carbon (10 eV), gold (6.92 eV) or platinum (7 eV) Pearson (1987). Even though atomic parameters such as hardness are not expected to be directly transferable from gaseous to condensed phase, because of the different electronic structures, such a gap calls for an examination of the influence of this quantity.
We recently introduced a semi-classical Thomas-Fermi electrode model, with an additional term accounting for the kinetic energy of the electrons in the metal Scalfi et al. (2020a). This term, arising from a description of the electronic properties of the materials instead of the atoms, contributes in the classical description to the self-energy of the electrode atoms by increasing the “effective” hardness. We analyzed the impact of this screening length at fixed Gaussian width Å, which corresponds to materials with poor metallic character. In this work, we focus instead on a good metal, gold, and study the effect of increasing the Gaussian width, from an initial value of 0.43 Å to an upper limit of 1.17 Å, which corresponds to the gas-phase hardness of the atom.
III Simulation details
All simulations were performed using the molecular dynamics code MetalWalls Marin-Laflèche et al. (2020). Two different systems were simulated, both with two gold electrodes, each with 1620 atoms distributed in 10 planes and their (100) face in contact with the liquid between them. In the first case, the liquid consists of pure water (2160 molecules), while in the second it also contains 39 NaCl pairs, resulting in a 1 mol L-1 NaCl(aq) electrolyte. In both cases, the lateral box dimensions are = =36.63 Å.
For each system, the distance between the two inner planes of the electrodes was equilibrated at atmospheric pressure by applying a constant pressure force to the electrodes, yielding distances of 48.93 Å and 50.67 Å for the two systems, respectively. As in our previous work Scalfi et al. (2020a), water molecules are modeled using the SPC/E force field Berendsen, Grigera, and Straatsma (1987), while the Lennard-Jones parameters for Na+ and Cl- were taken from Ref. 24 and the ones for the electrode atoms from Ref. 25. The simulations were run in the ensemble with a timestep of 2 fs; a Nosé-Hoover thermostat chain Martyna, Klein, and Tuckerman (1992) was used with a time constant of 1 ps to maintain a temperature of 298 K. The electrode charges were calculated at each timestep using a matrix inversion method Scalfi et al. (2020b) to enforce both a constant applied potential of 0 V betweeen the two electrodes and the electroneutrality constraints on the charges. Widths of 0.43, 0.59, 0.82, 1.06 and 1.17 Å were used for the Gaussian charge distribution. In the case of pure water the simulation times used for equilibration and production were of 1 ns and 5 ns. For the second system, they were of 1 ns and 9 ns except for the largest value of (1.17 Å) for which they were increased to 2 ns and 25 ns in order to reach convergence for the structural properties and for the calculation of the differential capacitance.
IV Gold – water interface
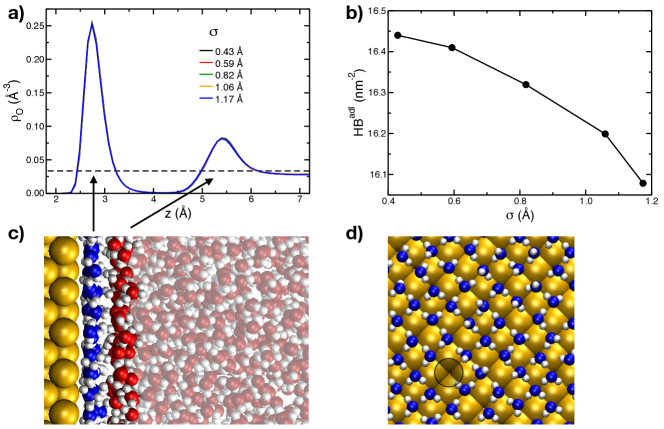
We first focus on the most simple system in which the gold electrodes are separated by pure water. Figure 1a shows that the atomic density profiles of water across the electrochemical cell do not change with the Gaussian width. The structure at the interface was already described in previous work Clabaut et al. (2020): Water molecules form a tightly bound adlayer (located at less than 4.0 Å from the surface), with an average of 12 molecules per nm2, in which they adopt a flat orientation – see the snapshots of a lateral and a top view of this adlayer on Figures 1c and 1d. To further characterize the structural changes, the number of hydrogen bonds (HB) per unit area was determined within these adlayer water molecules. Two molecules are considered to form a HB White et al. (2000) when the O(-H)O distance is smaller than 3.2 Å and the corresponding angle is in the range .
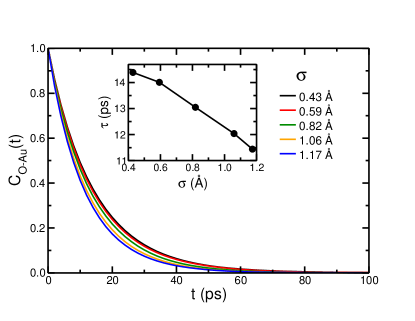
Figure 1b shows that the number of HBs within the adlayer decreases with the Gaussian width: On average there are 16.55 HBs nm-2 for = 0.43 Å and 16.05 HBs nm-2 for = 1.17 Å. This suggests that the water molecules may be less bonded within the adlayer and less strongly bound to the surface. To investigate this possibility, we estimate the characteristic adsorption lifetime of the water molecules, , as the time integral of the following correlation function:
| (2) |
where if a water molecule is continuously interacting with the gold surface from time 0 to time , and 0 otherwise. A water molecule is considered as interacting with the Au surface via its O atom if: (1) the distance between the inner Au plane and the water oxygen atom is less than 4.0 Å (i.e. the water molecule belongs to the adlayer) and (2) both Au-O-H angles are greater than 60∘. This characteristic adsorption lifetime decreases from 14 to 11 ps when the gold charges Gaussian width increases (Figure 2).
These structural and dynamic changes remain relatively small, in agreement with our previous work on poorly metallic electrodes Scalfi et al. (2020a). Nevertheless, the latter study showed that the capacitance is generally more sensitive to the electrode metallicity, so that we determined the differential capacitance from the fluctuations of the total charge of the electrode Scalfi et al. (2020b):
| (3) |
where , with the instantaneous total charge of the left electrode (which is strictly opposite to the charge of the right electrode since an electroneutrality constraint is imposed at each timestep) and is a contribution arising from the charge fluctuations suppressed in the Born-Oppenheimer dynamics of the charges and corresponding to the capacitance of the empty capacitor Scalfi et al. (2020b) (i.e. in the absence of liquid between the electrodes). Note that is the capacitance of the full system. Since there is no voltage between the two electrodes, they are equivalent and the single-electrode capacitance is simply .
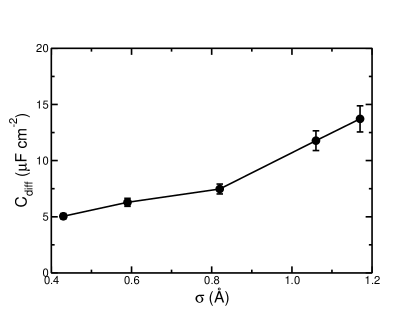
The capacitance is shown as a function of the Gaussian width on Figure 3, with confidence intervals obtained from the standard error on the variance corrected for data correlations as where is the total sampling time and is the correlation time Zwanzig and Ailawadi (1969). There is a clear effect of the Gaussian width since the capacitance switches from 5 F cm-2 for = 0.43 Å, in agreement with previous works, Willard et al. (2009) to a value of 13 F cm-2 for = 1.17 Å. Due to the insulating character of pure water, it is not possible to compare these numbers with an experimental value. However recent ab initio molecular dynamics simulations performed on (111) surfaces of gold provided capacitances of 15 and 30 F cm-2. The difference between the two ab initio values probably lies in the different setups. Indeed, the first work involves a single electrode and the water layer consists of a slice of explicit water molecules followed by a dielectric continuum, Goldsmith, Calegari Andrade, and Selloni (2021) while in the second one the electrochemical cell is made of a slab of gold in contact with a slab of pure water molecules only. Li et al. (2019) The method for charging the electrodes was also different since in the first case a net charge was added to the system, while in the second case it was achieved by introducing explicit Na+ counterions. In addition, due to the use of density functional theory to calculate the atomic forces both studies were limited in terms of system size and sampling time, with production trajectories of 10 ps only. Nevertheless, we note that the capacitance we obtain for the larger Gaussian width is in much better agreement with these two studies than the prediction of the more usual, smaller width.
V Gold – aqueous sodium chloride interface
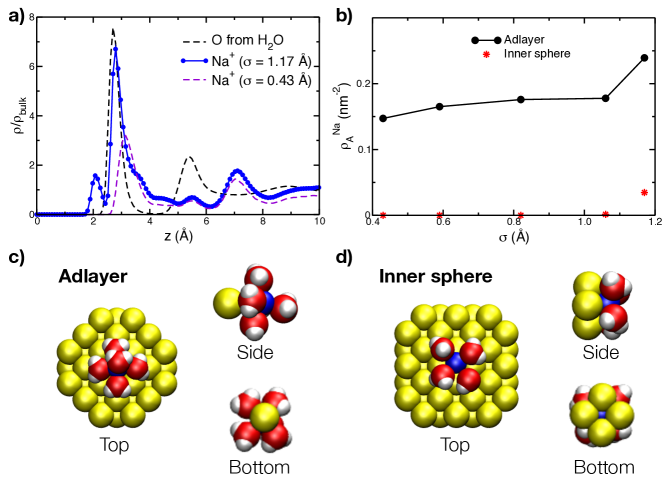
The structural variation is much more pronounced for the aqueous NaCl solution. Indeed, although the adsorption profile of the water molecules also remains unchanged, it is not the case for the ions, in particular for the Na+. As shown on Figure 4a, and in agreement with our previous study, Scalfi et al. (2020a) the first layer of Na+ ions is located at approximately 3.1 Å from the surface for the smallest Gaussian width, i.e. they lie just above the water adlayer. The corresponding concentration is of 0.15 ions nm-2 as shown on Figure 4b. Further examination of the structure of this adsorption mode leads to the picture shown on Figure 4c: The ion is located on top of a gold atom; it is solvated by 3.5 water molecules from the adlayer on average (4 on the snapshot shown) and by 1 water molecule from the second water layer, which corresponds to a typical octahedral coordination shell (consisting of 1 gold atom and 5 water molecules in total). When the Gaussian width is increased, the preferential position of Na+ ions progressively shifts inside the water adlayer; as shown on the Figure 4a the corresponding peak is almost superimposed with the one of the oxygen atoms. In parallel, their surfacic concentration increases, slightly until = 1.06 Å and more noticeably for = 1.17 Å.
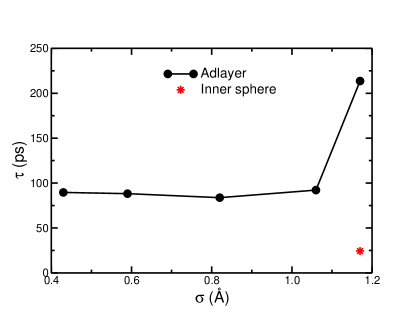
For the latter width, we also observe the appearance of another adsorption mode in which the Na+ ions adopt an inner sphere structure. It is represented on Figure 4d, where it appears that the ion sits in a hollow site of the gold surface and is thus coordinated to four gold atoms. In addition, it remains solvated by 4 water molecules from the adlayer. The distance between the Na+ ions and the surface in this adsorption mode, which is of approximately 2.1 Å, is in good agreement with previous DFT calculations made on similar surfaces, Geada et al. (2018) and the corresponding concentration is of 0.07 ions nm-2. The calculated Na+ adsorption lifetimes are provided on Figure 5. They are larger by almost one order of magnitude than the ones previously calculated for water molecules for most of the Gaussian widths ( ps) except for the largest one, for which we observe a large increase for the ions adsorbed in the adlayer. The lifetime of the Na+ ions in the inner sphere is noticeably shorter (25 ps).
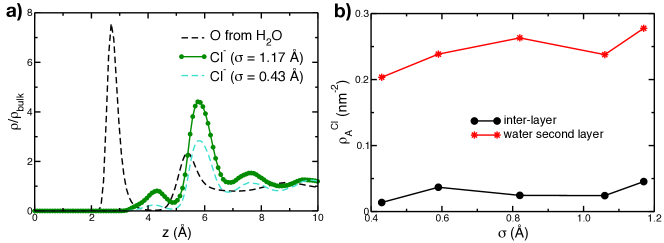
The adsorption profile of the chloride anions is very different from the one of the sodium cations, due to their larger ionic radius and to their different solvation shell structure. As shown on Figure 6a, the Cl- ions also have two different adsorption positions, but in that case they are both observed for all the values. In the first adsorption mode they sit in the inter-layer region located between the water adlayer and the bulk liquid, and in the second one they are located slightly below the water second layer. The corresponding concentrations increase progressively with the Gaussian width (Figure 6b), but the variation is much weaker than in the case of the Na+ ions.
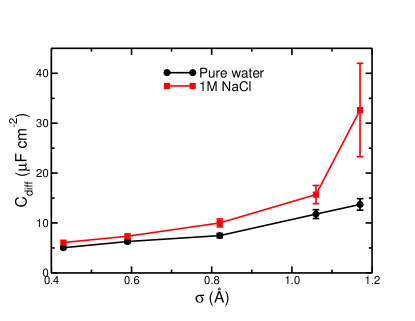
The increase of the capacitance with the Gaussian width is much more pronounced in the presence of salt than in pure water, as shown on Figure 7. The value obtained for the largest Gaussian width (33 F cm-2) is much closer to experimental results generally obtained with good metals such as gold and platinum than in previous simulation studies. It is also worth noting it agrees well with the ab initio MD simulation in which Na+ counterions were explicitly included. Li et al. (2019) It is therefore possible that the discrepancy observed between the two previously discussed ab initio studies is due to the effect of ion adsorption. Increasing the Gaussian width to 1.25 Å, which is the largest value for which simulations remained stable (with respect to the self-consistent calculation of electrode charges), further confirmed the trend since it yielded a capacitance as large as 125 F cm-2, but with a very wide confidence interval. In addition, 50 ns production runs were not sufficient to converge the adsorption lifetimes of the ions. Although such a capacitance seems to be too large, we note that recent experimental work reported values of the same order of magnitude Ohja et al. (2020). This suggests that such large values may deserve more attention in the future.
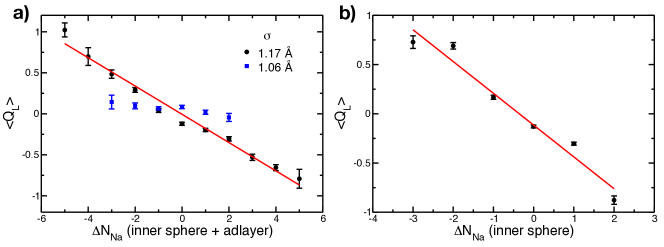
In order to assess the role of the ion adsorption/desorption on the electrode charge fluctuations, hence on the capacitance, we have computed the average charge on the left electrode at fixed Na+ imbalance between the two electrodes, where can be computed either taking into account all the adsorbed layer or restricting to the inner sphere only. In the former case, results are shown for the two largest values on Figure 8a. For = 1.06 Å no correlation is visible, while for 1.17 Å the two quantities are anti-correlated, reflecting the opposite charge induced by an adsorbed ion. In the absence of any other species, one would expect to scale as -0.5 . Here we obtain a slope of -0.17, which points to additional mechanisms, such as changes in the interfacial chloride density or the reorganization of the water molecules. When the analysis is restricted to the inner sphere, the anti-correlation is also visible, with a larger slope of -0.32, showing the crucial role played by these ions on the overall capacitance.
VI Conclusion
We have evidenced the importance of the parameterization of the electrostatic parameters on the electrode/electrolyte properties. More precisely, changing the width of the Gaussian charge distribution used to represent the atomic charges in the electrode is an effective way to tune its metallicity. By focusing on aqueous interfaces with gold electrodes, we have shown that larger Gaussian widths lead to an increase in the interfacial capacitance – for the considered nanocapacitors, by a factor 3 in the case of pure water, and even larger for 1 molar NaCl. The values obtained for the largest Gaussian widths are in much better agreement (compared to the typical width used in the literature) with experimental data available as well as with recent ab initio molecular dynamics results. For pure water, the evolution of the capacitance with the Gaussian width is not accompanied with structural changes, while in the presence of salt the Na+ cations tend to adsorb significantly on the surface. In particular, we observe the appearance of an inner sphere adsorption mode on hollow sites of the surface. These results open the way towards a more quantitative comparison between interfaces of metallic electrodes and varying electrolytes. For example, it will be very interesting to study the impact of the metallicity on highly concentrated electrolytes and ionic liquids.
Acknowledgements
The authors thank J. Linnemann and K. Tschulik for useful discussions. This project has received funding from the European Research Council under the European Union’s Horizon 2020 research and innovation programme (grant agreements No. 771294 and 863473). This work was supported by the French National Research Agency (Labex STORE-EX, Grant ANR-10-LABX-0076). The authors acknowledge HPC resources granted by GENCI (resources of IDRIS, Grant No. A0100910463) and by the HPCaVe Centre at Sorbonne Université.
References
- Scalfi, Salanne, and Rotenberg (2021) L. Scalfi, M. Salanne, and B. Rotenberg, “Molecular simulation of electrode-solution interfaces,” Ann. Rev. Phys. Chem. 72, 189–212 (2021).
- Kornyshev (2007) A. A. Kornyshev, “Double-layer in ionic liquids: paradigm change?” J. Phys. Chem. B 111, 5545–5557 (2007).
- Son and Wang (2021) C. Y. Son and Z.-G. Wang, “Image-charge effects on ion adsorption near aqueous interfacesv,” Proc. Natl. Acad. Sci. U.S.A. 118, e2020615118 (2021).
- Salanne et al. (2016) M. Salanne, B. Rotenberg, K. Naoi, K. Kaneko, P.-L. Taberna, C. P. Grey, B. Dunn, and P. Simon, “Efficient Storage Mechanisms for Building Better Supercapacitors,” Nat. Energy 1, 16070 (2016).
- Willard et al. (2009) A. P. Willard, S. K. Reed, P. A. Madden, and D. Chandler, “Water at an electrochemical interface - a simulation study,” Faraday Discuss. 141, 423–441 (2009).
- Limmer et al. (2013) D. T. Limmer, A. P. Willard, P. Madden, and D. Chandler, “Hydration of metal surfaces can be dynamically heterogeneous and hydrophobic,” Proc. Natl. Acad. Sci. U.S.A. 110, 4200–4205 (2013).
- Willard et al. (2013) A. P. Willard, D. T. Limmer, P. A. Madden, and D. Chandler, “Characterizing heterogeneous dynamics at hydrated electrode surfaces,” J. Chem. Phys. 138, 184702 (2013).
- Serva et al. (2021) A. Serva, M. Salanne, M. Havenith, and S. Pezzotti, “Size dependence of hydrophobic hydration at electrified gold/water interfaces,” Proc. Natl. Acad. Sci. U.S.A. 118, e2023867118 (2021).
- Ohja et al. (2020) K. Ohja, N. Arulmozhi, D. Aranzales, and M. T. M. Koper, “Double layer at the pt(111)–aqueous electrolyte interface: Potential of zero charge and anomalous gouy–chapman screening,” Angew. Chem., Int. Ed. 59, 711–715 (2020).
- Goldsmith, Calegari Andrade, and Selloni (2021) Z. K. Goldsmith, M. F. Calegari Andrade, and A. Selloni, “Effects of applied voltage on water at a gold electrode interface from ab initio molecular dynamics,” Chem. Sci. 12, 5865–5873 (2021).
- Li et al. (2019) C.-Y. Li, J.-B. Le, Y.-H. Wang, S. Chen, Z.-L. Yang, J.-F. Li, J. Cheng, and Z.-Q. Tian, “In situ probing electrified interfacial water structures at atomically flat surfaces,” Nat. Mater. 18, 697–701 (2019).
- Scalfi et al. (2020a) L. Scalfi, T. Dufils, K. G. Reeves, B. Rotenberg, and M. Salanne, “A semiclassical Thomas–Fermi model to tune the metallicity of electrodes in molecular simulations,” J. Chem. Phys. 153, 174704 (2020a).
- Nakano and Sato (2019) H. Nakano and H. Sato, “A chemical potential equalization approach to constant potential polarizable electrodes for electrochemical-cell simulations,” J. Chem. Phys. 151, 164123 (2019).
- Oshiki, Nakano, and Sato (2021) J. Oshiki, H. Nakano, and H. Sato, “Controlling potential difference between electrodes based on self-consistent-charge density functional tight binding,” J. Chem. Phys. 154, 144107 (2021).
- Siepmann and Sprik (1995) J. I. Siepmann and M. Sprik, “Influence of Surface-Topology and Electrostatic Potential on Water Electrode Systems,” J. Chem. Phys. 102, 511–524 (1995).
- Mortier, Ghosh, and Shankar (1986) W. J. Mortier, S. K. Ghosh, and S. Shankar, “Electronegativity-equalization method for the calculation of atomic charges in molecules,” J. Am. Chem. Soc. 108, 4315–4320 (1986).
- Rappe and Goddard III (1991) A. K. Rappe and W. A. Goddard III, “Charge equilibration for molecular dynamics simulations,” J. Phys. Chem. 95, 3358–3363 (1991).
- Onofrio, Guzman, and Strachan (2015) N. Onofrio, D. Guzman, and A. Strachan, “Atomic origin of ultrafast resistance switching in nanoscale electrometallization cells,” Nat. Mater. 14, 440–446 (2015).
- Onofrio and Strachan (2015) N. Onofrio and A. Strachan, “Voltage equilibration for reactive atomistic simulations of electrochemical processes,” J. Chem. Phys. 143, 054109 (2015).
- Buraschi, Sansotta, and Zahn (2020) M. Buraschi, S. Sansotta, and D. Zahn, “Polarization effects in dynamic interfaces of platinum electrodes and ionic liquid phases: A molecular dynamics study,” J. Phys. Chem. C 124, 2002–2007 (2020).
- Pearson (1987) R. G. Pearson, “Absolute electronegativity and hardness: application to inorganic chemistry,” Inorg. Chem. 27, 734–740 (1987).
- Marin-Laflèche et al. (2020) A. Marin-Laflèche, M. Haefele, L. Scalfi, A. Coretti, T. Dufils, G. Jeanmairet, S. Reed, A. Serva, R. Berthin, C. Bacon, S. Bonella, B. Rotenberg, P. A. Madden, and M. Salanne, “Metalwalls: A classical molecular dynamics software dedicated to the simulation of electrochemical systems,” J. Open Source Softw. 5, 2373 (2020).
- Berendsen, Grigera, and Straatsma (1987) H. J. C. Berendsen, J. R. Grigera, and T. P. Straatsma, “The Missing Term in Effective Pair Potentials,” J. Phys. Chem. 91, 6269–6271 (1987).
- Dang (1995) L. X. Dang, J. Am. Chem. Soc. 117, 6954 (1995).
- Berg, Peter, and Johnston (2017) A. Berg, C. Peter, and K. Johnston, J. Chem. Theory Comput. 13, 5610 (2017).
- Martyna, Klein, and Tuckerman (1992) G. J. Martyna, M. L. Klein, and M. E. Tuckerman, “Nosé-hoover chains: the canonical ensemble via continuous dynamics,” J. Chem. Phys. 97, 2635–2643 (1992).
- Scalfi et al. (2020b) L. Scalfi, D. T. Limmer, A. Coretti, S. Bonella, P. A. Madden, M. Salanne, and B. Rotenberg, “Charge fluctuations from molecular simulations in the constant-potential ensemble,” Phys. Chem. Chem. Phys. 22, 10480–10489 (2020b).
- Clabaut et al. (2020) P. Clabaut, P. Fleurat-Lessard, C. Michel, and S. N. Steinmann, “Ten Facets, One Force Field: The GAL19 Force Field for Water-Noble Metal Interfaces,” J. Chem. Theory Comput. 16, 4565–4578 (2020).
- White et al. (2000) J. A. White, E. Schwegler, G. Galli, and F. Gygi, “The solvation of na+ in water: First-principles simulations,” J. Chem. Phys. 113, 4668–4673 (2000).
- Zwanzig and Ailawadi (1969) R. Zwanzig and N. K. Ailawadi, “Statistical error due to finite time averaging in computer experiments,” Phys. Rev. 182, 280–283 (1969).
- Geada et al. (2018) I. L. Geada, H. Ramezani-Dakhel, T. Jamil, M. Sulpizi, and H. Heinz, “Insight into induced charges at metal surfaces and biointerfaces using a polarizable lennard–jones potential,” Nat. Commun. 9, 716 (2018).