ADVERT: An Adaptive and Data-Driven Attention Enhancement Mechanism for Phishing Prevention
Abstract
Attacks exploiting the innate and the acquired vulnerabilities of human users have posed severe threats to cybersecurity. This work proposes ADVERT, a human-technical solution that generates adaptive visual aids in real-time to prevent users from inadvertence and reduce their susceptibility to phishing attacks. Based on the eye-tracking data, we extract visual states and attention states as system-level sufficient statistics to characterize the user’s visual behaviors and attention status. By adopting a data-driven approach and two learning feedback of different time scales, this work lays out a theoretical foundation to analyze, evaluate, and particularly modify humans’ attention processes while they vet and recognize phishing emails. We corroborate the effectiveness, efficiency, and robustness of ADVERT through a case study based on the data set collected from human subject experiments conducted at New York University. The results show that the visual aids can statistically increase the attention level and improve the accuracy of phishing recognition from to a minimum of . The meta-adaptation can further improve the accuracy to (resp. ) in less than (resp. ) tuning stages.
Index Terms:
Attention management, phishing mitigation, reinforcement learning, Bayesian optimization, eye tracking, human vulnerability, cybersecurity.I Introduction
Human is often considered the weakest link in cybersecurity. Adversaries can exploit human errors and vulnerabilities to launch deceptive attacks (e.g., social engineering and phishing) that lead to information leakages and data breaches. Moreover, these attacks often serve as the initial stages of sophisticated attacks (e.g., supply chain attacks and advanced persistent threats) that inflict tremendous damage on critical infrastructures. We classify human vulnerabilities into innate vulnerabilities (e.g., bounded attention and rationality) and acquired vulnerabilities (e.g., lack of security awareness and incentives). Previous works have mitigated the acquired vulnerabilities through security training[1], rule enforcement [2], and incentive designs [3, 4], but these methods are less than sufficient to deal with the innate ones, especially due to the unpredictability and heterogeneity of human behaviors. To this end, there is a need for security-assistive technologies to deter and adaptively correct the user misbehavior resulting from the innate vulnerabilities.
In this work, we focus on inattention, one type of innate human vulnerability, and use phishing email as a prototypical scenario to explore the users’ visual behaviors when they determine whether a sequence of emails is secure or not. Based on the users’ eye-tracking data and phishing recognition results, we develop ADVERT111ADVERT is an acronym for ADaptive Visual aids for Efficient Real-time security-assistive Technology. to provide a human-centric data-driven attention enhancement mechanism for phishing prevention. In particular, ADVERT enables an adaptive visual-aid generation to guide and sustain the users’ attention to the right content of an email and consequently makes users less likely to fall victim to phishing. The design of the ADVERT contains two feedback loops of attention enhancement and phishing prevention at short and long time scales, respectively, as shown in Fig. 1.
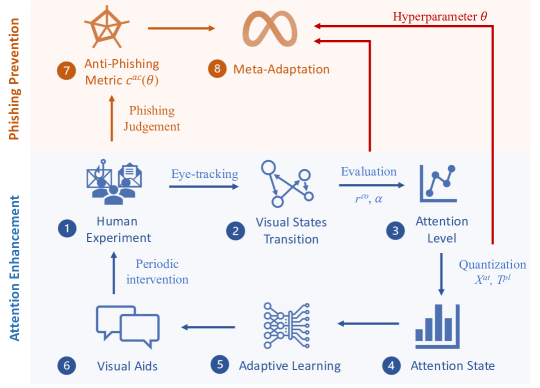
The bottom part of Fig. 1 in blue illustrates the design of adaptive visual aids (e.g., highlighting, warnings, and educational messages) to engage human users in email vetting. First, as a human user reads emails and judges whether they are phishing or legitimate, a covert eye-tracking system can record the user’s eye-gaze locations and pupil sizes in real-time. Second, based on the eye-tracking data, we abstract the email’s Areas of Interest (AoIs), e.g., title, hyperlinks, attachments, etc., and develop a Visual State (VS) transition model to characterize the eye-gaze dynamics. Third, we develop system-level attention metrics to evaluate the user’s attention level based on the VS transition trajectory. Then, we quantize the attention level to obtain the Attention State (AS) and develop adaptive learning algorithms to generate visual aids as feedback of the AS. The visual aids change the user’s hidden cognitive states and lead to the set of eye-tracking data with different patterns of VS transition and AS, which then updates the design of visual aids and enhances attention iteratively.
The attention enhancement loop serves as a stepping-stone to achieving the ultimate goal of phishing prevention. The orange background in the top part of Fig. 1 illustrates how we tune the hyperparameters in the attention enhancement loop to safeguard users from phishing emails. First, we create a metric to evaluate the user’s accuracy in phishing recognition under the current attention enhancement mechanism. Then, we iteratively revise the hyperparameters to achieve the highest accuracy. Since the accuracy evaluation depends on the implementation of the entire attention enhancement loop, the evaluation is costly and time-consuming. Thus, we leverage Bayesian Optimization (BO) to propose an efficient meta-level tuning algorithm that improves the accuracy.
The contributions of this work are threefold. First, we provide a holistic model of the human-in-the-loop system for email vetting and phishing recognition. By abstracting the complex human processes of sensing, thinking, and acting as a stochastic feedback control system of various parameters, we establish a system-level characterization of human attention and security judgment. Such characterization focuses on the interaction between the human and the technical systems, especially the inputs (e.g., visual aids) and the outputs (e.g., gaze locations, attention status, and security decisions) of the human system. Moreover, we propose new attention metrics to quantify the impact of hidden attention status on observable performance metrics, e.g., accuracy of recognizing phishing. These metrics enable a real-time modification of the human attention process through the adaptive visual-aid generation.
Second, we provide an adaptive technology called ADVERT to counteract inattention and improve the human recognition of phishing attacks. Two algorithms are developed to illustrate the design, where the individual adaptation algorithm improves the visual aid design for each individual user, and the population adaptation algorithm further learns the optimal visual aid for the user population. Since the data-driven approach achieves customized solutions in terms of the users and the content of the emails, ADVERT can be applied to various security threat scenarios caused by inattention. Since the feedback learning framework enables an adaptive and systematic design of the optimal visual aids, ADVERT can be applied with insufficient domain knowledge.
Finally, we corroborate the effectiveness, efficiency, and robustness of ADVERT through a case study based on the data set collected from human subject experiments conducted at New York University [5]. The results show that the visual aids can sufficiently enhance the attention level and improve the accuracy of phishing recognition from to a minimum of . When we further tune the hyperparameters, we manage to improve the accuracy of phishing recognition from to in less than tuning stages, while the largest accuracy improvement happens within tuning stages. The results have also provided insights and guidance for the ADVERT design; e.g., the attention threshold for visual-aid selection (resp. the period length for visual-aid generation) has a small (resp. periodic) impact on phishing recognition.
I-A Notations and Organization of the Paper
Throughout the paper, we use subscripts to index time and stages. Calligraphic letter defines a set and represents its cardinality. The indicator function takes value if condition is true and value if is false. The rest of the paper is organized as follows. The related works are presented in Section II. We elaborate on the two feedback loops of Fig. 1 in Section III and IV, respectively. Section V presents a case study of ADVERT for email vetting and phishing recognition. Section VI discusses the limitations, and Section VII concludes the paper.
II Related works
II-A Phishing Attack Detection and Prevention
Phishing is the act of masquerading as a legitimate entity to serve malware or steal credentials. The authors in [6] have identified three human vulnerabilities that make humans the unwitting victims of phishing.
-
•
Lack of knowledge for computer system security; e.g., www.ebay-members-security.com does not belong to www.ebay.com.
-
•
Inadequacy to identify visual deception; e.g., the phishing email can contain an image of a legitimate hyperlink, but the image itself serves as a hyperlink to a malicious site. A human cannot identify the deception by merely looking at it.
-
•
Lack of attention (e.g., careless users fail to notice the phishing indicators, including spelling errors and grammar mistakes) and inattentional blindness (e.g., users focusing on the main content fail to perceive unloaded logos in a phishing email [7]).
Many works have attempted to mitigate the above three human vulnerabilities to prevent phishing attacks. First, security education and anti-phishing training, e.g., role-playing phishing simulation games [8] and fake phishing attacks [9], have been used to compensate for the user’s lack of security knowledge and increase users’ security awareness. Second, detection techniques based on visual similarities [10] and machine learning [11] have been applied to help users identify visual deception. Modern web browsers and email clients also provide security indicators (e.g., the protocol used, the domain name, and the SSL/TLS certificate) to assist users in decision-making [12]. Third, passive warnings (i.e., do not block the content-area) and active warnings (i.e., prohibits the user from viewing the content-data) have been developed empirically to draw users’ attention and prevent them from falling victim to phishing [13, 11]. Our work lays out a foundation to compensate for the third human vulnerability of inattention systematically and quantitatively.
II-B Counterdeception Technologies
Adversarial cyber deception has been a long-standing problem. It is easy for an attacker to deceive yet much more difficult for regular users to identify the deception given the universal human vulnerabilities. Previous works have mainly focused on human solutions (e.g., security training [1]) or technical solutions (e.g., defensive deception technologies [14, 15, 16]), to deter, detect, and respond to deceptive attacks. This work focuses on designing a human-technical solution through eye-tracking data, visual aids, and learning techniques to counteract adversarial cyber deception.
Biosensors, including eye trackers and electroencephalogram (EEG) devices, provide a window into an analytical understanding of human perception and cognition to enhance security and privacy [17]. In particular, researches have investigated the users’ gaze behaviors and attention when reading Uniform Resource Locators (URLs) [18], phishing webs [19], and phishing emails [5, 20, 21]. These works illustrate the users’ visual processing of phishing contents [18, 19, 22, 20] and the effects of visual aids [21]. The authors in [19] further establish correlations between eye movements and phishing identification to estimate the likelihood that users may fall victim to phishing attacks. Compared to these works that analyze human perception, we use eye-tracking data to design visual aids and modify the human perception process for better security decisions. Moreover, we use biometric data at different granularities. Compared to previous works that exploit the statistics of the biometric data (e.g., the number of fixations and gaze duration distributions), we use the dynamic transitions of the eye-tracking data to extract attention metrics for corrective measures in real-time.
II-C Human Vulnerability Quantification and Learning
Human plays significant roles in cybersecurity. It is challenging to model, quantify, and affect human behaviors and their mental processes such as reasoning, perception, and cognition. Therefore, various modeling and learning approaches are developed to mitigate human vulnerabilities in cyberspace, as shown in the following two paragraphs, respectively.
The authors in [23, 24] use Signaling Detection Theory (SDT) to quantify phishing susceptibility and prioritize behavioral interventions for reducing phishing risk, respectively. Adopting SDT, they treat the phishing risk management as a vigilance task, where individuals monitor their environment to distinguish signals (i.e., phishing emails) from noises (i.e., legitimate emails). Their approaches investigate phishing on a detailed level based on varying factors, including task, individual, and environmental ones. We adopt a system-level characterization, where system-scientific tools such as feedback, Reinforcement Learning (RL), and BO are used to adapt to these varying factors.
Due to the modeling challenges and the unpredictability, RL [25] has been used to characterize and mitigate human vulnerabilities, including bounded rationality [26], prospect theory [27], incompliance [3], and bounded attention [28, 29]. Using RL to detect, evaluate, and compensate for risks induced by human vulnerabilities is still in its infancy, but it is a promising direction as RL provides a quantitative and adaptive solution.
III Attention Enhancement Mechanism
As illustrated by Step of Fig. 1, we consider a group of human users who vet a list of emails and classify them as phishing or legitimate. As a user reads an email on the screen for a duration of , the eye-tracking device records the vertical and the horizontal coordinates of his eye gaze point in real-time. To compress the sensory outcomes and facilitate RL-driven attention enhancement solutions, we aggregate potential gaze locations (i.e., pixels on the screen) into a finite number of non-overlapping Areas of Interest (AoIs) as shown in Fig. 2.
We index each potential AoI by .
Each email does not need to contain all the AoIs, and the AoI partition remains unknown to the users. Previous works [20, 18, 19] have identified the role of AoIs in helping human users recognize phishing, and different research goals can lead to different AoI partitions. For example, the main content AoI (i.e., area in Fig. 2) can be divided into finer AoIs based on the phishing indicators such as misspellings, grammar mistakes, and threatening sentences. We refer to all other areas in the email (e.g., blank areas) as the uninformative area. When the user’s eyes move off the screen during the email vetting process, no coordinates of the gaze location are available. We refer to these off-screen areas as the distraction area.
III-A Visual State Transition Model
As illustrated by Step in Fig. 1, we establish the following transition model based on the AoI to which the user’s gaze location belongs at different times. We define as the set of Visual States (VSs), where represents the -th AoI; represents the uninformative area; and represents the distraction area. We provide an example transition map of these VSs in Fig. 3.
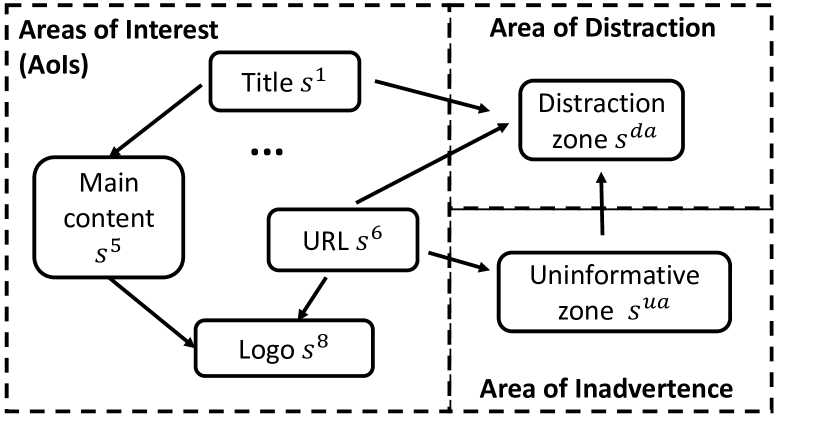
The links represent the potential shifts of the gaze locations during the email reading process; e.g., a user can shift his focus from the title to the main content or the distraction area. We omit most links for illustration purposes; e.g., it is also possible for a user to regain attention to the AoIs from distraction or inadvertence.
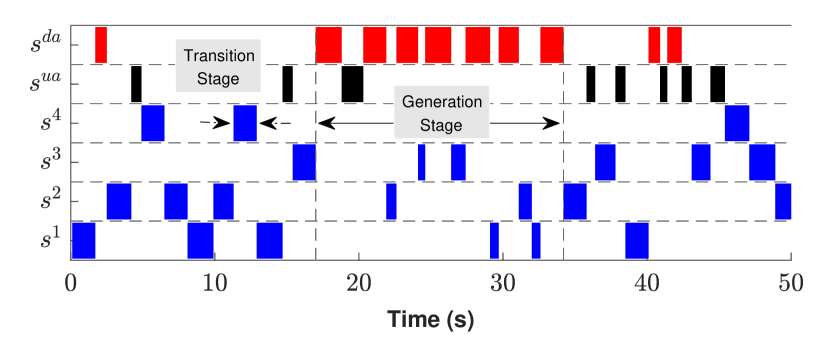
We denote as the VS of user vetting email at time . In this work, we do not distinguish among human users concerning their attention processes while they read different emails. Then, each user’s gaze path during the interval can be characterized as the same stochastic process . The stochastic transition of the VSs divides the entire time interval into different transition stages. We visualize an exemplary VS transition trajectory in Fig. 4 under AoIs and seconds. As denoted by the colored squares, VSs arrive in sequence, which results in discrete transition stages.
III-B Feedback Visual-Aid Design
Propel visual aids can help guide and sustain the users’ attention. Previous works have proposed different classes of visual aids to enhance phishing recognition, including highlights of contents [21, 30], warnings of suspicious hyperlinks and attachments [13, 31], and anti-phishing educational messages [32]. These potential classes of visual aids construct the visual-aid library denoted as a finite set .
As illustrated by Step in Fig. 1, different visual aids can affect the users’ visual behaviors. The influence, however, can be beneficial (e.g., timely highlights prevent users from mind-wandering) or detrimental (e.g., extensive highlights make humans weary and less attentive to the AoIs). The effectiveness of visual aids for preventing phishing may not be straightforward, especially under different environmental (e.g., security indicator designs) and human factors (e.g., users’ security knowledge and prior trust) [12]. In this paper, we focus on adapting visual aids to the human visual attention. We apply RL to learn the dynamic design of visual aids based on the real-time evaluation of the user’s attention status detailed in Section III-C.
The sequence of adaptive visual aids is generated with a period of length , and we refer to the time interval between every two visual aids as the generation stage indexed by , where is the maximum generation stage during ; i.e., and . Then, we denote as the visual aid at the -th generation stage. Fig. 4 illustrates how visual aids affect the transition of VSs in generation stages divided by the two vertical dashed lines. During the second generation stage, an improper visual aid leads to more frequent transitions to the distraction area and also a longer sojourn time at the VS . On the contrary, the proper visual aids during the first and the third generation stages engage the users and extend their attention spans, i.e., the amount of time spent on AoIs before a transition to or .
III-C Evaluation of Attention Status
From the VS transition trajectory (e.g., Fig. 4), we aim to construct the Attention State (AS) used as the feedback value for the adaptive visual-aid design. We define as the set of all possible attention states. Previous works (e.g., [22, 20]) have defined attention metrics based on the AoIs, including the proportion of time spent on each AOI, gaze duration means, fixation count, and average duration. Compared to these detailed-level metrics extracted directly from raw eye-gaze data, we propose the following system-level metric of attention level based on the VS transition history as will be shown in Section III-C2. Such system-level metric serves as sufficient statistics to effectively characterize the attention status. Moreover, it preserves the users’ privacy because the raw data of gaze locations can reveal sensitive information about their biometric identities, including gender, age, and ethnicity [33, 34].
To this end, we assign scores to each VS in Section III-C1 to evaluate the user’s attention (e.g., gaze at AoIs) and inattention (e.g., gaze at uninformative and distraction areas). The scores can be determined manually based on the expert recommendation and empirical studies (e.g., [22]), or based on other biometric data (e.g., the pupil sizes in Fig. 8). Moreover, we can apply BO for further fine-tuning of these scores as shown in Section IV-B.
III-C1 Concentration Scores and Decay Rates
Both the gaze location and the gaze duration matter in the identification of phishing attacks. For example, at the first glance, users cannot distinguish the spoofed email address ‘paypa1@mail.paypaI.com’ from the authentic one ‘paypal@mail.paypal.com’ while a guided close look reveals that the lower case letter ‘l’ is replaced by the number ‘1’ and the capital letter ‘I’. Therefore, we assign a concentration score to characterize the sustained attention associated with VS . Since the amount of information that a user can extract from a VS is limited, we use an exponential decay rate of to penalize the effect of concentration score as time elapses. Different VSs can have different concentration scores and decay rates. For example, the main content AoI (i.e., area in Fig. 2) usually contains more information than other AoIs, and an extended attention span extracts more information (e.g., the substitution of letter ‘l’ into ‘I’) to identify the phishing email. Thus, the main content AoI turns to have a high concentration score and a low decay rate, which is corroborated in Table I based on the data set collected from human experiments [5] as will be shown in Section V.
III-C2 Cumulative Attention Level
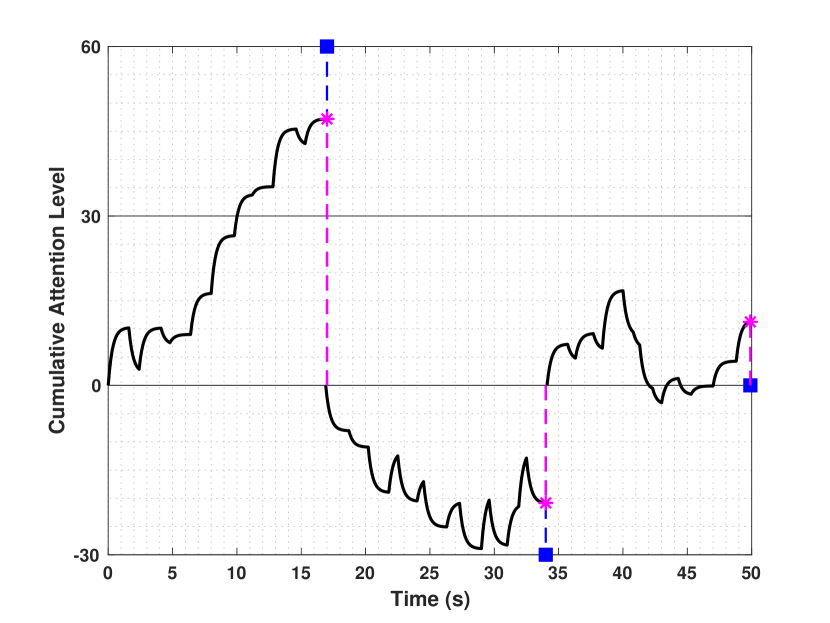
We construct the metric for attention level illustrated by Step in Fig. 1 as follows. Let be the total number of transition stages contained in generation stage . Then, we define , as the duration of the -th transition stage in the -th generation stage. Take the gaze path in Fig. 4 as an example, the first generation stage contains transition stages and the first transition stages last for a total of seconds. Based on the sets of scores associated with , we compute the cumulative reward at time of the -th transition stage in the -th generation stage as At generation stage , we define as the latest transition stage before time , i.e., and . Then, we define the user’s Cumulative Attention Level (CAL) over time interval at generation stage as the following cumulative reward
| (1) |
We visualize the CAL of generation stages in Fig. 5 based on the gaze path in Fig. 4.
Since is bounded for all , we can quantize it into finite values to construct the set of the attention states illustrated by Step in Fig. 1. We represent the quantized value of as for all , and define the Average Attention Level (AAL) and Quantized Average Attention Level (QAAL) for each generation stage in Definition 1.
Definition 1.
Let and denote the user’s Average Attention Level (AAL) and Quantized Average Attention Level (QAAL) over generation stage , respectively. They are measured by the improvement in CAL and the quantized value of the CAL improvement per unit time, i.e., and , respectively.
III-D Q-Learning via Consolidated Data
In Section III-D, We elaborate on the adaptive learning block (i.e., Step in Fig. 1). Since the inspection time of a user reading one email is not sufficiently long, we consolidate a group of email inspection data to learn the optimal visual-aid generation policy over a population.
The QAAL represents the attention state at the generation stage . Since the goal is to enhance the user’s attention represented by the CAL, the reward function should be monotone concerning the value of , e.g., . In this work, we assume that each visual aid exerts the same statistical effect on the attention process regardless of different users and emails. Thus, we can consolidate the data set of users and emails222When sufficiently large data sets are available, we can carefully choose these users to share similar attributes (e.g., ages, sexes, races, etc.) and these emails to belongs to the same categories (e.g., business or personal emails). to learn the optimal visual-aid generation policy in a total of stages. With a given discounted factor , the expected long-term objective can be represented as .
The -table represents the user’s attention pattern at generation stage , i.e., the estimated payoff of applying visual aid when the attention state is . Let the sequence of learning rate satisfy and for all . Then, we can update the attention pattern at each generation stage as follows, i.e.,
| (2) |
where the visual-aid generation policy at generation stage is an -greedy policy; i.e., with probability , the visual aid is selected randomly from and with probability , the optimal visual aid is implemented. To obtain a convergent visual-aid generation policy, the value of gradually decreases from to .
IV Phishing Prevention Mechanism
The attention enhancement mechanism in Section III tracks the attention process in real-time to enable the adaptive visual-aid generation. By properly modifying the user’s attention and engaging him in vetting emails, the attention enhancement mechanism serves as a stepping-stone to achieving the ultimate goal of phishing prevention. Empirical evidence and observations have shown that a high attention level, or mental arousal, does not necessarily yield good performance [35]. In the specific task of phishing recognition, recent works [36, 37] have also identified curvilinear relationships between phishing recognition accuracy and critical attentional factors, including a participant’s cue utilization, cognitive reflection, and cognitive load. Thus, besides attention metrics, e.g., the AAL, we need to design anti-phishing metrics to measure the users’ performance of phishing recognition as will be shown in Section IV-A.
In Section IV-B, we develop an efficient meta-level algorithm to tune the hyperparameters (e.g., the period length of the visual-aid generation, the number of attention states , the attention scores , etc.) in the attention enhancement mechanism. We denote these hyperparameters as one -dimensional variable , where . Let the -th element be upper and lower bounded by and , respectively. Thus, .
IV-A Metrics for Phishing Recognition
As illustrated by Step in Fig. 1, we provide a metric to evaluate the outcome of the users’ phishing identification under a given hyperparameter . After vetting email , the user judges the email to be phishing or legitimate. The binary variable represents whether the judgment is correct (denoted by ) or not (denoted by ). We can reshape the two-dimension index as a one-dimension index and rewrite as . Once these users have judged in total of emails, we define the following metric to evaluate the accuracy of phishing recognition, i.e.,
| (3) |
The goal is to find the optimal hyperparameter to maximize the accuracy of phishing identification, i.e., . However, we cannot know the value of for a a priori until we implement this hyperparameter in the attention enhancement mechanism. The implemented hyperparameter affects the adaptive visual-aid generation that changes the user’s attention and the anti-phishing performance metric . Since the experimental evaluation at a given is time-consuming, we present an algorithm in Section IV-B to determine how to choose and update the hyperparameter to maximize the detection accuracy.
IV-B Efficient Hyperparameter Tuning
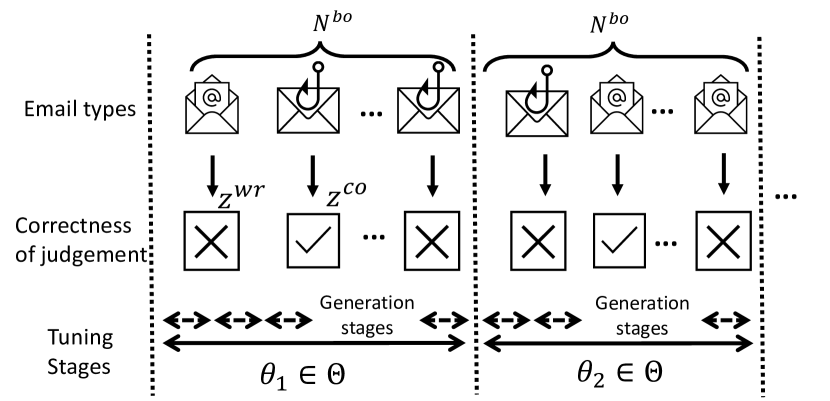
We illustrate the meta-adaptation (i.e., Step in Fig. 1) in Section IV-B. As illustrated in Fig. 6, we refer to the duration of every security decisions as a tuning stage. Consider a time and budget limit that restricts us to conduct tuning stages in total. We denote as the hyperparameter at the -th tuning stage where . Since each user’s email inspection time is different, each tuning stage can contain different numbers of generation stages.
To find the optimal hyperparameter within tuning stages is challenging. The empirical methods (e.g., a naive grid search or a random search over ) become inefficient when . BO [38] provides a systematic way to update the hyperparameter and balance between exploration and exploitation. BO consists of a Bayesian statistical model of the objective function and an acquisition function for deciding the hyperparameter to implement at the next tuning stage. The statistical model of is a Gaussian process with a mean function and covariance function or kernel for all , where , and , are parameters of the kernel. The kernel is required to be positive semi-definite and has the property that the points closer in the input space are more strongly correlated. For any , we define three shorthand notations , , and
Then, the evaluation vector of elements is assumed to be multivariate Gaussian distributed, i.e., . Conditioned on the values of , we can infer the value of at any other by Bayesian rule, i.e.,
| (4) |
where and .
We adopt expected improvement as the acquisition function. Define as the optimal evaluation among the first evaluations and a shorthand notation . For any , we define as the expectation taken under the posterior distribution of conditioned on the values of evaluations . Then, the expected improvement is . The hyperparameter at the next tuning stage is chosen to maximize the expected improvement at the current stage, i.e,
| (5) |
The expected improvement can be evaluated in a closed form, and (5) can be computed inexpensively by gradient methods [38].
At the first tuning stages, we choose the hyperparameter , uniformly from . We can use the evaluation results , to determine the parameters , and , by Maximum Likelihood Estimation (MLE); i.e., we determine the values of these parameters so that they maximize the likelihood of observing the vector . For the remaining tuning stages, we choose , in sequence as summarized in Algorithm 1.
V Case Study
In this case study, we verify the effectiveness of ADVERT via a data set collected from human subject experiments conducted at New York University [5]. We elaborate on the experiment setup and the data processing procedure in Section V-A. Based on the features obtained from the data set, we generate synthetic data under adaptive visual aids to demonstrate the proposed attention enhancement mechanism and the phishing prevention mechanism in Section V-B and V-C, respectively.
V-A Experiment Setting and Data Processing
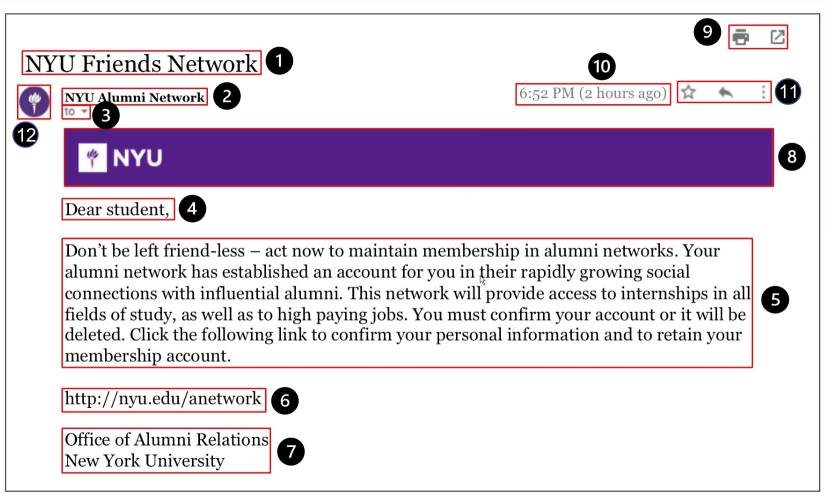
The data set involves undergraduate students (, , , , ) who are asked to vet different emails (e.g., the email of NYU friends network in Fig. 2) separately and then give a rating of how likely they would take actions solicited in the emails (e.g., maintain membership in Fig. 2). When presented to different participants, each email is described as either posing a cyber threat or risk-free legitimate opportunities to investigate how the above description affects the participants’ phishing recognition.
While the participants vet the emails, the Tobii Pro T60XL eye-tracking monitor records their eye locations on a resolution screen and the current pupil diameters of both eyes with a sampling rate of . Fig. 7 illustrates the time-expanded eye-gaze trajectory of a participant vetting the sample email in Fig. 2. The -coordinate of a 3D point represents the time when the participant gazes at the pixel in the email area. The participant’s eye gaze locations move progressively from the points in warmer color to the ones in cooler color. Fig. 7 illustrates the zigzag pattern of the participant’s eye-gaze trajectory; i.e., the participant reads emails from left to right and top to bottom. The participant starts with the title, spends the majority of time on the main content, and glances at other AoIs (e.g., the links and the signatures). There is also a small chance of revisiting the email content and looking outside the email area.
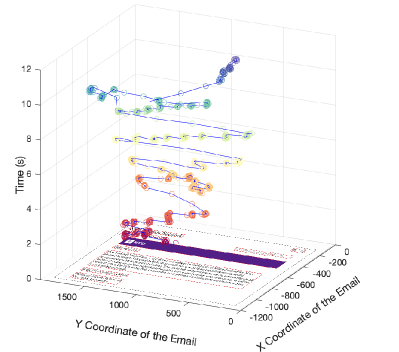
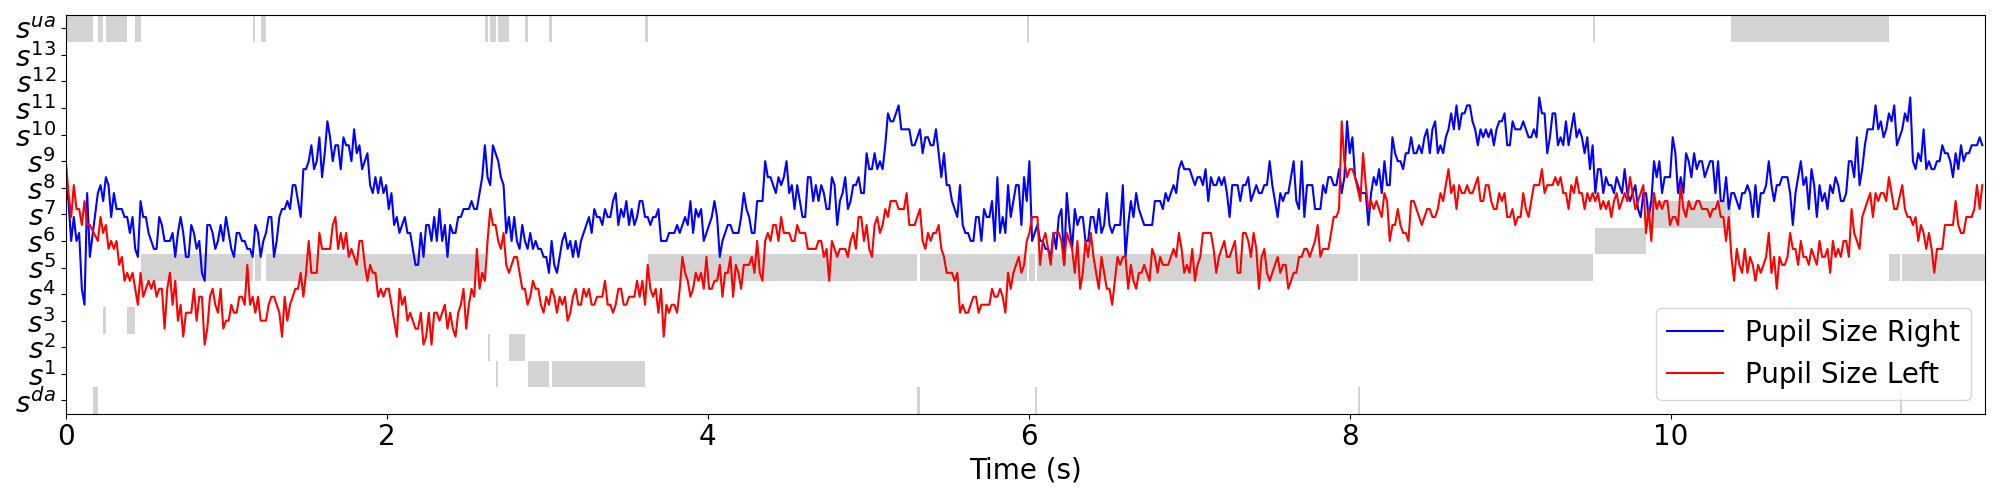
Fig. 8 illustrates the participant’s pupil sizes of left and right eyes in red and blue, respectively, concerning the same trial of the data set to generate Fig. 7. At different times, the average of the pupil diameters (resp. gaze locations) of the right and left eyes represent the pupil size (resp. gaze location). Following Section III-A, we obtain the VSs illustrated by the grey squares in Fig. 8 based on the gaze locations of the email pixels in Fig. 7. Since the covert eye-tracking system does not require head-mounted equipment or chinrests, the tracking can occur without the participants’ awareness. We refer the reader to the supplement materials of [5] for the survey data and the details of the experimental procedure333The processed data used in this manuscript, including the temporal transitions of AoIs and the pupil sizes, is available at https://osf.io/4y32d/. The raw eye-tracking data in the format of videos are available upon request..
V-A1 Estimate Concentration Scores and Decay Rates based on Pupil Sizes
Empirical works in [39, 40] have demonstrated that pupils dilate as a consequence of attentional efforts. Building on the findings, we assume that the average pupil diameters of both eyes at time of the generation stage is approximately proportional to the participant’s attention level at time . We obtain the benchmark values of , in Table I by minimizing the Mean Square Error (MSE) between the CAL in Section III-C and the cumulative pupil size through global optimization methods such as Simulated Annealing (SA) [41]. The results in Table I corroborate that the main content AoI has the highest concentration score and the lowest decay rate.
| AoIs | Meaning | ||
|---|---|---|---|
| Title | 9.48 | 2.17 | |
| Sender | 3.55 | 4.04 | |
| Receiver | 7.62 | 0.22 | |
| Salutation | 13.76 | 0.57 | |
| Main Content | 21.05 | 0.16 | |
| URL | 7.84 | 10.90 | |
| Signature | 6.47 | 5.46 | |
| Logo | 6.44 | 5.16 | |
| Print& Share | 4.86 | 13.91 | |
| Time | 3.81 | 6.68 | |
| Bookmark& Forward | 7.34 | 2.19 | |
| Profile | 7.26 | 2.02 | |
| Attachment | 4.74 | 3.46 |
V-A2 Synthetic VS Trajectory Generation under Visual Aids
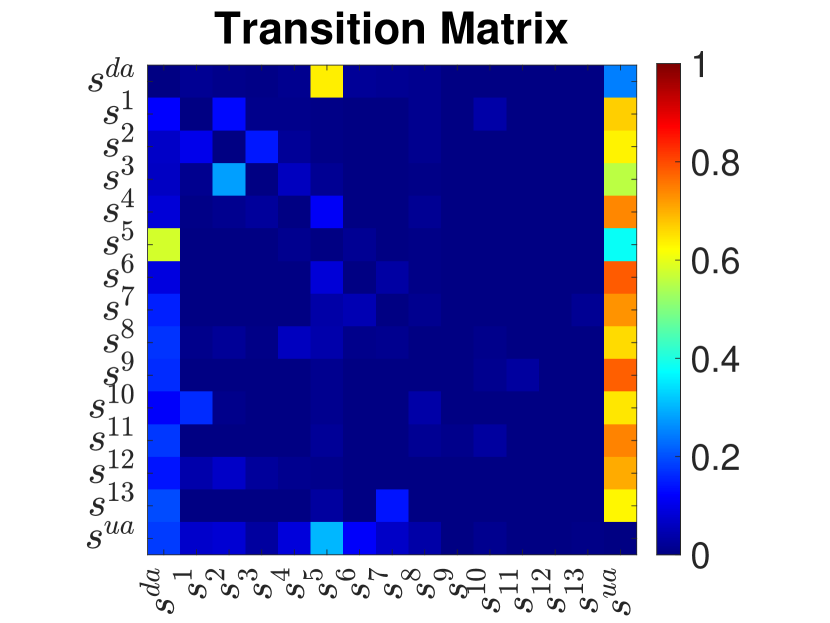
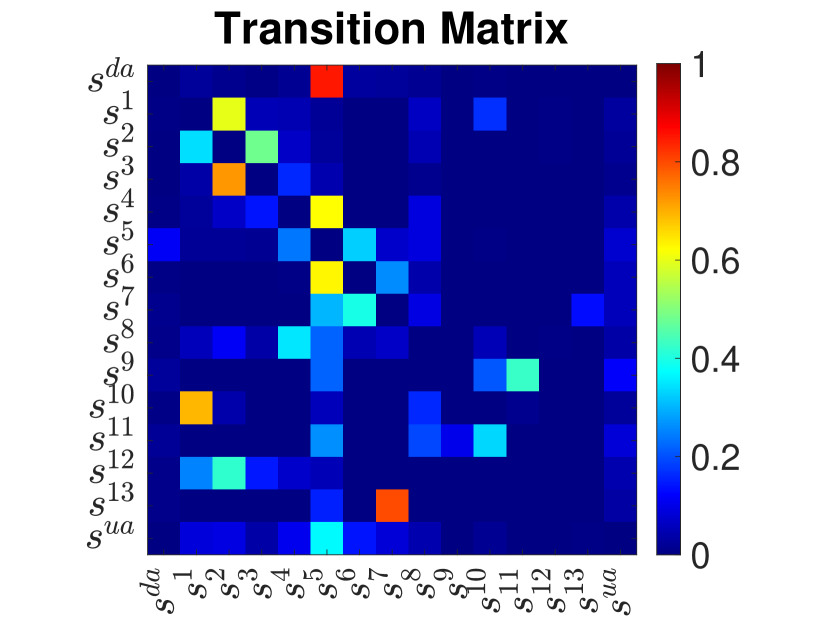
In the case study, we consider AoIs. The sample email in Fig. 2 illustrates the first AoIs. The -th AoI is on the email attachment. Under visual aid , we denote as the probability of attention arriving at VS from VS and as the average sojourn time at VS . We specify the participants’ VS transition trajectory , as a semi-Markov transition process with probability transition matrix and exponential sojourn distribution of the scale parameter .
In particular, we consider a binary set of visual aid , where represents the benchmark case without visual aids and represents the visual aid of highlighting the entire email contents. Based on the VS transition trajectory from the data set, we obtain the probability transition matrix and the sojourn distribution parameter under the benchmark case . The transition matrix and sojourn distribution under visual aid modify and based on the following observations. On the one hand, the visual aid decreases ; i.e., the participants will be guided by the visual aid to pay more frequent attention to the AoIs than the uninformative and distraction areas. On the other hand, the visual aid decreases ; i.e., the persistent highlighting makes participants weary and reduces their attention spans on the email’s main content.
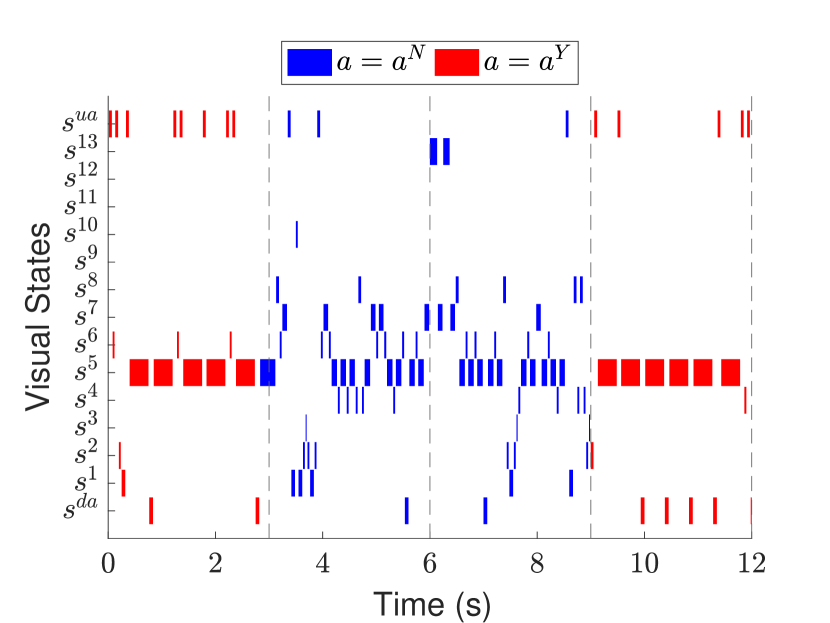
We illustrate and using heat maps in Fig. 9(a) and Fig. 9(b), respectively. In Fig. 10, we illustrate an exemplary transition trajectory of VSs under and in blue and red, respectively. The trajectory corroborates that participants under visual aid incline to pay attention to AoIs yet have less sustained attention. Accurately quantifying the impact of the visual aid on the VS transition depends on many factors [42], including the graphic design, the human subject, and the cognitive task. In Section V-A2, we provide one potential estimation of the impact based on the human experiments to illustrate the implementation procedure and the effectiveness of the ADVERT framework.
V-B Validation of Attention Enhancement Mechanism
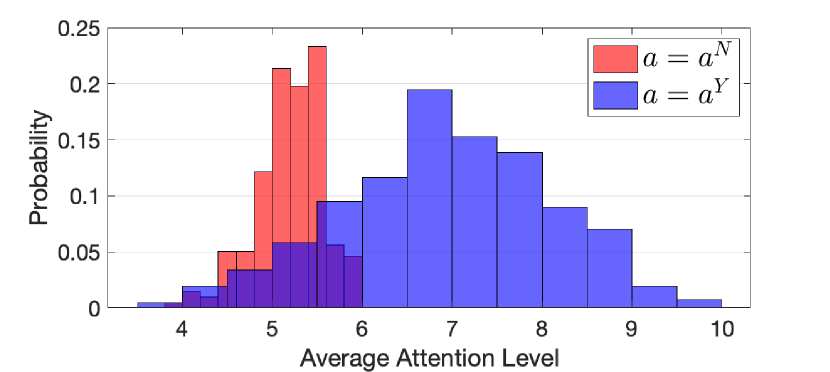
Based on the benchmark attention score in Section V-A1, Fig. 11 illustrates the CAL of the VS transition trajectory shown in Fig. 10. We consider attention states with the attentive state and the inattentive state . Define as the attention threshold. If the AAL at generation stage is higher (resp. lower) than the attention threshold, i.e., (resp. ), then the attention state at generation is the attentive state (resp. inattentive state ).
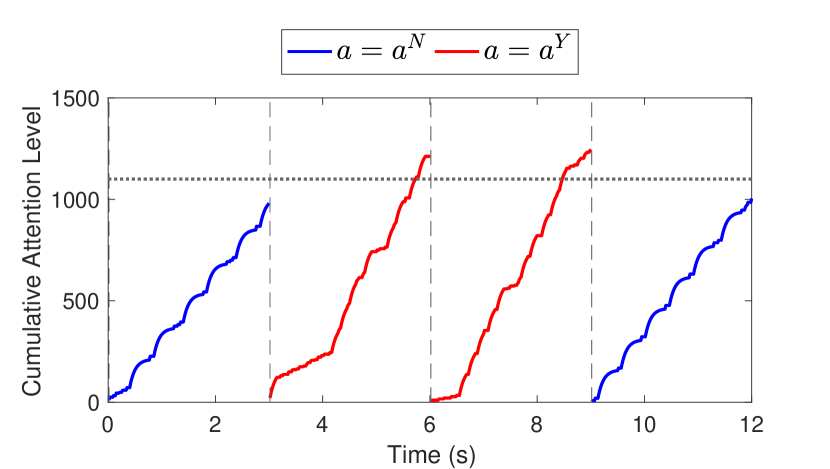
Fig. 12 further illustrates the impact of visual aids and on the AAL in red and blue, respectively. The figure demonstrates that can increase the mean of AAL yet increase its variance.
In Algorithm 2, we present the Q-learning process for participant who reads email for seconds. Define as the total number of visits to attention state and visual aid up to generation stage . Then, we choose the learning rate for all to guarantee the asymptotic convergence, where is a constant parameter.
Based on the benchmark data set of participants who inspect emails in Section V-A, the inspection time , follows a Burr distribution; i.e., its cumulative distribution function is described by with the scale parameter , and the shape parameters . The average inspection time of samples is seconds. During seconds of the email vetting process, the eye-tracking device records the participant’s gaze locations, which leads to the VS transition trajectory. In Algorithm 2, we simulate the human email-reading process through the synthetic VS transition trajectory generated by the sufficient statistics and . Every seconds, ADVERT updates the Q-matrix and the visual aid based on (2).
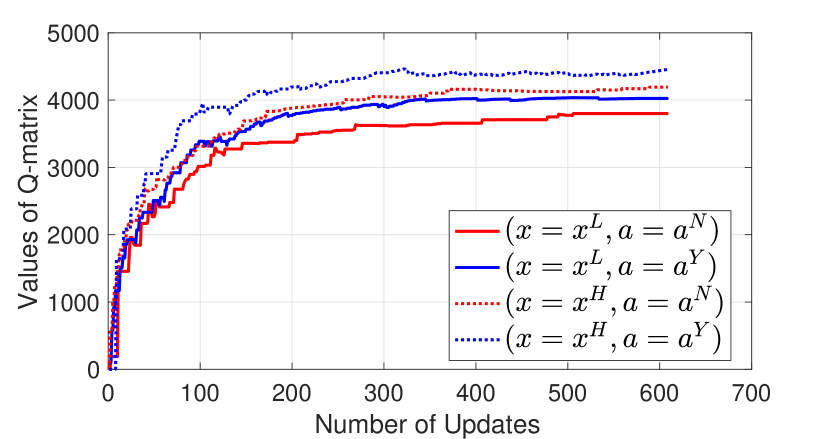
Following Section III-D, we develop Algorithm 3 to illustrate the entire attention enhancement loop that involves the consolidation of the data set from participants and emails. After the participant finishes reading the email , Algorithm 2 returns the Q-matrix and the attention state at the final generation stage . These results then serve as the inputs for the next email inspection until emails have been inspected.
Based on Algorithm 3, we plot the entire Q-learning updates with emails in Fig. 13 that contains a total of generations stages. The learning results show that the visual aid outweighs for both attention states and should be persistently applied under the current setting.
V-C Validation of Phishing Prevention Mechanism
After we obtain a participant’s synthetic response (characterized by his VS transition trajectory) under the adaptive visual aids, we apply a pre-trained neural network to estimate whether the participant has made a correct judgment as shown in line of Algorithm 2. In Section V-C1, we elaborate on the training process of the neural network based on the data set used in Section V-A. We apply BO in Algorithm 1 to evaluate the accuracy metric , as illustrated by Step in Fig. 1. In Section V-C2, we show the results.
V-C1 Neural Network
In this case study, we regard the majority choice of the participants as the email’s true label. Without visual aids, these participants achieve an accuracy of on average. Under the assumption that the hyperparameters affect the participants’ phishing recognition only through their VS transitions, we construct a neural network with an LSTM layer, a dropout layer, and a fully-connected layer to establish the relationship from the sequence of VS transition trajectory to the label of judgment correctness . We split the entire trials of the eye-tracking data set into training data and test data444There are trials in total, and we carefully exclude the remaining trials for two reasons. First, Tobii Pro T60XL records the participants’ eye locations with a validity level ranging from 0 (high confidence) to 4 (eye not found). We exclude a trial if more than of its vetting time has a validity value of . Second, we exclude trials of irresponsible participants who spend the majority (i.e., over ) of time in uninformative areas. . The trained neural network achieves a sensitivity of , a specificity of , an f-score of , and an accuracy of .
V-C2 Bayesian Optimization Results
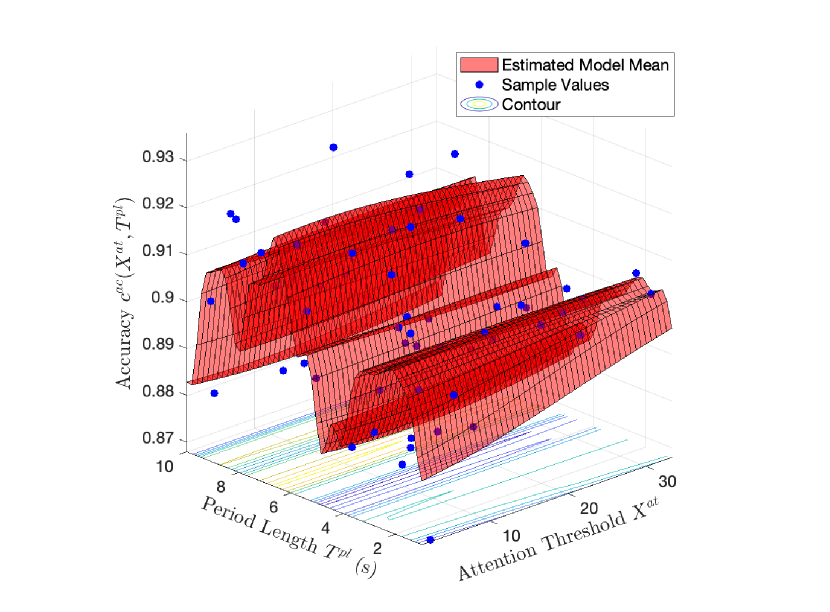
As explained in Section IV, for each different application scenario, a meta optimization of the accuracy metric is required to find the optimal attention threshold and the period length for visual-aid generation. To obtain the value of under different values of the hyperparameter , we need to implement the hyperparameter in Algorithm 3 and repeat for times to reduce the noise. Thus, the evaluation is costly, and BO in Algorithm 1 is a favorable method to achieve the meta optimization. We illustrate the BO for tuning stages in Fig. 14. Each blue point represents the average value of over repeated samples under the hyperparameter . Based on the estimated Gaussian model in red, we observe that the attention threshold has a small impact on phishing recognition while the period length has a periodic impact on phishing recognition. The optimal hyperparameters for phishing prevention are and seconds.
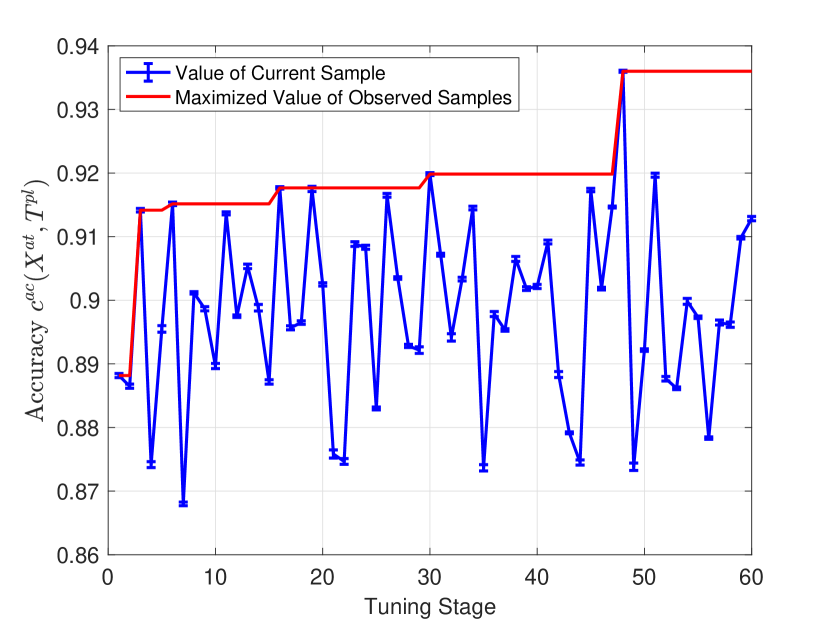
We illustrate the temporal procedure of BO for tuning stages in Fig. 15. As we increase the number of tuning stages to obtain more samples, the maximized value of the accuracy metric monotonously increases as shown in red. The blue line and its error bar represent the mean and variances of the sample values at each tuning stage, respectively. Throughout the tuning stages, the variance remains small, which indicates that ADVERT is robust to the noise of human attention and decision processes.
Compared to the benchmark accuracy of without visual aids, participants with visual aid achieve the accuracy of a minimum of under all tuning stages of different hyperparameters. The above accuracy improvement corroborates that the ADVERT’s attention enhancement mechanism highlighted by the blue background in Fig. 1 effectively serves as a stepping stone to facilitate phishing recognition. The results shown in the blue line further corroborate the efficiency of the ADVERT’s phishing prevention mechanism highlighted by the orange background in Fig. 1; i.e., in less than tuning stages, we manage to improve the accuracy of phishing recognition from to . Besides, the largest accuracy improvement (from to ) happens within the first tuning stages. Thus, if we have to reduce the number of tuning stages due to budget limits, ADVERT can still achieve a sufficient improvement in the accuracy of recognizing phishing.
VI Limitations and Mitigation
The limitations of the data set and the data processing process are as follows. First, the demographic of the experimental subjects is limited to undergraduate students. In the current work, we handle this issue by diversifying the participants (concerning their races, genders, and ages) and adopting the feedback loop of Bayesian optimization (that adapts to unconsidered user groups). To enable a more comprehensive study of the human behaviors that cover different user groups, we can recruit more diversified participants through crowd-sourcing websites, including Amazon Mechanical Turk (MTurk). Second, the dataset contains 12 unique emails. They are certainly not meant to be comprehensive to cover all phishing scenarios. However, they are sufficient for this work, which focuses on the system-level control of human attention processes to improve the accuracy of phishing recognition. For each email, we conduct the vetting processes of humans, which result in the distinct trials of eye-tracking trajectories. These eye-tracking trials are sufficient to reveal human attention patterns. Moreover, as a data-driven and system-level framework, ADVERT can adapt and generalize to unseen sets of emails. Third, we exclude approximately one-third of the eye-tracking data due to their low validity scores that arise from the limitation of the eye-tracking device and the imprudence of the participants, as stated in the footnote of Section V-C1. The reduced sample size may lead to overfitting issues. We can overcome it by improving the eye-tracking device, revising the experiment setting, and recruiting a sufficient number of participants.
VII Conclusions and Future Work
As a prototypical innate human vulnerability, lack of attention is one of the main challenges to protecting users from phishing attacks. To address the challenge, we have developed a human-technical solution called ADVERT to guide the users’ attention to the right contents of the email and consequently improve their accuracy of phishing recognition.
To enable a real-time evaluation of the user’s visual behaviors, we have built AoIs from the entire email area and a transition model to compress the eye-tracking data into a representative VS transition trajectory. After assigning the concentration rewards and decay parameters to evaluate the user’s CAL, we have defined privacy-preserving and light-weight metrics, i.e., AAL and QAAL, to represent the user’s attention state at each time of visual-aid generation. These metrics enable us to apply model-free RL methods and generate the optimal visual aid for real-time attention enhancement. Using the above attention enhancement mechanism as a stepping-stone, we have designed an efficient algorithm to tune the hyperparameters related to the visual aid generation pattern and the attention evaluation parameters. The update of these hyperparameters at each tuning stage revises the visual aids, affects the users’ attention, and consequently improves the accuracy of phishing recognition.
We have corroborated the effectiveness of ADVERT through a case study based on the data set collected from human subject experiments conducted at New York University. By abstracting the transition matrix and sojourn distribution from the data set as sufficient statistics of the stochastic VS transition, we have generated synthetic VS transition to simulate the participant’s visual behaviors under visual aids. Meanwhile, we have trained a neural network to estimate the correctness of the participant’s phishing recognition based on the VS transition trajectory. Finally, we have developed two algorithms to design visual aids that adapt to each individual and the population, respectively. For the attention enhancement mechanism, the results have shown that the visual aids can statistically increase the AAL and improve the accuracy of phishing recognition from to a minimum of . The meta-adaptation has been shown to be effective (e.g., improve the accuracy of phishing recognition from to in less than tuning stages), efficient (e.g., the largest accuracy improvement happens within tuning stages), and robust (e.g., the variances of samples remain small). The results have also provided insights and guidance for the ADVERT design; e.g., the attention threshold (resp. the period length) has a small (resp. periodic) impact on phishing recognition.
The future work would focus on designing a more sophisticated visual support system that can determine when and how to generate visual aids in lieu of a periodic generation. We may also embed ADVERT into VR/AR technologies to mitigate human vulnerabilities under simulated deception scenarios, where the simulated environment can be easily repeated or changed. Finally, there would be an opportunity to incorporate factors such as pressure and incentives into the design by limiting the participant’s vetting time and providing rewards for accurately identifying phishing, respectively.
Acknowledgment
The authors would like to thank Jennie W. Qu-Lee and Blair Cox for their help to export and interpret the eye-tracking data set housed on the experiment platform of the NYU Social Perception Action & Motivation (SPAM) laboratory. We thank Prof. Jonathan Bakdash and the other anonymous reviewer for the helpful comments on earlier drafts of the manuscript.
References
- [1] H. Aldawood and G. Skinner, “Educating and raising awareness on cyber security social engineering: A literature review,” in 2018 IEEE International Conference on Teaching, Assessment, and Learning for Engineering (TALE), pp. 62–68, IEEE, 2018.
- [2] M. Alotaibi, S. Furnell, and N. Clarke, “Information security policies: A review of challenges and influencing factors,” in 2016 11th International Conference for Internet Technology and Secured Transactions (ICITST), pp. 352–358, IEEE, 2016.
- [3] L. Huang and Q. Zhu, “Duplicity games for deception design with an application to insider threat mitigation,” IEEE Transactions on Information Forensics and Security, vol. 16, pp. 4843–4856, 2021.
- [4] L. Huang and Q. Zhu, “Zetar: Modeling and computational design of strategic and adaptive compliance policies,” arXiv preprint arXiv:2204.02294, 2022.
- [5] E. B. Cox, Q. Zhu, and E. Balcetis, “Stuck on a phishing lure: differential use of base rates in self and social judgments of susceptibility to cyber risk,” Comprehensive Results in Social Psychology, vol. 4, no. 1, pp. 25–52, 2020.
- [6] R. Dhamija, J. D. Tygar, and M. Hearst, “Why phishing works,” in Proc. of the SIGCHI conference on Human Factors in computing systems, pp. 581–590, 2006.
- [7] I. Baxter, “Fake login attack evades logo detection,” 2020. https://ironscales.com/blog/fake-login-attack-evades-logo-detection.
- [8] Z. A. Wen, Z. Lin, R. Chen, and E. Andersen, “What. hack: engaging anti-phishing training through a role-playing phishing simulation game,” in Proceedings of the 2019 CHI Conference on Human Factors in Computing Systems, pp. 1–12, 2019.
- [9] R. C. Dodge Jr, C. Carver, and A. J. Ferguson, “Phishing for user security awareness,” computers & security, vol. 26, no. 1, pp. 73–80, 2007.
- [10] A. K. Jain and B. B. Gupta, “Phishing detection: analysis of visual similarity based approaches,” Security and Communication Networks, vol. 2017, 2017.
- [11] M. Khonji, Y. Iraqi, and A. Jones, “Phishing detection: a literature survey,” IEEE Communications Surveys & Tutorials, vol. 15, no. 4, pp. 2091–2121, 2013.
- [12] T. Kelley and B. I. Bertenthal, “Real-world decision making: Logging into secure vs. insecure websites,” Proceedings of the USEC, vol. 16, no. 10.14722, 2016.
- [13] S. Egelman, L. F. Cranor, and J. Hong, “You’ve been warned: an empirical study of the effectiveness of web browser phishing warnings,” in Proceedings of the SIGCHI Conference on Human Factors in Computing Systems, pp. 1065–1074, 2008.
- [14] E. Al-Shaer, J. Wei, W. Kevin, and C. Wang, “Autonomous cyber deception,” Springer, 2019.
- [15] L. Huang and Q. Zhu, “A dynamic games approach to proactive defense strategies against advanced persistent threats in cyber-physical systems,” Computers & Security, vol. 89, p. 101660, 2020.
- [16] J. Pawlick and Q. Zhu, Game Theory for Cyber Deception: From Theory to Applications. Springer Nature, 2021.
- [17] C. Katsini, Y. Abdrabou, G. E. Raptis, M. Khamis, and F. Alt, “The role of eye gaze in security and privacy applications: survey and future hci research directions,” in Proceedings of the 2020 CHI Conference on Human Factors in Computing Systems, pp. 1–21, 2020.
- [18] N. Ramkumar, V. Kothari, C. Mills, R. Koppel, J. Blythe, S. Smith, and A. L. Kun, “Eyes on urls: Relating visual behavior to safety decisions,” in ACM Symposium on Eye Tracking Research and Applications, pp. 1–10, 2020.
- [19] D. Miyamoto, G. Blanc, and Y. Kadobayashi, “Eye can tell: On the correlation between eye movement and phishing identification,” in Int. Conf. on Neural Information Processing, pp. 223–232, Springer, 2015.
- [20] J. McAlaney and P. J. Hills, “Understanding phishing email processing and perceived trustworthiness through eye tracking,” Front. Psychol., vol. 11, p. 1756, 2020.
- [21] A. Xiong, R. W. Proctor, W. Yang, and N. Li, “Is domain highlighting actually helpful in identifying phishing web pages?,” Hum. Factors, vol. 59, no. 4, pp. 640–660, 2017.
- [22] K. Pfeffel, P. Ulsamer, and N. Müller, “Where the user does look when reading phishing mails–an eye-tracking study,” in Int. Conf. on Human-Computer Interaction, pp. 277–287, Springer, 2019.
- [23] C. I. Canfield, B. Fischhoff, and A. Davis, “Quantifying phishing susceptibility for detection and behavior decisions,” Human factors, vol. 58, no. 8, pp. 1158–1172, 2016.
- [24] C. I. Canfield and B. Fischhoff, “Setting priorities in behavioral interventions: An application to reducing phishing risk,” Risk Analysis, vol. 38, no. 4, pp. 826–838, 2018.
- [25] Y. Huang, L. Huang, and Q. Zhu, “Reinforcement learning for feedback-enabled cyber resilience,” Annual Reviews in Control, 2022.
- [26] B. Shi, G. Liu, H. Qiu, Z. Wang, Y. Ren, and D. Chen, “Exploring voluntary vaccination with bounded rationality through reinforcement learning,” Physica A: Statistical Mechanics and its Applications, vol. 515, pp. 171–182, 2019.
- [27] A. Sanjab, W. Saad, and T. Başar, “A game of drones: Cyber-physical security of time-critical uav applications with cumulative prospect theory perceptions and valuations,” IEEE Transactions on Communications, vol. 68, no. 11, pp. 6990–7006, 2020.
- [28] L. Huang and Q. Zhu, “Combating informational denial-of-service (IDoS) attacks: Modeling and mitigation of attentional human vulnerability,” in International Conference on Decision and Game Theory for Security, pp. 314–333, Springer, 2021.
- [29] L. Huang and Q. Zhu, “Radams: Resilient and adaptive alert and attention management strategy against informational denial-of-service (IDoS) attacks,” arXiv preprint arXiv:2111.03463, 2021.
- [30] E. Lin, S. Greenberg, E. Trotter, D. Ma, and J. Aycock, “Does domain highlighting help people identify phishing sites?,” in Proceedings of the SIGCHI Conference on Human Factors in Computing Systems, pp. 2075–2084, 2011.
- [31] D. Akhawe and A. P. Felt, “Alice in warningland: A large-scale field study of browser security warning effectiveness,” in 22nd USENIX Security Symposium (USENIX Security 13), pp. 257–272, 2013.
- [32] S. Sheng, M. Holbrook, P. Kumaraguru, L. F. Cranor, and J. Downs, “Who falls for phish? a demographic analysis of phishing susceptibility and effectiveness of interventions,” in Proceedings of the SIGCHI conference on human factors in computing systems, pp. 373–382, 2010.
- [33] D. J. Liebling and S. Preibusch, “Privacy considerations for a pervasive eye tracking world,” in Proceedings of the 2014 ACM International Joint Conference on Pervasive and Ubiquitous Computing: Adjunct Publication, pp. 1169–1177, 2014.
- [34] J. L. Kröger, O. H.-M. Lutz, and F. Müller, “What does your gaze reveal about you? on the privacy implications of eye tracking,” in IFIP International Summer School on Privacy and Identity Management, pp. 226–241, Springer, 2019.
- [35] M. I. Posner and O. S. Marin, Attention and performance XI. Routledge, 2016.
- [36] G. Nasser, B. W. Morrison, P. Bayl-Smith, R. Taib, M. Gayed, and M. W. Wiggins, “The role of cue utilization and cognitive load in the recognition of phishing emails,” Frontiers in big Data, p. 33, 2020.
- [37] M. Ackerley, B. Morrison, K. Ingrey, M. Wiggins, P. Bayl-Smith, N. Morrison, et al., “Errors, irregularities, and misdirection: Cue utilisation and cognitive reflection in the diagnosis of phishing emails,” Australas. J. Inf. Syst., vol. 26, 2022.
- [38] P. I. Frazier, “Bayesian optimization,” in Recent Advances in Optimization and Modeling of Contemporary Problems, pp. 255–278, INFORMS, 2018.
- [39] M. P. Janisse, “Pupil size and affect: A critical review of the literature since 1960.,” Canadian Psychologist/Psychologie canadienne, vol. 14, no. 4, p. 311, 1973.
- [40] O. E. Kang, K. E. Huffer, and T. P. Wheatley, “Pupil dilation dynamics track attention to high-level information,” PloS one, vol. 9, no. 8, p. e102463, 2014.
- [41] P. J. Van Laarhoven and E. H. Aarts, “Simulated annealing,” in Simulated annealing: Theory and applications, pp. 7–15, Springer, 1987.
- [42] C. D. Holland and O. V. Komogortsev, “Complex eye movement pattern biometrics: the effects of environment and stimulus,” IEEE Transactions on Information Forensics and Security, vol. 8, no. 12, pp. 2115–2126, 2013.
![[Uncaptioned image]](/html/2106.06907/assets/x16.png) |
Linan Huang received the B.Eng. degree (Hons.) in Electrical Engineering from Beijing Institute of Technology, China, in 2016 and the Ph.D. degree in electrical engineering from New York University (NYU), Brooklyn, NY, USA, in 2022. His research interests include dynamic decision-making of the multi-agent system, mechanism design, artificial intelligence, security, and resilience for cyber-physical systems. |
![[Uncaptioned image]](/html/2106.06907/assets/shumeng.jpg) |
Shumeng Jia received the B.Eng. degree in rail traffic signaling and control from Bejing Jiaotong University, China, in 2020, and the M.S. degree in electrical engineering from New York University in 2022. She worked at the Laboratory for Agile and Resilient Complex Systems, Tandon School of Engineering, New York University, NY, USA, as a graduate assistant while working on her graduate degree. Her past research has focused on machine learning and epileptiform EEG data. |
![[Uncaptioned image]](/html/2106.06907/assets/emily.jpg) |
Emily Balcetis received a BA (honors) in Psychology and a BFA in Music Performance from the University of Nebraska at Kearney in 2001 and a PhD in Social Psychology from Cornell University in 2006. She is currently an Associate Professor of Psychology at New York University (NYU), and faculty affiliate of NYU’s Institute for Human Development and Social Change. Her current research interests include motivation, decision-making, and visual experience. |
![[Uncaptioned image]](/html/2106.06907/assets/x17.png) |
Quanyan Zhu (SM’02-M’14) received B. Eng. in Honors Electrical Engineering from McGill University in 2006, M. A. Sc. from the University of Toronto in 2008, and Ph.D. from the University of Illinois at Urbana-Champaign (UIUC) in 2013. After stints at Princeton University, he is currently an associate professor at the Department of Electrical and Computer Engineering, New York University (NYU). He is an affiliated faculty member of the Center for Urban Science and Progress (CUSP) and Center for Cyber Security (CCS) at NYU. His current research interests include game theory, machine learning, cyber deception, and cyber-physical systems. |