Can Transformer Language Models Predict Psychometric Properties?
Abstract
Transformer-based language models (LMs) continue to advance state-of-the-art performance on NLP benchmark tasks, including tasks designed to mimic human-inspired “commonsense” competencies. To better understand the degree to which LMs can be said to have certain linguistic reasoning skills, researchers are beginning to adapt the tools and concepts of the field of psychometrics. But to what extent can the benefits flow in the other direction? I.e., can LMs be of use in predicting what the psychometric properties of test items will be when those items are given to human participants? We gather responses from numerous human participants and LMs (transformer- and non-transformer-based) on a broad diagnostic test of linguistic competencies. We then use the responses to calculate standard psychometric properties of the items in the diagnostic test, using the human responses and the LM responses separately. We then determine how well these two sets of predictions match. We find cases in which transformer-based LMs predict psychometric properties consistently well in certain categories but consistently poorly in others, thus providing new insights into fundamental similarities and differences between human and LM reasoning.111Code and data to reproduce our experiments can be found on Github: https://github.com/Advancing-Machine-Human-Reasoning-Lab/transformer-psychometrics
1 Introduction
The current generation of transformer-based language models (TLMs) (Vaswani et al., 2017) continues to surpass expectations, consistently achieving state-of-the-art results on many natural language processing (NLP) benchmark tasks. Especially surprising is their remarkable performance on benchmark tasks designed to assess “commonsense” reasoning (e.g., Wang et al., 2018, 2019), possibly owing to their ability to encode and retrieve a surprising amount of structural knowledge Goldberg (2019); Hu et al. (2020); Cui et al. (2020); Petroni et al. (2019); Davison et al. (2019), despite initial worries that all connectionist language models in general would suffer the same limitations as previous generations Sun (1992, 1995); McClelland (1995); Klahr (1999); McLaughlin (2009).
Understanding how TLMs reason is a complex task made more difficult by the fact that the sizes of contemporary TLMs are so large as to effectively render them black boxes. As such, researchers are continually searching for new methods to understand the strengths and limitations of TLMs. One promising approach is to draw from psychometrics, a sub-field of psychology particularly suited to dealing with perhaps the most mysterious black box of them all: the human mind. Psychometrics is concerned with psychological measurement—i.e., how to measure latent attributes like reasoning skills, attitudes, and personality traits. Psychometricians have developed tools to measure such properties even when the mechanisms that give rise to them are not fully understood, thus suggesting a possible fruitful application of those tools to complex artificial black boxes like TLMs. Although some have called for bridging the gap between psychometrics and AI (Bringsjord and Schimanski, 2003; Bringsjord, 2011; Bringsjord and Licato, 2012; Dowe and Hernández-Orallo, 2012; Hernández-Orallo et al., 2016; Wilcox et al., 2020), the amount of work attempting to do so is limited: although some existing work attempts to use advances in psychometrics to benefit the study of TLMs, none to our knowledge have used SOTA TLMs (or even LMs in general) to benefit psychometrics.
To illustrate, assume that someone wishes to design a test to assess the degree to which a person possesses mastery of some cognitive skill . A good place to start is for a panel of experts to design a set of test items (questions) , such that they believe solving requires . However, although many NLP benchmarks tend to consider this sufficient, the items in only have face validity, in that they only have been demonstrated to superficially test for . To go beyond face validity, one must assess ’s psychometric properties by establishing their validity (how well the items actually measure the phenomenon they purport to measure), reliability (how stable the items are as measurements), and fairness (how well the items are free from biases against certain sub-populations of subjects).222Note however that we focus only on validity and reliability in this work. But establishing these psychometric properties can be prohibitively costly, requiring large numbers of human participants to answer the items in and iteratively refine them. This drawback motivates the central research question of our paper: Can TLMs be used to predict psychometric properties of test items? If so, the benefit for psychometric practitioners333In other words, professionals responsible for designing standardized tests or other evaluations meant to assess latent attributes of individuals. is enormous, as it can reduce the need for multiple rounds of costly empirical testing. But the benefits for NLP are significant as well: knowing how the psychometric properties of items differ when applied to artificial versus human populations will give us unique insight into how they solve such problems, and how they can be improved.
Main Contributions of this Paper:
We present the first exploration into how well TLMs can be used to predict certain psychometric properties of linguistic test items. To do this, we identified a subset of items from the GLUE broad coverage diagnostic (Wang et al., 2018), and collected human responses on these items in order to assess simple psychometric properties, designing a novel user validation procedure to do so. We then assess the performance of 240 LMs on these diagnostic items. Our resulting analysis clearly shows that TLMs excel in modeling psychometric properties in certain sub-categories of linguistic skills, thus providing fruitful directions for future work.
2 Related Work
What reason do we have to suspect that TLMs can predict the psychometric properties of test items? Although TLMs were not primarily designed to compute in a human-like way, there are some reasons to suspect that they may have the ability to effectively model at least some aspects of human linguistic reasoning: They consistently demonstrate superior performance (at least compared to other LMs) on human-inspired linguistic benchmarks Wang et al. (2018, 2019), and they are typically pre-trained using a lengthy process designed to embed deep semantic knowledge, resulting in efficient encoding of semantic relationships Zhou et al. (2020); Petroni et al. (2019); Davison et al. (2019); Cui et al. (2020). Common optimization tasks for pre-training transformers, such as the masked LM task Devlin et al. (2018) are quite similar to the word prediction tasks that are known to predict children’s performance on other linguistic skills Borovsky et al. (2012); Neuman et al. (2011); Gambi et al. (2020). Finally, TLMs tend to outperform other LMs in recent work modeling human reading times, eye-tracking data, and other psychological and psycholinguistic phenomena Merkx and Frank (2021); Schrimpf et al. (2020b, a); Hao et al. (2020); Bhatia and Richie (2020); Laverghetta Jr. and Licato (2021); Laverghetta Jr. et al. (2021).
There are many studies probing TLMs in various ways, a body of work sometimes called “BERTology” Rogers et al. (2021); Belinkov and Glass (2019). However, work explicitly bridging psychometrics with AI is less common. Xue (2019) augmented the DINA (De La Torre, 2009) and DINO (Templin and Henson, 2006) cognitive diagnostic models (Sessoms and Henson, 2018) with a feed-forward neural network that used a semi-supervised learning objective. The architecture achieved superior results to multiple baselines. Ahmad et al. (2020) created a deep learning architecture for extracting psychometric dimensions related to healthcare, specifically numeracy, literacy, trust, anxiety, and drug experiences. Their architecture did not use transformers, and relied instead on a sophisticated combination of convolutional and recurrent layers in order to extract representations of emotions, demographics, and syntactic patterns, among others. Eisape et al. (2020) examined the correlation between human and LM next-word predictions and proposed a procedure for achieving more human-like cloze probabilities. In NLP, methods from item response theory (IRT) (Reckase, 2009) have been particularly popular. Lalor et al. (2018) used IRT models to study the impact of question difficulty on the performance of deep models on several NLP tasks. In a follow-up study, Lalor and Yu (2020) used IRT models to estimate the competence of LSTM Hochreiter and Schmidhuber (1997) and BERT models during training. This allowed them to create a dynamic curriculum learning Bengio et al. (2009) algorithm, which achieved superior performance to the same models trained using a static scheduler for several tasks. Sedoc and Ungar (2020) used IRT to efficiently assess chat-bots. Martínez-Plumed et al. (2019) used IRT to analyze the performance of machine learning classifiers in a supervised learning task. IRT has also been used to evaluate machine translation systems (Otani et al., 2016) and speech synthesizers (Oliveira et al., 2020), and also in computer vision (RichardWebster et al., 2018).
This literature clearly indicates that there has been a lot of interest in applying psychometrics to AI. So far, most of this effort has focused on specific use cases, and has not attempted to broadly assess commonalities between machine and human reasoning. Most similar to our current work is Lalor et al. (2019), who showed that deep models could achieve a strong correlation with IRT parameters fitted using human data on several NLP datasets. However, they compared the human responses to LSTMs and neural semantic encoders Munkhdalai and Yu (2017), and did not consider TLMs. Furthermore, they focused on the SNLI dataset, which is less challenging than the GLUE diagnostic and does not group questions based on fine-grained linguistic competencies.
Besides the GLUE diagnostic, other taxonomies have been proposed, such as TaxiNLI Joshi et al. (2020b). Although TaxiNLI includes some types of reasoning which have no clear analogue in GLUE, many of their categories are quite similar.444Both GLUE and TanxiNLI test for temporal reasoning, but place them at different levels in the taxonomy. Since the TaxiNLI questions were also taken from the MNLI dataset, we were concerned they would be too easy for some of the larger TLMs we planned to evaluate. We, therefore, chose to focus specifically on the challenging GLUE diagnostic set and leave TaxiNLI for future work.
3 Gathering Language Model Data
The GLUE and SuperGLUE benchmarks (Wang et al., 2018, 2019) are suites of NLP tasks designed to test the general linguistic capabilities of LMs. Included as part of the GLUE benchmark is a set of diagnostic questions, called the broad coverage diagnostic, which are all formatted as natural language inference (NLI) problems. NLI problems consist of two sentences: a premise () and hypothesis (), and solving such a problem involves assessing whether textually entails . There are typically three choices: either does textually entail (entailment), entails that is impossible (contradiction), or ’s truth can not be determined from alone (neutral). The NLI task is therefore quite general and can encompass a wide variety of other “commonsense” reasoning tasks. The broad coverage diagnostic was manually curated by linguistics and NLP experts and is meant to assess broad psycholinguistic competencies of LMs across multiple categories. For instance, the propositional structure category contains questions that exploit propositional logic operators; e.g., “The cat sat on the mat.” and “The cat did not sit on the mat.” The diagnostic covers four main categories of linguistic competencies: lexical semantics, predicate-argument structure, logic, and knowledge and common sense. These categories are further divided into multiple sub-categories, each of which covers a specific and interesting phenomenon in language. The GLUE diagnostic thus aims to be a comprehensive test of linguistic reasoning skills, making it suitable for our present study.
To evaluate our models, we selected a subset of the GLUE diagnostic questions that were a member of only one sub-category, to better isolate factors. In most cases, there were enough questions in a single sub-category that we could just drop all questions that belonged to multiple sub-categories, further details on this preprocessing can be found in Appendix A. After performing preprocessing, we had 811 remaining diagnostic questions encompassing 20 sub-categories. Each sub-category had at least 15 questions, and we selected 7 of the sub-categories to use in our experiments:
-
1.
morphological negation (MN)
-
2.
prepositional phrases (PP)
-
3.
lexical entailment (LE)
-
4.
quantifiers (Q)
-
5.
propositional structure (PS)
-
6.
richer logical structure (RLS)
-
7.
world knowledge (WK)
We selected these 7 sub-categories based on how much the average performance of the LMs improved after pre-training and finetuning. A substantial performance improvement indicated the category was solvable by the models, and would therefore provide a meaningful comparsion to the human data. We gathered responses to the diagnostic from a wide array of TLMs, including BERT (Devlin et al., 2018), RoBERTa (Liu et al., 2019), T5 (Raffel et al., 2020), ALBERT (Lan et al., 2020), XLNet (Yang et al., 2019), ELECTRA (Clark et al., 2020), Longformer (Beltagy et al., 2020), SpanBERT (Joshi et al., 2020a), DeBERTa (He et al., 2020), and ConvBERT (Jiang et al., 2020). Each of these models differs from the others along one or more factors, including underlying architecture, pre-training objective and data, or the general category the model belongs to (autoregressive, autoencoding, or sequence-to-sequence). For most of these models we used the Transformers (Wolf et al., 2020) implementation, the exception being T5, which was implemented in PyTorch Lightning (Falcon and .al, 2019). We use LSTM-based LMs (Hochreiter and Schmidhuber, 1997) as a baseline, further details on the LMs can be found in Appendix A.
We used the SNLI (Bowman et al., 2015), MNLI (Williams et al., 2018), and ANLI (Nie et al., 2020) training and dev sets to finetune our models. We found that the amount of finetuning data had a significant impact on final diagnostic performance. Therefore, to increase the variance in our results as much as possible we used the following training set partitions for all model configurations:
-
•
SNLI alone
-
•
MNLI alone
-
•
SNLI + MNLI
-
•
SNLI + MNLI + ANLI
Both the train and dev sets were shuffled before every trial. We finetuned our models for between 5 to 10 epochs. We used the reported Matthews correlation (Matthews, 1975) on the dev set during training to determine when the performance had saturated; when this correlation stopped consistently increasing for at least a few dev set evaluations we stopped training. We evaluated on the dev set every 15,000 steps. All the transformer’s key hyperparameters were selected in a similar way to the study by Lalor et al. (2019). For all models, we used a learning rate of and a max sequence length of 175. Since running even a small grid search to optimize the hyperparameters of each model would have dramatically increased the number of trials, we instead chose to fix these hyperparameters to be similar to what was used in prior work (e.g. Devlin et al., 2018). We also found that nearly all models consistently achieved a Matthews correlation of about 0.5 or higher on the dev set, and thus concluded that our hyperparameters were suitable. It is important to note that our goal in finetuning was not to completely optimize the model’s performance on these NLI datasets. Rather, since the diagnostic is formatted as an NLI task, we hoped that finetuning would help the models to learn what the output labels should be.555Finetuning T5 is necessary to avoid random output. To evaluate these models, we experimented with four different training regimes:
-
•
Zero shot: The model is initialized with random weights in the hidden layers and is evaluated on the diagnostic without any training. This is meant to test whether there is any property of the architecture itself which is useful for solving the diagnostic.
-
•
Pre-train, no finetune: The model is pre-trained but not finetuned.
-
•
No pre-train, finetune: The model weights are initialized randomly, but we finetune the model before evaluating it.
-
•
Pre-train and finetune: The model is pre-trained and finetuned.
For BERT, we experimented with both Devlin et al.’s pre-trained models, and a BERT model we trained from scratch. Our BERT model had an identical architecture to bert-base and was pre-trained on Google’s One Billion Words corpus (Chelba et al., 2014). We used the same hyperparameters from the BERT paper Devlin et al. (2018), using a learning rate of , a max sequence length of 128, a warmup ratio of 0.01, and a weight decay of 0.01. We used the Transformers library to pre-train this model, and saved every end-of-epoch checkpoint. We pre-trained for 52 epochs and used every 10th checkpoint to gather diagnostic data separately. This allowed us to study the effect pre-training had on diagnostic performance.
In summary, this process allowed us to vary the underlying architecture, the number of trainable parameters, and the amount of finetuning data used in each trial. This allowed us to treat each trained model as effectively being a different “individual” (and we will refer to them as such), which might have a radically different cognitive profile from its counterparts. For example, a roberta-base model that was pre-trained and finetuned on all 3 NLI datasets might produce very different response patterns than a roberta-large model evaluated zero-shot. We used three Tesla V100 GPUs with 32GB of video memory each, as well as preemptable GPUs on Google Colab,666https://colab.research.google.com to train all models. Wherever possible, we used Apex777https://github.com/NVIDIA/apex to speed up training.
4 Human Studies
As our purpose in gathering this LM data was to evaluate it against human performance, we additionally ran a human study. To do this, we recruited workers on Amazon Mechanical Turk (mTurk888https://www.mturk.com) to complete our subset of GLUE diagnostic questions. While mTurk makes conducting large-scale human studies convenient, there are also well-documented problems with participants not completing tasks in good faith (Berinsky et al., 2014, 2016; Keith et al., 2017). There are multiple techniques for filtering out bad-faith participants, such as the use of “attention check” questions, sometimes called “instructional manipulation checks” Hauser and Schwarz (2015), which are designed so that a good-faith participant would be unlikely to get them incorrect. But this alone would not suffice for our purposes here, as we want a certain amount of low-scoring participants on some sub-categories, so that the population variances on sub-category items would better reflect their actual variances.999If we only kept high-performing participants, the item variances would be skewed to be low and roughly the same, which would not reflect the true variances we would expect to see from a large population of good-faith participants. Therefore, we designed a procedure for distinguishing bad-faith from low-performing participants.
We first obtained attention checks from the ChaosNLI dataset (Nie et al., 2020), which gathered over 450,000 human annotations on questions from SNLI and MNLI. Since each question in ChaosNLI was annotated by 100 different workers, if inter-annotator agreement for a given question is high, we conclude that question is likely extremely easy to solve. These questions were also in the same format as the diagnostic questions, which made it less likely that workers would realize they were being given an attention check. We gathered 36 questions from ChaosNLI where the agreement for the correct label was at least 90%. The labels for this subset were perfectly balanced. These were enough questions to ensure that each phase of our trials used a unique set of attention check questions.
The human studies were split up into 5 phases, and workers who did sufficiently well in a given phase were given a qualification to continue to the next phase:
-
1.
On-boarding: A qualifying HIT (human intelligence task) open to any worker located in the United States, who had completed at least 50 HITs with an approval rating of at least 90%. The HIT consisted of 5 attention check questions, given to each worker in the same order. We gathered responses from up to 200 workers.
-
2.
Phase 1: Included questions from morphological negation, and 3 attention checks. We gathered up to 45 responses.
-
3.
Phase 2: Included questions from lexical entailment and prepositional phrases, as well as 6 attention checks. We gathered up to 36 responses.
-
4.
Phase 3: Included questions from quantifiers and propositional structure, as well as 6 attention checks. We gathered up to 27 responses.
-
5.
Phase 4: Included questions from richer logical structure and world knowledge, as well as 6 attention checks. We gathered responses from all accepted workers from Phase 3.
In each phase, questions were randomly ordered, except for attention checks which were spread evenly throughout the survey. We used Qualtrics101010https://www.qualtrics.com to create the surveys for each HIT and collect the responses. Participants were first presented with instructions for the task and some examples, which were based on the instructions originally given to annotators for the MNLI dataset.111111https://nyu-mll.github.io/GLUE-human-performance/mnli.html The questions from each category were a randomly chosen subset of 15 questions tested on the LMs for that category, balanced for each label. For each question, workers also had to provide a short justification statement on why they believed their answer was correct, which was used to help filter out bad faith participants. To validate the responses to our surveys, we developed the following authentication procedure:
Stage 1:
Look for duplicate IPs or worker IDs, indicating that the worker took the HIT more than once. If there are any, reject the second and future HITs, but keep the first submission.
Stage 2: If the worker’s overall score was less than 40%, reject the HIT. If their overall score was greater than 60%, accept the HIT. For workers who scored between 40% and 60%, we still rejected the HIT if they got less than 75% of the attention checks correct.
Stage 3: Finally, examine the justifications of all workers not previously rejected. Here we were looking for simple, but clear, reasons for why workers chose their answer. We included this step because we found in a pilot study that workers sometimes provided nonsensical justifications for their answers even when they did well on the survey, making it unclear whether they were truly paying attention. We checked that the justifications appeared relevant to the question (some workers seemed to paste random text from other websites into the justification), that they did not paste part of the question for their justification, that they did not use the same justification for every question, and that they did not use short nonsensical phrases for their justification (some workers simply wrote “good” or “nice” as their justification). This allowed us to keep some low-scoring participants who had put genuine effort into the task.
Manual inspection of the resulting responses suggested that workers who passed stage 3 consistently gave higher quality responses than those who did not. These workers gave more detailed justifications that clearly articulated their thought process, often citing specific details from the question. On the other hand, workers who failed to give good justifications also tended to perform quite poorly, generally scoring at or below random chance, which further indicated that they were not actually paying attention. We, therefore, believe the use of justifications helped us gather higher-quality responses. Further details on the human study can be found in Appendix B.
5 Experimental Results
Using the procedures described in §3 and §4, we gathered results from 27 human participants and 240 neural LMs (183 transformer-based and 57 LSTM-based). In addition to the LSTMs, we also include a true random baseline which simply guesses randomly on every question. In the following experiments, we use the human performance on each category as the basis for analyzing the performance of the artificial populations, specifically in terms of how well each artificial population’s responses correlate with the human data.
| Category | |||
|---|---|---|---|
| MN | -0.28, <0.5 | 0.27, >0.5 | -0.14, >0.5 |
| PP | 0.86, <0.001 | 0.47, <0.1 | 0.42, <0.5 |
| LE | 0.62, <0.05 | 0.17, >0.5 | -0.22, <0.5 |
| Q | 0.57, <0.05 | -0.22, <0.5 | 0.41, <0.5 |
| PS | 0.93, <0.001 | 0.27, <0.5 | 0.37, <0.5 |
| RLS | 0.28, <0.5 | -0.03, >0.5 | -0.37, <0.5 |
| WK | 0.79, <0.001 | 0.46, <0.1 | -0.25, <0.5 |
5.1 Classical Test Theory
We began by examining how well TLMs could predict simple problem difficulty in the human data. This measure comes from classical test theory and is calculated simply as how many members of the population get a given item right. For each item in a given sub-category in our subset of the GLUE diagnostic, we calculated the percentage of human participants who got that question correct (), and then the corresponding percentage for the TLMs (), LSTM-based LMs (), and the random baseline (). We then calculated the Spearman correlation (Spearman, 1961) between and each of the other populations. Results are shown in Table 1. In almost all cases, TLMs achieve a much stronger correlation with the human data than either baseline, and most were statistically significant. The main exceptions are morphological negation (MN) and richer logical structure (RLS), both of which fail to produce strong correlations. As we will see, this pattern will repeat in other measurements as well.
IIC-based Clustering
An important idea in psychometrics is that questions that rely on the same skills should have similar chances of being answered correctly by a given participant Rust and Golombok (2014). Whether questions rely on similar skills can be tested using the inter-item correlation (IIC) between two items, where high IIC suggests that the items rely on similar underlying reasoning skills. Thus, it can be assumed that if items cluster together when using IIC as a distance metric, they rely on similar underlying cognitive skills. To explore this, given a correlation measure ranging from -1 to 1, we convert it into a distance metric by taking . We use this metric to apply k-medoids clustering to the diagnostic questions, using the silhouette method (Rousseeuw, 1987) to find the optimal number of clusters. For each sub-category, we perform clustering using human, transformer, LSTM, and random data separately (, , , and respectively). We use the k-medoids implementation from scikit-learn extra121212https://github.com/scikit-learn-contrib/scikit-learn-extra and use scikit-learn (Pedregosa et al., 2011) to calculate the silhouette coefficient.
After clustering, for each pair of items () we define as if and are in the same cluster as determined by dataset . Finally, to determine how well clusters from the LM responses match the human responses, we calculate Pearson correlation (Pearson, 1895) between and each of , , and . Results are shown in Table 2. Similar to Table 1, we see statistically significant correlations from TLMs in every sub-category, except for morphological negation (MN), where TLMs again achieve only weak correlation.
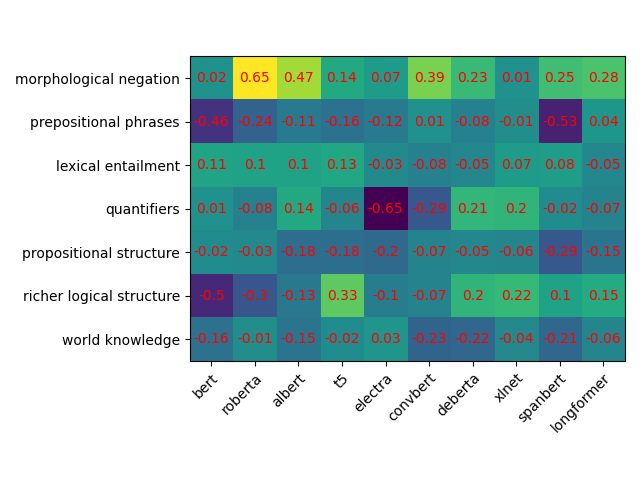
Per Model Analysis
The previous results give us some insights into the performance of the entire TLM population. However, individual transformers might differ somewhat in the specific skills they are proficient in. To study this, we performed the same simple problem difficulty experiment, but this time only used the diagnostic results from a single transformer architecture (for instance just BERT). We did this for each architecture, and then on each diagnostic sub-category, we computed the difference between the single architecture’s correlation and the overall correlation from Table 1. The heatmap in Figure 1 shows the results, with cooler colors indicating a stronger decrease in correlation and warmer colors indicating a stronger increase. In many cases, the correlation is almost the same as the value reported in Table 1. However, in some cases the difference is striking. For example, RoBERTa gets a much stronger correlation on morphological negation than any other model. Overall, it appears that most models are achieving close to the mean correlation, but there are a few significant differences.
| Category | |||
|---|---|---|---|
| MN | 0.18, <0.1 | 0.40, <0.001 | -0.14, <0.5 |
| PP | 0.31, <0.01 | -0.15, <0.5 | -0.01, >0.5 |
| LE | 0.31, <0.01 | -0.03, >0.5 | -0.16, <0.5 |
| Q | 0.24, <0.05 | -0.01, >0.5 | 0.06, >0.5 |
| PS | 0.51, <0.001 | 0.03, >0.5 | 0.04, >0.5 |
| RLS | 0.46, <0.001 | -0.07, <0.5 | 0.04, >0.5 |
| WK | 0.28, <0.01 | 0.00, >0.5 | -0.09, <0.5 |
5.2 Item Response Theory
Models from classical test theory have an important shortcoming: they provide no clear way to separate the characteristics of the test taker and the test items. In practice, the observed performance on a test is affected by both the test taker and the test itself. This intuition is formalized in a psychometrics approach known as item response theory (IRT), in which both item characteristics and individual ability are modeled and used to predict performance (Baker and Kim, 2004). IRT models are often regarded as more informative than classical models and have become standard tools when designing evaluation scales. Formally, let be an individual taking a test, be an item on that test, and be that individual’s latent ability. Then the probability that answers correctly is defined as:
| (1) |
Where , , and are item parameters and indicates a correct answer. is the discrimination parameter, which refers to how effective the item is for picking out high versus low ability test takers. is the difficulty parameter, which models how easy or difficult the item is. Finally, is the probability of guessing correctly. If both guessing and discrimination are held constant, we get the one-parameter or Rasch model (Rasch, 1993). Given a large number of human responses to a set of items, parameters for IRT models can be estimated using the marginal maximum likelihood method and expectation maximization (Bock and Aitkin, 1981).
Since TLMs correlated well with humans using the classical techniques we tested, we wished to examine whether this would still hold using IRT models. To do this, we used the diagnostic results from each population to fit Rasch models. We used the ltm R package to fit all models (Rizopoulos, 2006). This gave us separate difficulty parameter estimates for each item , for each population. To determine how well the difficulty parameters matched between populations, we calculated the Pearson correlation between the using our human response data (), and the obtained using the other populations (, , ). Results are shown in Table 3. As before, TLMs consistently get a stronger correlation than either baseline on most sub-categories, except for morphological negation (MN) and richer logical structure (RLS). Interestingly, LSTM-based LMs achieved statistically significant and stronger correlations than TLMs on certain sub-categories: world knowledge (WK) and prepositional phrases (PP). The only other experiment where LSTM-based LMs achieved stronger correlation was reported in Table 2, where they achieved superior correlation to TLMs on morphological negation (MN).
| Category | |||
|---|---|---|---|
| MN | 0.08, >0.5 | 0.29, <0.5 | 0.19, >0.5 |
| PP | 0.48, <0.1 | 0.69, <0.01 | -0.25, <0.5 |
| LE | 0.88, <0.001 | -0.06, >0.5 | 0.14, >0.5 |
| Q | 0.61, <0.05 | 0.03, >0.5 | 0.12, >0.5 |
| PS | 0.61, <0.05 | 0.05, >0.5 | -0.25, <0.5 |
| RLS | 0.16, >0.5 | -0.05, >0.5 | -0.31, <0.5 |
| WK | 0.52, <0.05 | 0.59, <0.05 | -0.1, >0.5 |
6 Discussion
Our analysis has revealed some interesting patterns that would have been difficult to discern using traditional evaluation metrics. Overall, TLMs perform consistently better than either of our baselines in modeling human psychometric properties. However, this improvement is also not uniform across all psycholinguistic categories. In fact, we have found some regularities in this regard. For instance, TLMs failed to achieve a strong correlation on morphological negation in all cases. This might be explained by two facts: there is little relative variance in the human responses in this sub-category, and the average accuracy of human participants was above 90%, as opposed to LM accuracy of 55%. This sub-category also tests for reasoning over negation, which prior studies found that transformers struggle with (Rogers et al., 2021). This ability to analyze the specific kinds of reasoning transformers have become proficient in is a clear advantage psychometrics have over typical NLP evaluations. The NLP community is becoming increasingly aware of the need to construct more fine-grained evaluation benchmarks Wang et al. (2018); Joshi et al. (2020b), and we believe our work complements these efforts nicely.
Of course, this study also has limitations. The number of human participants in our study was somewhat small compared to typical psychometrics studies, which makes it difficult to draw stronger conclusions. One of the main criticisms IRT models draw is that they can require thousands of responses to get good estimates of the latent parameters Min and Aryadoust (2021). As stated earlier, practical limitations on population size is a common problem in psychometrics research, one which our present work hopes to alleviate somewhat. Future work will need to repeat our experiments with much larger population sizes, and also take measures to ensure sufficient diversity in the study population (e.g., age, income, education level, English fluency, etc.). Improvements in the computational efficiency of TLMs is likely also necessary for our approach to be practical, as it is unlikely most pyschometricians have access to extensive GPU resources. One possible solution would be to identify a subset of TLMs that preserves the psychometric properties of the entire population, which might allow us to achieve similar results with fewer models.
Furthermore, although we reported in detail on certain psychometrics measures where our method demonstrated promising results for TLMs, it is worth reporting that certain other measures we examined did not appear to align well. For example, item-total correlations using human data did not appear to correlate with any LM data better than with the random baseline. Likewise, our LMs failed to predict average inter-item correlations between either random subsets of items or our diagnostic sub-categories. More work is needed to better understand why.
Finally, while our experiments have given us some insights into the validity and reliability of the diagnostic items, it is unclear whether our approach can allow us to measure their fairness. Although it is an important property, fairness is somewhat more controversial than other psychometric properties, in part because there are multiple interpretations of what constitutes test bias Warne et al. (2014). Being able to probe the fairness of items would have interesting downstream applications. For instance, it might indicate whether a diagnostic gives an unfair advantage to certain types of classifiers.
7 Conclusion
We believe our work offers a clear path forward for bridging psychometrics and AI. The use of psychometrics measures gives us a more nuanced understanding of the latent abilities of LMs than single-valued measures like accuracy or can provide. Furthermore, the increasingly powerful ability of TLMs to model human “commonsense” reasoning and knowledge suggests new ways to predict psychometrics properties of test items, reducing the need for costly human empirical data.
Acknowledgments
This material is based upon work supported by the Air Force Office of Scientific Research under award numbers FA9550-17-1-0191 and FA9550-18-1-0052. Any opinions, findings, and conclusions or recommendations expressed in this material are those of the authors and do not necessarily reflect the views of the United States Air Force.
References
- Ahmad et al. (2020) Faizan Ahmad, Ahmed Abbasi, Jingjing Li, David G Dobolyi, Richard G Netemeyer, Gari D Clifford, and Hsinchun Chen. 2020. A deep learning architecture for psychometric natural language processing. ACM Transactions on Information Systems (TOIS), 38(1):1–29.
- Baker and Kim (2004) Frank B Baker and Seock-Ho Kim. 2004. Item response theory: Parameter estimation techniques. CRC Press.
- Belinkov and Glass (2019) Yonatan Belinkov and James Glass. 2019. Analysis methods in neural language processing: A survey. Transactions of the Association for Computational Linguistics, 7:49–72.
- Beltagy et al. (2020) Iz Beltagy, Matthew E. Peters, and Arman Cohan. 2020. Longformer: The long-document transformer. arXiv preprint arXiv:2004.05150.
- Bengio et al. (2009) Yoshua Bengio, Jérôme Louradour, Ronan Collobert, and Jason Weston. 2009. Curriculum learning. In Proceedings of the 26th annual international conference on machine learning, pages 41–48.
- Berinsky et al. (2014) Adam J. Berinsky, Michele F. Margolis, and Michael W. Sances. 2014. Separating the shirkers from the workers? making sure respondents pay attention on self‐administered surveys. American Journal of Political Science, 58(3):739–753.
- Berinsky et al. (2016) Adam J. Berinsky, Michele F. Margolis, and Michael W. Sances. 2016. Can we turn shirkers into workers. Journal of Experimental Social Psychology, 66:20–28.
- Bhatia and Richie (2020) Sudeep Bhatia and Russell Richie. 2020. Transformer Networks of Human Concept Knowledge.
- Bock and Aitkin (1981) R Darrell Bock and Murray Aitkin. 1981. Marginal maximum likelihood estimation of item parameters: Application of an em algorithm. Psychometrika, 46(4):443–459.
- Borovsky et al. (2012) Arielle Borovsky, Jeffrey L. Elman, and Anne Fernald. 2012. Knowing a lot for one’s age: Vocabulary skill and not age is associated with anticipatory incremental sentence interpretation in children and adults. Journal of Experimental Child Psychology, 112(4):417–436.
- Bowman et al. (2015) Samuel R. Bowman, Gabor Angeli, Christopher Potts, and Christopher D. Manning. 2015. A large annotated corpus for learning natural language inference. In Proceedings of the 2015 Conference on Empirical Methods in Natural Language Processing (EMNLP). Association for Computational Linguistics.
- Bringsjord (2011) Selmer Bringsjord. 2011. Psychometric artificial intelligence. Journal of Experimental & Theoretical Artificial Intelligence, 23(3):271–277.
- Bringsjord and Licato (2012) Selmer Bringsjord and John Licato. 2012. Psychometric artificial general intelligence: the piaget-macguyver room. In Theoretical foundations of artificial general intelligence, pages 25–48. Springer.
- Bringsjord and Schimanski (2003) Selmer Bringsjord and Bettina Schimanski. 2003. What is artificial intelligence? psychometric ai as an answer. In Proceedings of the 18th international joint conference on Artificial intelligence, pages 887–893.
- Chelba et al. (2014) Ciprian Chelba, Tomas Mikolov, Mike Schuster, Qi Ge, Thorsten Brants, Phillipp Koehn, and Tony Robinson. 2014. One billion word benchmark for measuring progress in statistical language modeling. In Fifteenth Annual Conference of the International Speech Communication Association.
- Clark et al. (2020) Kevin Clark, Minh-Thang Luong, Quoc V. Le, and Christopher D. Manning. 2020. Electra: Pre-training text encoders as discriminators rather than generators. In ICLR 2020 : Eighth International Conference on Learning Representations.
- Cui et al. (2020) Leyang Cui, Sijie Cheng, Yu Wu, and Yue Zhang. 2020. Does bert solve commonsense task via commonsense knowledge? arXiv preprint arXiv:2008.03945.
- Davison et al. (2019) Joe Davison, Joshua Feldman, and Alexander Rush. 2019. Commonsense knowledge mining from pretrained models. In Proceedings of the 2019 Conference on Empirical Methods in Natural Language Processing and the 9th International Joint Conference on Natural Language Processing (EMNLP-IJCNLP), pages 1173–1178, Hong Kong, China. Association for Computational Linguistics.
- De La Torre (2009) Jimmy De La Torre. 2009. Dina model and parameter estimation: A didactic. Journal of educational and behavioral statistics, 34(1):115–130.
- Devlin et al. (2018) Jacob Devlin, Ming-Wei Chang, Kenton Lee, and Kristina N. Toutanova. 2018. Bert: Pre-training of deep bidirectional transformers for language understanding. In Proceedings of the 2019 Conference of the North American Chapter of the Association for Computational Linguistics: Human Language Technologies, Volume 1 (Long and Short Papers), pages 4171–4186.
- Dowe and Hernández-Orallo (2012) David L. Dowe and José Hernández-Orallo. 2012. Iq tests are not for machines, yet. Intelligence, 40(2):77–81.
- Eisape et al. (2020) Tiwalayo Eisape, Noga Zaslavsky, and Roger Levy. 2020. Cloze Distillation Improves Psychometric Predictive Power. In Proceedings of the 24th Conference on Computational Natural Language Learning, pages 609–619.
- Falcon and .al (2019) WA Falcon and .al. 2019. Pytorch lightning. GitHub. Note: https://github.com/PyTorchLightning/pytorch-lightning, 3.
- Gambi et al. (2020) Chiara Gambi, Priya Jindal, Sophie Sharpe, Martin J. Pickering, and Hugh Rabagliati. 2020. The relation between preschoolers’ vocabulary development and their ability to predict and recognize words. Child Development, n/a(n/a).
- Goldberg (2019) Yoav Goldberg. 2019. Assessing bert’s syntactic abilities. CoRR, abs/1901.05287.
- Hao et al. (2020) Yiding Hao, Simon Mendelsohn, Rachel Sterneck, Randi Martinez, and Robert Frank. 2020. Probabilistic predictions of people perusing: Evaluating metrics of language model performance for psycholinguistic modeling. In Proceedings of the Workshop on Cognitive Modeling and Computational Linguistics, pages 75–86.
- Hauser and Schwarz (2015) David J. Hauser and Norbert Schwarz. 2015. It’s a trap! instructional manipulation checks prompt systematic thinking on “tricky” tasks. SAGE Open, 5(2).
- He et al. (2020) Pengcheng He, Xiaodong Liu, Jianfeng Gao, and Weizhu Chen. 2020. Deberta: Decoding-enhanced bert with disentangled attention.
- Hernández-Orallo et al. (2016) José Hernández-Orallo, Fernando Martínez-Plumed, Ute Schmid, Michael Siebers, and David L. Dowe. 2016. Computer models solving intelligence test problems: Progress and implications. Artificial Intelligence, 230:74 – 107.
- Hochreiter and Schmidhuber (1997) Sepp Hochreiter and Jürgen Schmidhuber. 1997. Long Short-Term Memory. Neural Computation, 9(8):1735–1780.
- Hu et al. (2020) Jennifer Hu, Jon Gauthier, Peng Qian, Ethan Wilcox, and Roger Levy. 2020. A systematic assessment of syntactic generalization in neural language models. In Proceedings of the 58th Annual Meeting of the Association for Computational Linguistics, pages 1725–1744, Online. Association for Computational Linguistics.
- Jiang et al. (2020) Zi-Hang Jiang, Weihao Yu, Daquan Zhou, Yunpeng Chen, Jiashi Feng, and Shuicheng Yan. 2020. Convbert: Improving bert with span-based dynamic convolution. Advances in Neural Information Processing Systems, 33.
- Joshi et al. (2020a) Mandar Joshi, Danqi Chen, Yinhan Liu, Daniel S Weld, Luke Zettlemoyer, and Omer Levy. 2020a. Spanbert: Improving pre-training by representing and predicting spans. Transactions of the Association for Computational Linguistics, 8:64–77.
- Joshi et al. (2020b) Pratik Joshi, Somak Aditya, Aalok Sathe, and Monojit Choudhury. 2020b. Taxinli: Taking a ride up the nlu hill. In Proceedings of the 24th Conference on Computational Natural Language Learning, pages 41–55.
- Keith et al. (2017) Melissa G. Keith, Louis Tay, and Peter D. Harms. 2017. Systems perspective of amazon mechanical turk for organizational research: Review and recommendations. Frontiers in Psychology, 8:1359.
- Klahr (1999) David Klahr. 1999. The Conceptual Habitat: In What Kind of System Can Concepts Develop? In Ellin Kofsky, editor, Conceptual Development : Piaget’s Legacy, chapter 6. Lawrence Erlbaum Associates.
- Lalor et al. (2018) John P Lalor, Hao Wu, Tsendsuren Munkhdalai, and Hong Yu. 2018. Understanding deep learning performance through an examination of test set difficulty: A psychometric case study. In Proceedings of the Conference on Empirical Methods in Natural Language Processing. Conference on Empirical Methods in Natural Language Processing, volume 2018, page 4711. NIH Public Access.
- Lalor et al. (2019) John P Lalor, Hao Wu, and Hong Yu. 2019. Learning latent parameters without human response patterns: Item response theory with artificial crowds. In Proceedings of the Conference on Empirical Methods in Natural Language Processing. Conference on Empirical Methods in Natural Language Processing, volume 2019, page 4240. NIH Public Access.
- Lalor and Yu (2020) John P Lalor and Hong Yu. 2020. Dynamic data selection for curriculum learning via ability estimation. In Proceedings of the Conference on Empirical Methods in Natural Language Processing. Conference on Empirical Methods in Natural Language Processing, volume 2020, page 545. NIH Public Access.
- Lan et al. (2020) Zhenzhong Lan, Mingda Chen, Sebastian Goodman, Kevin Gimpel, Piyush Sharma, and Radu Soricut. 2020. Albert: A lite bert for self-supervised learning of language representations. In ICLR 2020 : Eighth International Conference on Learning Representations.
- Laverghetta Jr. and Licato (2021) Antonio Laverghetta Jr. and John Licato. 2021. Modeling age of acquisition norms using transformer networks. In Proceedings of The 34th International Florida Artificial Intelligence Research Society Conference (FLAIRS-34). AAAI Press.
- Laverghetta Jr. et al. (2021) Antonio Laverghetta Jr., Animesh Nighojkar, Jamshidbek Mirzakhalov, and John Licato. 2021. Predicting Human Psychometric Properties Using Computational Language Models. In Proceedings of the 86th Annual Meeting of the Psychometric Society.
- Liu et al. (2019) Yinhan Liu, Myle Ott, Naman Goyal, Jingfei Du, Mandar Joshi, Danqi Chen, Omer Levy, Mike Lewis, Luke Zettlemoyer, and Veselin Stoyanov. 2019. Roberta: A robustly optimized bert pretraining approach. arXiv preprint arXiv:1907.11692.
- Martínez-Plumed et al. (2019) Fernando Martínez-Plumed, Ricardo BC Prudêncio, Adolfo Martínez-Usó, and José Hernández-Orallo. 2019. Item response theory in ai: Analysing machine learning classifiers at the instance level. Artificial Intelligence, 271:18–42.
- Matthews (1975) Brian W Matthews. 1975. Comparison of the predicted and observed secondary structure of t4 phage lysozyme. Biochimica et Biophysica Acta (BBA)-Protein Structure, 405(2):442–451.
- McClelland (1995) J.L. McClelland. 1995. A Connectionist Perspective on Knowledge and Development. In T.J. Simon and Graeme S Halford, editors, Developing Cognitive Competence: New Approaches to Process Modeling. Psychology Press.
- McLaughlin (2009) Brian P McLaughlin. 2009. Systematicity Redux. Synthese, 170(2):251–274.
- Merkx and Frank (2021) Danny Merkx and Stefan L. Frank. 2021. Human sentence processing: Recurrence or attention? In Proceedings of the Workshop on Cognitive Modeling and Computational Linguistics, pages 12–22, Online. Association for Computational Linguistics.
- Min and Aryadoust (2021) Shangchao Min and Vahid Aryadoust. 2021. A systematic review of item response theory in language assessment: Implications for the dimensionality of language ability. Studies in Educational Evaluation, 68:100963.
- Munkhdalai and Yu (2017) Tsendsuren Munkhdalai and Hong Yu. 2017. Neural semantic encoders. In Proceedings of the 15th Conference of the European Chapter of the Association for Computational Linguistics: Volume 1, Long Papers, pages 397–407, Valencia, Spain. Association for Computational Linguistics.
- Neuman et al. (2011) Susan B. Neuman, Ellen H. Newman, and Julie Dwyer. 2011. Educational effects of a vocabulary intervention on preschoolers’ word knowledge and conceptual development: A cluster-randomized trial. Reading Research Quarterly, 46(3):249–272.
- Nie et al. (2020) Yixin Nie, Adina Williams, Emily Dinan, Mohit Bansal, Jason Weston, and Douwe Kiela. 2020. Adversarial NLI: A new benchmark for natural language understanding. In Proceedings of the 58th Annual Meeting of the Association for Computational Linguistics. Association for Computational Linguistics.
- Nie et al. (2020) Yixin Nie, Xiang Zhou, and Mohit Bansal. 2020. What can we learn from collective human opinions on natural language inference data. In Proceedings of the 2020 Conference on Empirical Methods in Natural Language Processing (EMNLP), pages 9131–9143.
- Oliveira et al. (2020) Chaina Santos Oliveira, C. C. Tenório, and R. Prudêncio. 2020. Item response theory to estimate the latent ability of speech synthesizers. In ECAI.
- Otani et al. (2016) Naoki Otani, Toshiaki Nakazawa, Daisuke Kawahara, and Sadao Kurohashi. 2016. Irt-based aggregation model of crowdsourced pairwise comparison for evaluating machine translations. In Proceedings of the 2016 Conference on Empirical Methods in Natural Language Processing, pages 511–520.
- Pearson (1895) K Pearson. 1895. Notes on regression and inheritance in the case of two parents proceedings of the royal society of london, 58, 240-242.
- Pedregosa et al. (2011) F. Pedregosa, G. Varoquaux, A. Gramfort, V. Michel, B. Thirion, O. Grisel, M. Blondel, P. Prettenhofer, R. Weiss, V. Dubourg, J. Vanderplas, A. Passos, D. Cournapeau, M. Brucher, M. Perrot, and E. Duchesnay. 2011. Scikit-learn: Machine learning in Python. Journal of Machine Learning Research, 12:2825–2830.
- Pennington et al. (2014) Jeffrey Pennington, Richard Socher, and Christopher Manning. 2014. Glove: Global vectors for word representation. In Proceedings of the 2014 Conference on Empirical Methods in Natural Language Processing (EMNLP), pages 1532–1543.
- Petroni et al. (2019) Fabio Petroni, Tim Rocktäschel, Sebastian Riedel, Patrick Lewis, Anton Bakhtin, Yuxiang Wu, and Alexander Miller. 2019. Language models as knowledge bases? In Proceedings of the 2019 Conference on Empirical Methods in Natural Language Processing and the 9th International Joint Conference on Natural Language Processing (EMNLP-IJCNLP), pages 2463–2473.
- Raffel et al. (2020) Colin Raffel, Noam Shazeer, Adam Roberts, Katherine Lee, Sharan Narang, Michael Matena, Yanqi Zhou, Wei Li, and Peter J. Liu. 2020. Exploring the limits of transfer learning with a unified text-to-text transformer. Journal of Machine Learning Research, 21(140):1–67.
- Rasch (1993) Georg Rasch. 1993. Probabilistic models for some intelligence and attainment tests. ERIC.
- Reckase (2009) Mark D Reckase. 2009. Multidimensional item response theory models. In Multidimensional item response theory, pages 79–112. Springer.
- RichardWebster et al. (2018) Brandon RichardWebster, So Yon Kwon, Christopher Clarizio, Samuel E Anthony, and Walter J Scheirer. 2018. Visual psychophysics for making face recognition algorithms more explainable. In Proceedings of the European Conference on Computer Vision (ECCV), pages 252–270.
- Rizopoulos (2006) Dimitris Rizopoulos. 2006. ltm: An r package for latent variable modeling and item response theory analyses. Journal of statistical software, 17(5):1–25.
- Rogers et al. (2021) Anna Rogers, Olga Kovaleva, and Anna Rumshisky. 2021. A primer in bertology: What we know about how bert works. Transactions of the Association for Computational Linguistics, 8:842–866.
- Rousseeuw (1987) Peter J Rousseeuw. 1987. Silhouettes: a graphical aid to the interpretation and validation of cluster analysis. Journal of computational and applied mathematics, 20:53–65.
- Rust and Golombok (2014) John Rust and Susan Golombok. 2014. Modern psychometrics: The science of psychological assessment. Routledge.
- Schrimpf et al. (2020a) Martin Schrimpf, Idan Blank, Greta Tuckute, Carina Kauf, Eghbal A. Hosseini, Nancy Kanwisher, Joshua Tenenbaum, and Evelina Fedorenko. 2020a. Artificial neural networks accurately predict language processing in the brain. bioRxiv.
- Schrimpf et al. (2020b) Martin Schrimpf, Idan Blank, Greta Tuckute, Carina Kauf, Eghbal A. Hosseini, Nancy Kanwisher, Joshua Tenenbaum, and Evelina Fedorenko. 2020b. The neural architecture of language: Integrative reverse-engineering converges on a model for predictive processing. bioRxiv.
- Sedoc and Ungar (2020) João Sedoc and Lyle Ungar. 2020. Item response theory for efficient human evaluation of chatbots. In Proceedings of the First Workshop on Evaluation and Comparison of NLP Systems, pages 21–33.
- Sessoms and Henson (2018) John Sessoms and Robert A Henson. 2018. Applications of diagnostic classification models: A literature review and critical commentary. Measurement: Interdisciplinary Research and Perspectives, 16(1):1–17.
- Spearman (1961) Charles Spearman. 1961. The proof and measurement of association between two things.
- Srivastava et al. (2014) Nitish Srivastava, Geoffrey Hinton, Alex Krizhevsky, Ilya Sutskever, and Ruslan Salakhutdinov. 2014. Dropout: a simple way to prevent neural networks from overfitting. The journal of machine learning research, 15(1):1929–1958.
- Sun (1992) Ron Sun. 1992. On variable binding in connectionist networks. ConnectionScience, 4(2):93–124.
- Sun (1995) Ron Sun. 1995. Schemas, Logics, and Neural Assemblies. Applied Intelligence, 5.2:83–102.
- Templin and Henson (2006) Jonathan L Templin and Robert A Henson. 2006. Measurement of psychological disorders using cognitive diagnosis models. Psychological methods, 11(3):287.
- Vaswani et al. (2017) Ashish Vaswani, Noam Shazeer, Niki Parmar, Jakob Uszkoreit, Llion Jones, Aidan N. Gomez, undefinedukasz Kaiser, and Illia Polosukhin. 2017. Attention is all you need. In Proceedings of the 31st International Conference on Neural Information Processing Systems, NIPS’17, page 6000–6010, Red Hook, NY, USA. Curran Associates Inc.
- Wang et al. (2019) Alex Wang, Yada Pruksachatkun, Nikita Nangia, Amanpreet Singh, Julian Michael, Felix Hill, Omer Levy, and Samuel R. Bowman. 2019. Superglue: A stickier benchmark for general-purpose language understanding systems. In Proceedings of NeurIPS.
- Wang et al. (2018) Alex Wang, Amanpreet Singh, Julian Michael, Felix Hill, Omer Levy, and Samuel Bowman. 2018. GLUE: A multi-task benchmark and analysis platform for natural language understanding. In Proceedings of the 2018 EMNLP Workshop BlackboxNLP: Analyzing and Interpreting Neural Networks for NLP, pages 353–355, Brussels, Belgium. Association for Computational Linguistics.
- Warne et al. (2014) Russell T Warne, Myeongsun Yoon, and Chris J Price. 2014. Exploring the various interpretations of “test bias”. Cultural Diversity and Ethnic Minority Psychology, 20(4):570.
- Wilcox et al. (2020) Ethan Gotlieb Wilcox, Jon Gauthier, Jennifer Hu, Peng Qian, and Roger Levy. 2020. On the predictive power of neural language models for human real-time comprehension behavior.
- Williams et al. (2018) Adina Williams, Nikita Nangia, and Samuel Bowman. 2018. A broad-coverage challenge corpus for sentence understanding through inference. In Proceedings of the 2018 Conference of the North American Chapter of the Association for Computational Linguistics: Human Language Technologies, Volume 1 (Long Papers), pages 1112–1122. Association for Computational Linguistics.
- Wolf et al. (2020) Thomas Wolf, Lysandre Debut, Victor Sanh, Julien Chaumond, Clement Delangue, Anthony Moi, Pierric Cistac, Tim Rault, Rémi Louf, Morgan Funtowicz, Joe Davison, Sam Shleifer, Patrick von Platen, Clara Ma, Yacine Jernite, Julien Plu, Canwen Xu, Teven Le Scao, Sylvain Gugger, Mariama Drame, Quentin Lhoest, and Alexander M. Rush. 2020. Transformers: State-of-the-art natural language processing. In Proceedings of the 2020 Conference on Empirical Methods in Natural Language Processing: System Demonstrations, pages 38–45, Online. Association for Computational Linguistics.
- Xue (2019) Kang Xue. 2019. Computational diagnostic classification model using deep feedforward network based semi-supervised learning. In 25th ACM SIGKDD Conference on Knowledge Discovery and Data Mining (KDD) Workshop on Deep Learning for Education.
- Yang et al. (2019) Zhilin Yang, Zihang Dai, Yiming Yang, Jaime G. Carbonell, Ruslan Salakhutdinov, and Quoc V. Le. 2019. Xlnet: Generalized autoregressive pretraining for language understanding. In Advances in Neural Information Processing Systems, volume 32, pages 5753–5763.
- Zhou et al. (2020) Xuhui Zhou, Yue Zhang, Leyang Cui, and Dandan Huang. 2020. Evaluating commonsense in pre-trained language models. In Proceedings of the AAAI Conference on Artificial Intelligence, volume 34, pages 9733–9740.
Appendix A Additional Details on Language Model Experiments
To create the subset of the GLUE diagnostic, there were three cases where we needed to merge members of one sub-category into another to prevent overlap:
-
1.
negation and double negation questions were merged into morphological negation.
-
2.
symmetry/collectivity was merged into core arguments.
-
3.
Questions in both world knowledge and named entities were merged into named entities.
Each of these was cases where the sub-categories overlapped highly. For a full listing of the sub-categories and their descriptions, see Wang et al. (2018). We experimented with multiple different snapshots of each TLM, which differed in the number of trainable parameters. We obtained these snapshots from HuggingFace.131313https://huggingface.co/models For each model we used a smaller version, designated with the small or base suffix, and a larger version, designated with the base or large suffix. For example, for BERT we experimented with both bert-base and bert-large, where bert-large had more trainable parameters. For ALBERT, we used the base and xxlarge versions.
For the LSTMs, we used a PyTorch implementation designed specifically for NLI.141414https://github.com/pytorch/examples/tree/master/snli We initialized the LSTM-based LMs with GloVe word embeddings (Pennington et al., 2014). We ran a non-exhaustive grid search to generate a population of LSTMs, changing the number of recurrent layers, size of the hidden layers, learning rate, and dropout (Srivastava et al., 2014) probability.
Appendix B Human Study Details
We paid workers the following amount for each phase:
-
•
On-boarding: $0.50
-
•
Phase 1: $3.60
-
•
Phase 2: $7.20
-
•
Phase 3: $7.20
-
•
Phase 4: $7.20
Our payment structure was designed to incentivize workers to put forth their best effort when completing the task. Workers were informed that successfully completing each task would award them the opportunity to earn additional payment on each subsequent phase. However, if on a given phase a worker failed our authentication protocol we rejected their work and did not pay them. Workers were informed before starting every study that we would evaluate the quality of their work, and that it might be rejected if we found evidence that they did not put forth an honest effort.