The Angular Correlations in the Decay of Excited States in 8Be
Abstract
Motivated by the recent observation of anomalous electron-positron angular correlations in the decay of the 18.15 MeV 1+ excited states in 8Be, we reexamine in detail the Standard Model expectations for these angular correlations. The 18.15 MeV state is above particle threshold, and several multipoles can contribute to its decay. We present the general theoretical expressions for angular distributions for nuclear decay by C0, C1, C2 M1, E1, and E2 multipoles, and we examine their relative contribution to the decay of 8Be at 18.15 MeV. We find that this resonance is dominated by M1 and E1 decay, and that the ratio of M1 to E1 strength is a strong function of energy. This is in contract to the original analysis of the angular distributions, where the M1/E1 ratio was assumed to be a constant over the energy region MeV. We find that the existence of a ‘bump’ in the measured angular distribution is strongly dependent on the assumed M1/E1 ratio, with the present analysis finding the measured large-angle contributions to the angular distribution to be lower than expectation. Thus, in the current analysis we find no evidence for axion decay in the 18.15 MeV resonance region of 8Be.
I Introduction
Recently, an anomaly has been observed anomaly in the electron-positron pair decay of an M1 resonance in 8Be. In particular, the observed angle between the emitted and pair in the transition of the 18.15 MeV 1+ resonance to the ground state of 8Be deviated significantly from expectation, and shows a so-called bump or shoulder at angles greater than 110∘. The experiment anomaly populated resonances in 8Be via the 7Li+p reaction and observed their decay by detecting pairs. Many multipoles can contribute to the observed pair decay with the particular linear combination being determined by the nuclear structure of the 8Be continuum at each incident proton energy. Interference between multipoles can also occur. In this experiment, the detectors were set at 90∘ to the incident beam, which tends to minimize the effects of interference. For this reason, we believe the interference effects are small but we could not reliably estimate them without a simulation of the experimental setup and detector responses. If the detector resolution and efficiency are symmetric about 90∘ to the incident beam and sufficient statistics are collected the only effect creating interference between the various multipoles decaying to the ground state would be due to motion of the center of mass of the pair.
II Formalism for angular distributions
The process is a mechanism in which the nucleus emits a virtual photon which then decays to an pair. The process is exactly analogous to electron scattering, but with the incident electron of momentum in the scattering being substituted by the outgoing positron in the decay: the momentum of the positron becomes . If the 3-momentum of the emitted electron is , the momentum transfer is and . Thus, our convention is that is directed into the nucleus. We also ignore Coulomb effects and treat the lepton wave functions as plane waves.
For energies that allow a non-relativistic treatment of the nuclear physics, the decay by a single nuclear state is determined by the momentum- and nuclear-structure-dependent electromagnetic charge and current operators, whose separate contributions are described throughout this work by the structure functions and , respectively.
The first function, , is defined in terms of matrix elements of the nuclear charge operator as
| (1) |
where and is the nuclear charge density. The overscore on the summation sign in eq. (1) means average over initial nuclear spin projections ( and sum over final ones . We assume that there is no initial-state or target polarization involved.
When expanded in spherical harmonics, the charge operator becomes,
| (2) |
where the normal-parity () charge multipole operator is given by
| (3) |
We follow a standard, but not universal, notation that denotes charge multipoles by CJ, (i.e., C0, C1, C2, etc.). Thus the charge multipoles are distinguished from current multipoles, both electric (E1, E2, etc.) and magnetic (M1, M2, etc.). In the limit of small , current conservation mandates that the EJ are proportional to CJ (for ), which is known as Siegert’s Theorem. Only C0 is unique in origin via the charge operator and does not contribute to real photon decay.
The second function, T, is determined by the nuclear current . Expanding the exponential in and using the character of the current, leads to the requisite operators,
| (4) |
Only contributes to T⟂⟂ and we find,
| (5) |
The first set of matrix elements in eq. (5) produces electric (EJ) transitions and the second produces magnetic (MJ) transitions, with in both cases.
If we denote the decay rate by , we find that the general form of the angular distribution is given by
| (6) |
We denote the angle between the electron and positron by , and will use =cos(. Our dimensionless kinematic variable is similar to that defined in ref. anomaly , , where is the total energy of the transition, and can lie between -(1-) and 1-; the difference in definitions is discussed in footnote 111In ref. anomaly , where is the sum of the lepton kinetic energies. This difference in definitions has no practical implications.. In eq. (6) the kinematic functions Friar3 and are given by
| (7) |
and
| (8) |
We summarize in Table 1 the definition of the kinematic variables appearing in eq. (8).
.
II.1 angular distributions for individual multipoles
The functions and T in given in terms of reduced nuclear matrix elements. We restrict our discussion to four electromagnetic multipoles, namely, scalar, vector, pseudoscalar, and tensor, or equivalently: C0, E1, M1 and E2. We expand and T in and keep only leading-order terms. Using the definition of in eqs. (2) and (3), and expanding the Bessel functions produces,
| (9) |
The terms on the right hand size of (9) determine the C0 (), E1 (), and E2 () transition rates via 3 nuclear-structure constants, , and , which are the squared reduced monopole, dipole and quadrupole matrix elements, respectively.
The transverse-current structure function, , can be determined in a similar fashion. Expanding the spherical Bessel functions n eq. (4) results in magnetic dipole (), electric dipole () and electric quadrupole () contributions:
| (10) |
The structure constant is the square of the reduced magnetic dipole matrix element. The proportionality of the and the for small (viz., Siegert’s Theorem) was used. Of the four terms that remain (proportional to ) we keep the two ( and ) that have kinematic coefficients that are dimensionally equivalent to , and ignore the higher-order terms, in common with other discussions.
II.2 Relation to the photon decay rate
The transition strength from the resonances of 8Be to the ground state can be constrained by the corresponding photon transition strength, as was done by Rose rose , who calculated the leading-order decay rate “per photon.” We have verified his results. In the case of -decay with an outgoing photon of momentum in the final state, the decay rate, , is given by
| (11) |
Thus the squared matrix elements , , and entering the rates can, in principle, be extracted from measured -decay rates. Combining equations (10) and (11) gives,
| (12) |
The squared E0 matrix element, , must be determined by other means, if needed. We will require only and .
III Analysis of the photon decay data for 8Be from the 7Li reaction
The -decays of the 8Be resonances of interest have been measured via the analogous 7Li reaction; the integrated cross section has been measured by Zahnow et al. Zahnow and the excitation function by Fisher et al. Fisher . The angular distributions for the emitted photons have been measured by Mainsbridge Mainsbridge and by Schlueter et al. Schlueter . The resonance energy range of interest is entirely dominated by E1 and M1 photon decay, and we used the measured cross sections and shape of the angular distributions in an R-matrix analysis to determine the magnitude of the M1 and E1 contributions to the cross section as a function of energy.
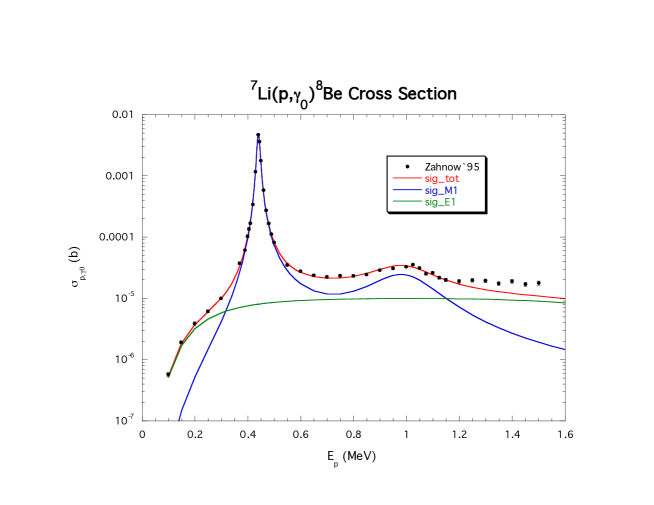
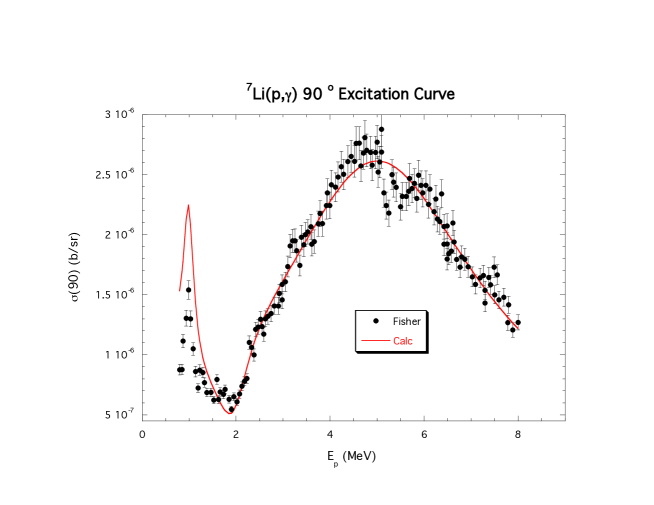
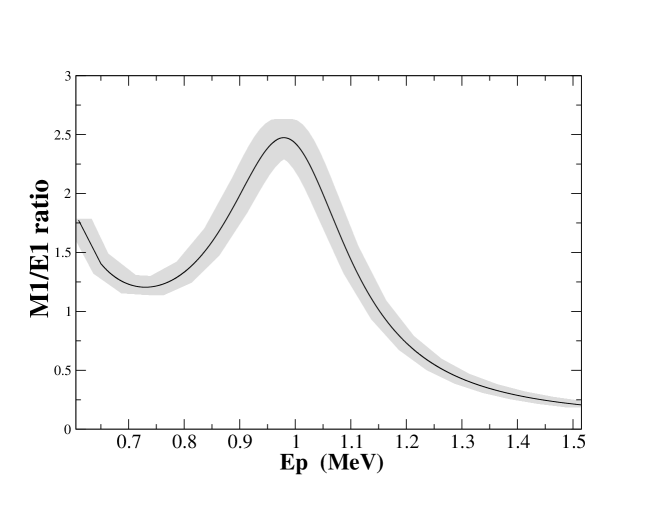
The R-matrix fit to ) cross section data of Zahnow et al. is shown in Fig. 1. We find that over the resonance centered at 18.15 MeV ( MeV) the combination of M1 and E1 multipole strengths contributing to the reaction, and hence to the reaction, varies strongly with energy. This is because the M1 strength corresponds to a narrow (1386 keV) resonance centered at (=1.03) MeV, whereas the E1 strength comes from the tail of the broad electric dipole structure centered close to MeV. This E1 structure is evident in the data of Fisher et al., Fig. 2. The prediction of a significant and broad direct -wave E1 capture to the 7Li() and 7Li() reactions near Ep=5 MeV is consistent with the analysis of Barker barker . The ratio of M1 to E1 strength, together with its (shaded) 1-sigma uncertainty, is shown in Fig. 3. That uncertainty was obtained by scaling the from the R-matrix analysis to 1.0 while increasing error bars appropriately. Our analysis yields a very different energy dependence to the M1/E1 ratio than that assumed in ref. anomaly , where a constant distribution of M1+0.23E1 was assumed over the energy region MeV. However, the large differences in widths of the M1 and E1 resonances rule out the possibility of the M1/E1 ratio being a constant. As discussed below, this strong energy-dependent variation in the M1 and E1 contributions to the and reactions has significant implications for any axion search close to the =1.03 MeV resonance in 8Be.
The R-matrix analysis over-estimates the 90o excitation function in the region of the 18.15 MeV resonance, which may reflect an over-estimate of the M1 strength in this region. However, the problem arises because the Zahnow and Fisher data sets are not consistent with one another at this energy. This can be understood by the following considerations: If the angular distributions are described by a Legendre polynomial expansion up through order , then the ratio of the 90∘ to the integrated cross section is determined by,
| (13) |
in terms of the Legendre coefficients . The maximum value of is obtained when only the transition Li)Be) is allowed, in which case the ratio has the value . The presence of any other transition in the capture reaction, and in particular an E1 transition, dilutes this ratio so that , meaning that the minimum value of is 0.75. The value of obtained from the R-matrix fit is , reflecting the non-negligible amount of E1 cross section that contributes near the 1-MeV resonance (see Fig. 1). However, using the experimental values of the cross sections near 1 MeV from Fisher and Zahnow gives , which is well below the minimum possible value of , and inconsistent with the calculated value within the uncertainties. Therefore, either the 90∘ cross section of Fisher is low, or the integrated cross section of Zahnow is high, at these energies. Given that Zahnow’s measurement covers the range of both (mostly) M1 resonances continuously, and it was done with five times better energy resolution than that of Fisher’s, we tend to favor the explanation that the Fisher measurement is low in the peak of the 1-MeV resonance (see Fig. 2).
IV The electron-positron angular distributions
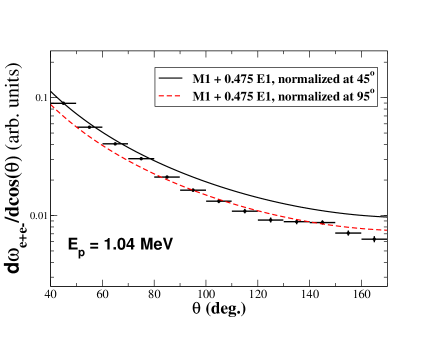
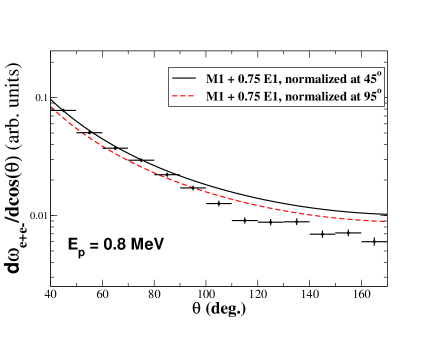
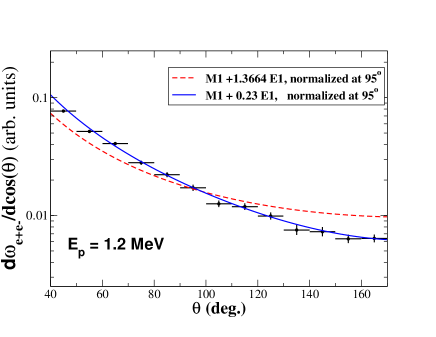
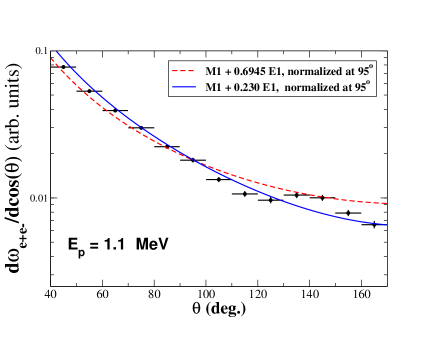
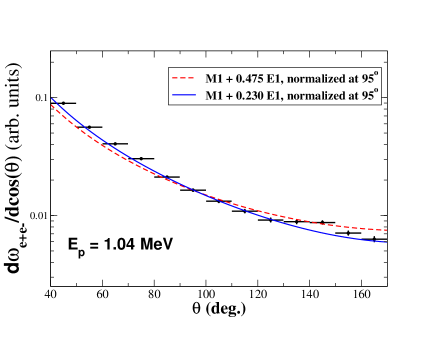
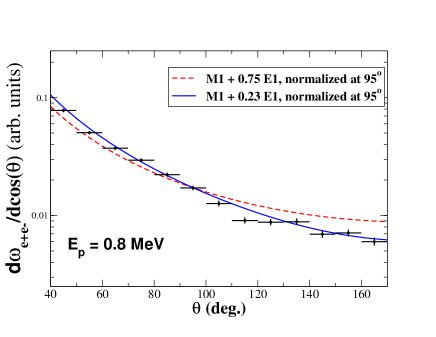
The angular distribution can now be calculated by numerically integrating eq. (6) with respect to the variable . To be consistent with ref. anomaly , we take the limits of integration to be , where , and and are the kinetic energies of the positron and electron. We find reasonably good agreement with the measured anomaly angular distribution for the 6.05 MeV state in 16O and the 1+ resonance in 8Be excited by protons of energy MeV, but not for the 1+ resonance excited by proton energies between MeV. The results for the latter resonance are shown in Fig. 4, where they are compared with the measured angular distributions of anomaly . At each proton energy the M1/E1 ratio is taken from our R-matrix analysis. We find that the measured angular distributions fall off faster that the theoretical predictions at large angles for proton energies between . This effect reflects the fact that the pure M1 angular distribution falls off faster at large angles that does the pure E1 angular distribution, and that the current analysis predicts considerably more E1 strength contributing to the resonance that that assumed in anomaly . The lowest E1/M1 ratio in the proton energy range MeV region is found to be 0.4. As a result, the bumps observed in the experimental angular distributions fall below the Standard Model nuclear physics predictions. In this sense, the current analysis does not support the measured angular distribution being interpreted as evidence for the decay of a new axion particle.
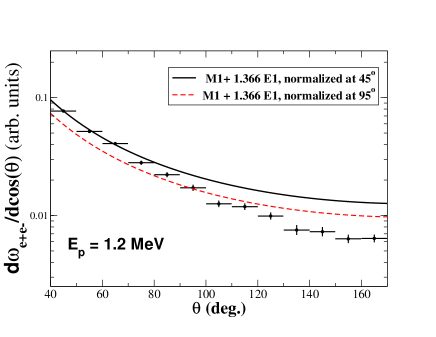
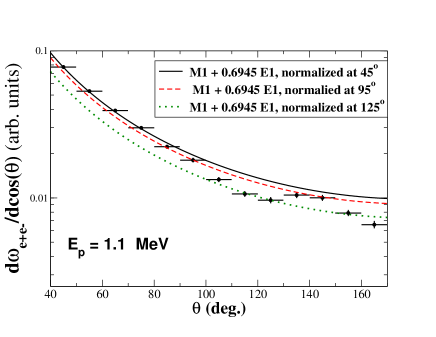
Finally, in Fig. 5 we compare the measured angular distributions with the M1/E1 ratio assumed in ref. anomaly , i.e. a constant ratio of M1+0.23E1. Under this assumption, the angular distributions at MeV and 1.1 MeV do show a bump above the expected angular distributions. Thus, we conclude that the evidence of a new axion particle being emitted from the 18.15 MeV resonance in 8Be seems to be strongly dependent on the assumptions made about the nuclear structure of this resonance.
V conclusion
We have derived expressions for angular correlations for nuclear decay by decay, that are completely consistent with earlier expressions derived by Rose rose . To establish the appropriate combination of multipoles that apply in the region of the 18.15, 1+ MeV resonance in 8Be we carried out an R-matrix analysis of the available cross sections and angular distributions for the 7Li reaction. We find that the resonance region is entirely dominated by the M1 and E1 multipoles, but that the M1 to E1 ratio varies significantly with energy, being a maximum of M1+0.455 E1 at the peak of the resonance (Ep=1.03 MeV) and dropping to where E1 dominates over M1 above Ep = 1.16 MeV. This is in strong contrast to the assumptions of ref. anomaly , that assumed a constant value of M1+0.23 E1 over the range Ep = 0.8 -1.2 MeV.
The existence of a ‘bump’ in the angular correlations at large opening angle is found to be strongly dependent on the assumptions made about the M1/E1 ratio in the energy interval associated with the Ep=1.03 MeV 1+ resonance. The current analysis indicates that the measured angular correlations fall off too rapidly with angle, falling below the R-matrix expectations at angles greater than 100∘. In contrast, the nuclear structure assumptions made in the analysis applied in ref. anomaly would require the measured angular distributions at resonance to fall even more rapidly, creating the surplus events at large angles thus providing evidence for a new axion-like particle. At the least, a detailed re-measurement of the energy dependence of the M1 and E1 yields in the reaction in this energy range would be needed before the unexpected observation of non-Standard Model particle should be claimed.
References
- (1) A. J. Krasznahorkay, M. Csatlos, L. Csige, Z. Gacsi, J. Gulyas, M. Hunyadi, I. Kuti, B. M. Nyako, L. Stuhl, J. Timar, T. G. Tornyi, Zs. Vajta, T. J. Ketel, A. Krasznahorkay, Phys. Rev. Lett. 116, 042501 (2016).
- (2) J .L. Friar, Ann. Phys. (N.Y.) 95, 170 (1975). See pp. 195-197.
- (3) D. Zahnow, C. Angulo, C. Rolfs, S. Schmidt, W. H. Schult, E. Somorjai, Z. Phys. A 351, 229 (1995).
- (4) G. A. Fisher, P. Paul, F. Riess, and S. S. Hanna, Phys. Rev. C 14, 28 (1976).
- (5) B. Mainsbridge, Nuclear Physics 21, 1 (1960).
- (6) D. J. Schlueter, R. W. Krone and F. W. Prosser, Nuclear Physics 58, 254 (1964).
- (7) Taken from the TUNL Nuclear Data Base: http://tunl.duke.edu
- (8) F. C. Barker, Aust. J. Phys 49, 1081 (1996).
- (9) M. E. Rose, Phys. Rev. 76, 678 (1949). This paper separately calculates for each electric and magnetic multipole in the limit of small , and the nuclear matrix element cancels in the ratio. Note that his energies are all divided by the electron rest energy.