Pay Attention with Focus: A Novel Learning Scheme for Classification of Whole Slide Images
Abstract
Deep learning methods such as convolutional neural networks (CNNs) are difficult to directly utilize to analyze whole slide images (WSIs) due to the large image dimensions. We overcome this limitation by proposing a novel two-stage approach. First, we extract a set of representative patches (called mosaic) from a WSI. Each patch of a mosaic is encoded to a feature vector using a deep network. The feature extractor model is fine-tuned using hierarchical target labels of WSIs, i.e., anatomic site and primary diagnosis. In the second stage, a set of encoded patch-level features from a WSI is used to compute the primary diagnosis probability through the proposed Pay Attention with Focus scheme, an attention-weighted averaging of predicted probabilities for all patches of a mosaic modulated by a trainable focal factor. Experimental results show that the proposed model can be robust, and effective for the classification of WSIs.
Keywords:
Whole Slide Image, Classification, Multi-Instance Learning1 Introduction
The success of deep learning has opened promising horizons for digital pathology. AI experts and pathologists are now working together to design novel image analysis algorithms. The last decade has witnessed the widespread adoption of digital pathology, leading to the emergence of machine learning (ML) models for analyzing whole slide images (WSIs). The major applications of ML in digital pathology include (i) reducing the workload on pathologists, and (ii) improving cancer treatment procedures [17]. The computational analysis of WSIs offers various challenges in terms of image size and complexity. These challenges necessitate the inquiry into more effective ways of analyzing WSIs. CNNs are at the forefront of computer vision, showcasing significant improvements over conventional methodologies for visual understanding [14]. However, CNNs can not be directly utilized for processing WSIs due to their large image dimensions. The majority of the recent work analyzes WSIs at the patch level that requires manual delineations from experts. These manual delineations reduce the feasibility of such approaches for real-world scenarios. Moreover, most of the time, labels are available for an entire WSI and not for individual patches [2]. Therefore, to learn a WSI representation, it is necessary to leverage the information present in all patches. Hence, multiple instance learning (MIL) is a promising venue for vision-related tasks for WSIs.
The paper’s contribution is three-fold (i) we propose a novel attention-based MIL approach for the classification of WSIs, (ii) we fine-tune a feature extractor model using multiple and hierarchically arranged target labels of WSIs, and (iii) we present insights of the model’s decision making by visualizing attention values. The method is tested on two large-scale datasets derived from The Cancer Genomic Atlas (TCGA) repository provided by NIH [23].
2 Background
CNN based methods for analyzing histopathological images is well represented in the literature [5, 4, 18, 6]. Deep learning methods generalize well across patients, disease conditions, and are robust to the vendor or human-induced variations, especially when a large amount of training data is available [5].
A WSI usually contains at least two target labels, anatomic site, and primary diagnosis that are arranged in a hierarchy. The simplest way to deal with multi-label classification with labels is to treat this as independent binary classification. Although this approach may be helpful, it does not capture label dependencies. This limitation can degrade the performance in many applications where there is strong dependency among labels, for example, in WSI classification. To address this limitation, two different approaches, i.e., transformation and algorithm adaption methods, have been proposed [27]. In transformation-based methods, multi-label data is converted to new single label data to apply regular single-label classification. On the other hand, in the adaptation-based category, this is attempted to modify the basic single-label algorithm to handle multi-label data [21].
There are two main methods for characterizing WSIs [3]. The first method is called sub-setting, which considers a small section of a large WSI as an essential region for analysis. On the other hand, the tiling method, segments a WSI into smaller and controllable patches (i.e., tiles) [8]. The tiling or patch-based methods can benefit from MIL. Isle et al. used MIL for digital pathology and introduces a different variety of MIL pooling functions [10]. Sudarshan et al. used MIL for histopathological breast cancer image classification [20]. Permutation invariant operator for MIL was introduced by Tomczak et al. for WSIs processing [22]. Graph neural networks (GNNs) have also been used for MIL applications because of their permutation invariant characteristics [2].
3 Method
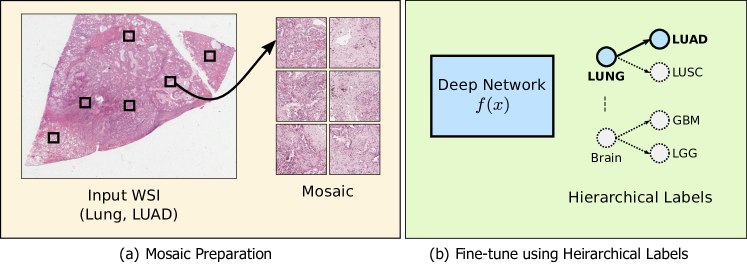
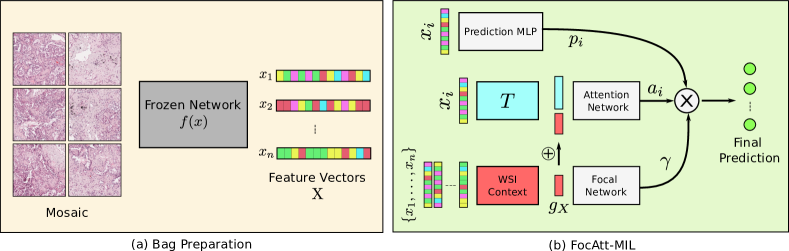
There are two stages in the proposed method (i) bag preparation, and (ii) multi-instance learning with FocAtt-MIL. In the first stage, representative patches (called mosaic) are extracted from a WSI. The mosaic’s patches are encoded to a set of feature vectors (called bag) using a deep network. The feature extraction model can be a pre-trained network, or can be fined-tuned to increase its effectiveness as shown in Figure 1. In the second stage, the proposed MIL technique (called FocAtt-MIL) is trained to predict the primary diagnosis for a given bag (a WSI). The schematic for the second stage is shown in Figure 2.
Bag Preparation. A patch selection method proposed by Kalra et al. [13] is used to extract the representative patches from a WSI. We removed non-tissue regions using colour threshold. The remaining tissue-containing patches are grouped into a pre-set number of categories through a clustering algorithm. A portion of all clustered patches (e.g., 10%) are randomly selected within each cluster, yielding a mosaic. The mosaic is transformed into a bag , where is the feature vector of patch, obtained through a deep network (a feature extractor). The Figure 2 shows the bag preparation stage, the frozen network represents a non-trainable deep network used as a feature extractor.
Fine-tune a Feature Extractor using Hierarchical Labels. In MIL, robust features enable weak learners to make better predictions thus improving the final aggregated prediction. A WSI is generally associated with the following two labels—anatomic site and primary diagnosis. These two labels are arranged in hierarchy as shown in Figure 1. Consider, and represent anatomic site and primary diagnosis respectively. Then, instead of predicting these labels independently, we predict , and . The conditional probability helps in modelling the dependent relationship. Using Bayes theorem, we get, , where , because of the dependence. We simplify , and compute cross entropy losses for the predictions of both and . We equally weight both the losses towards the final loss of the network.
WSI Context Learning. A single vector representation of a WSI (or a bag ) is computed as,
| (1) |
where, is a neural network and is a pooling function, such as sum, mean, and max. It has been proven in [25] that (1) can approximate any set function. The vector is used by the attention module and the focal network.
The FocAtt-MIL Approach. The FocAtt-MIL is a permutation-invariant model that learns to predict a target label (primary diagnosis) from a bag (a WSI). The approach is composed of four major components (Figure 2):
-
1.
Prediction MLP. A prediction is computed for each item in the bag , using a trainable deep network called Prediction MLP.
-
2.
WSI Context. It a deep network that computes a single vector representing an entire bag using (1).
-
3.
Attention Module. The attention module is composed of two networks, a transformation network , and the Attention Network. The attention module takes the patch , and the WSI context to compute an attention value for that patch.
-
4.
Focal Network. Another deep network that uses WSI context to compute a focal factor (a vector) that modulates the final prediction. The length of is same as the number of discrete values in the target label, thus allowing the per dimension modulation.
The Final Prediction. The final output from the FocAtt-MIL is computed by aggregating individual attention-weighted predictions modulated by the learned focal factor, as follows
| (2) |
The , and in (2) are both vectors. The is converted to a probability distribution by dividing with .
4 Results
We evaluated the proposed approach for two different WSI classification tasks. All experiments are conducted with 4 Nvidia V100 GPUs (32 GB vRAM each). The code has been written using the Tensorflow library [1].
| Algorithm | Accuracy |
|---|---|
| Coudray et al. [4] | 0.85 |
| Kalra & Adnan et al. [11] | 0.85 |
| Khosravi et al. [15] | 0.83 |
| Yu et al. [24] | 0.75 |
| FocAtt-MIL (proposed method) | 0.88 |
LUAD vs LUSC Classification – Lung Adenocarcinoma (LUAD) and Lung Squamous Cell Carcinoma (LUSC) are two main subtypes of non-small cell lung cancer (NSCLC) that account for 65-70% of all lung cancers [26]. An automated classification of these two main sub-types of NSCLC is a crucial step to assist pathologists [7, 26]. For this task, we establish the efficacy of FocAtt-MIL to differentiate between LUAD and LUSC. We obtained 2,580 hematoxylin and eosin (H&E) stained WSIs of lung cancer from TCGA repository [23]. The data is split into 1,806 training, and 774 testing WSIs [11]. The dataset is approximately 2 TB. We obtained mosaic for each WSI using the approach in [13], and subsequently converted the mosaic to a bag of features using a pre-trained DenseNet [9]. We did not fine-tune the feature extraction model for this task in order have a fair comparison against other transfer-learning based approaches in the literature. We trained the FocAtt-MIL to classify bags between the two sub-types of lung cancer. We achieved the accuracy of 88% on test WSIs (AUC of 0.92). The accuracy has been reported in Table 1.
We conducted an ablation study to understand the effect of different model parameters. Removing the WSI context from the attention module, resulted in 4% reduction of the accuracy. Excluding the focal factor and the global context from the final prediction, resulted in 6% reduction in the accuracy. The ablation suggests that the model’s performance is the most optimal by (i) incorporating the WSI context in the attention computation, and (ii) allowing the focal factor to modulate the final aggregated prediction.
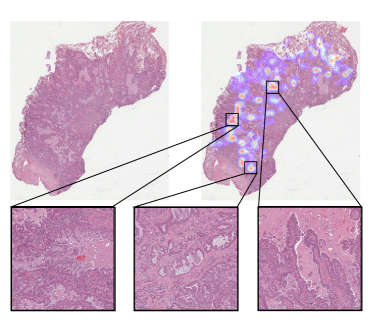
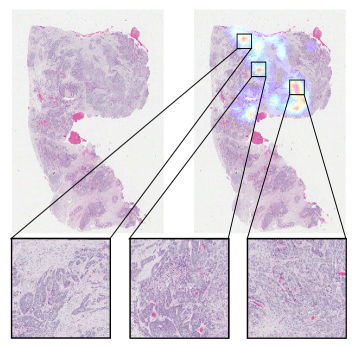
We used the attention module of the trained model to visualize the attention heat-map on the unseen WSIs (Figure 3). The visual inspection of these two WSIs reveals that the model made its decision based on regions containing malignant tissue and ignored non-cancerous regions. In the LUSC WSI (right), regions with squamous formations are deemed the most important ones. For the LUAD WSI (left), the salient regions are solely coming from the malignant area, implying that the model differentiates between normal lung alveolar tissue and LUAD. Therefore, one could say that attention heatmaps are histopathologically meaningful. For LUAD samples, regions where cancerous tissue meets non-cancerous structures are deemed the most important. Such contrast makes cancerous glandular structures easier to recognize. However, this phenomenon cannot be seen in LUSC samples, as the model is responsive to regions that are completely composed of malignant squamous carcinoma.
Pan-cancer Analysis – In the second experiment series, we evaluated the approach against a large-scale pan-cancer classification of WSIs. The dataset used for this task has been proposed by Riasatian et al. [19]. It comprises more than 7 TB data, consisting of 7,097 training, and 744 test WSIs, distributed across 24 different anatomic sites, and 30 different primary diagnoses. All WSIs in the dataset are taken from a public repository of WSIs, TCGA [23]. We obtained a mosaic for each WSI, and then applied a cellularity filter [19] to further reduce the number of patches in each mosaic. Subsequently, we obtained 242,202 patches for training WSIs and 116,088 patches for testing WSIs. Each patch is of the size 10001000, but we resized them to 256256 pixels.
We used three different feature extractors to validate the FocAtt-MIL. We prepared a separate “bag” for each feature extractor. These three feature extractors are: DenseNet (DN) [9], KimiaNet [19], and the fine-tuned DenseNet (FDN). We fined-tuned the DenseNet on training patches using weak labels obtained from their respective WSIs. The weakly labelled fine-tuning has shown to be effective [19]. In our case, the weak labels are anatomic site, and primary diagnosis, arranged in a hierarchy. This hierarchical arrangement of labels is incorporated during the training using the approach outlined earlier in the Section 3. For the fine-tuning, we used Adam optimizer [16] and a learning rate of were used for 20 epochs.
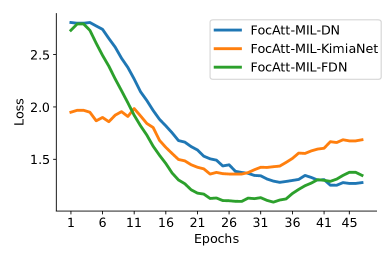
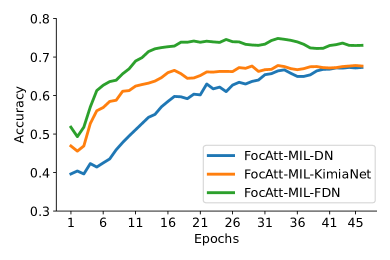
We trained the FocAtt-MIL model with the same architecture for all the three different bags. We tested three different configurations of FocAtt-MIL, i.e., FocAtt-MIL-DN, FocAtt-MIL-KimiaNet, and FocAtt-MIL-FDN. For all the three configurations, we used the SGD optimizer with a learning rate of 0.01, weight decay of 10-6, and momentum of 0.9. We applied gradient clipping of 0.01 and dropout between layers to prevent the exploding gradients. We trained models for 45 epochs. Figure 4 shows the validation loss and accuracy while training the three different configurations. It is evident that FocAtt-MIL-FDN is outperforming from the very early epochs. It is interesting to note that, both FocAtt-MIL-FDN, and FocAtt-MIL-KimiaNet (feature extractors specialized for histopathology) seems to have converged to an optimal validation accuracy around 20-25 epochs.
The 30 unique primary diagnoses in the dataset can be further grouped into 13 tumor types. The type of tumour is generally known at the inference time, and the objective is to predict the cancer sub-type. To validate the efficacy of our model, we computed the cancer sub-type classification (i.e., primary diagnosis) accuracy for the given tumour type. This type of classification is called vertical classification. The vertical classification results are reported in Table 2111For abbreviations GBM, LGG, ACC,…, see wiki.cancerimagingarchive.net. The results show that FocAtt-MIL can elevate the accuracy of pre-trained features; DenseNet features have shown to under-perform compared to KimiaNet features [19, 12]. However, within the proposed FocAtt-MIL scheme, DenseNet features become quite competitive. This applies to the fine-tuned DenseNet (FocAtt-MIL-FDN) as well, whose results are on par with the highly customized KimiaNet features when used within the FocAtt-MIL framework.
| Tumor Type | Primary Diagnosis | FocatAtt-MIL-DN | FocAtt-MIL-KimiaNet | FocAtt-MIL-FDN |
|---|---|---|---|---|
| Brain | GBM | 0.9714 | 0.9429 | 0.8571 |
| LGG | 0.6410 | 0.7692 | 0.8205 | |
| Endocrine | ACC | 0.6667 | 0.6667 | 0.6667 |
| PCPG | 1.0000 | 1.0000 | 1.0000 | |
| THCA | 0.9608 | 1.0000 | 1.0000 | |
| Gastrointestinal tract | COAD | 0.6875 | 0.4375 | 0.5000 |
| ESCA | 0.5000 | 0.8571 | 0.5714 | |
| READ | 0.0833 | 0.5000 | 0.6667 | |
| STAD | 0.8333 | 0.7333 | 0.8333 | |
| Gynaecological | CESC | 0.8824 | 0.9412 | 0.7647 |
| OV | 0.5000 | 0.8000 | 1.0000 | |
| UCS | 0.6667 | 1.0000 | 0.3333 | |
| Liver, pancreaticobiliary | CHOL | 0.2500 | 0.0000 | 0.5000 |
| LIHC | 0.8857 | 0.9143 | 0.8571 | |
| PAAD | 1.0000 | 0.7500 | 0.8333 | |
| Melanocytic malignancies | SKCM | 0.9167 | 0.8750 | 0.9167 |
| UVM | 1.0000 | 0.2500 | 1.0000 | |
| Prostate/testis | PRAD | 1.0000 | 0.9500 | 1.0000 |
| TGCT | 1.0000 | 1.0000 | 1.0000 | |
| Pulmonary | LUAD | 0.5789 | 0.8158 | 0.8947 |
| LUSC | 0.9302 | 0.6977 | 0.7442 | |
| MESO | 0.6000 | 1.0000 | 1.0000 | |
| Urinary tract | BLCA | 0.9118 | 1.0000 | 0.8529 |
| KICH | 0.5455 | 0.6364 | 0.7273 | |
| KIRC | 0.9200 | 0.9000 | 0.9600 | |
| KIRP | 0.5714 | 0.6786 | 0.7143 |
Conclusions – The accelerated adoption of digital pathology offers a historic opportunity to find novel solutions for major challenges in diagnostic histopathology. In this study, we proposed a novel attention-based MIL technique for the classification of WSIs. We introduced a focal factor, computed using a global representation of WSI for modulating the individual patch-level prediction, thus promoting more accurate aggregated final prediction. We also proposed a novel fine-tuning approach to extract more robust features from WSI patches. We fine-tune a feature extraction model using patches and the hierarchical weak labels from their respective WSIs. We validated the proposed framework on two large datasets derived from TCGA repository [23]. The results suggest competitive performance on both the datasets. Furthermore, the proposed method is explainable and transparent as we utilized the attention values to visualize important regions.
References
- [1] Abadi, M., Barham, P., Chen, J., Chen, Z., Davis, A., Dean, J., Devin, M., Ghemawat, S., Irving, G., Isard, M., et al.: Tensorflow: A system for large-scale machine learning. In: 12th USENIX symposium on operating systems design and implementation (OSDI 16). pp. 265–283 (2016)
- [2] Adnan, M., Kalra, S., Tizhoosh, H.R.: Representation learning of histopathology images using graph neural networks. In: Proceedings of the IEEE/CVF Conference on Computer Vision and Pattern Recognition Workshops. pp. 988–989 (2020)
- [3] Barker, J., Hoogi, A., Depeursinge, A., Rubin, D.L.: Automated classification of brain tumor type in whole-slide digital pathology images using local representative tiles. Medical image analysis 30, 60–71 (2016)
- [4] Coudray, N., Ocampo, P.S., Sakellaropoulos, T., Narula, N., Snuderl, M., Fenyö, D., Moreira, A.L., Razavian, N., Tsirigos, A.: Classification and mutation prediction from non–small cell lung cancer histopathology images using deep learning. Nature medicine 24(10), 1559–1567 (2018)
- [5] Dimitriou, N., Arandjelović, O., Caie, P.D.: Deep learning for whole slide image analysis: an overview. Frontiers in medicine 6, 264 (2019)
- [6] Gao, F., Wu, T., Li, J., Zheng, B., Ruan, L., Shang, D., Patel, B.: Sd-cnn: A shallow-deep cnn for improved breast cancer diagnosis. Computerized Medical Imaging and Graphics 70, 53–62 (2018)
- [7] Graham, S., Shaban, M., Qaiser, T., Koohbanani, N.A., Khurram, S.A., Rajpoot, N.: Classification of lung cancer histology images using patch-level summary statistics. In: Medical Imaging 2018: Digital Pathology. vol. 10581, p. 1058119. International Society for Optics and Photonics (2018)
- [8] Gutman, D.A., Cobb, J., Somanna, D., Park, Y., Wang, F., Kurc, T., Saltz, J.H., Brat, D.J., Cooper, L.A., Kong, J.: Cancer digital slide archive: an informatics resource to support integrated in silico analysis of tcga pathology data. Journal of the American Medical Informatics Association 20(6), 1091–1098 (2013)
- [9] Huang, G., Liu, Z., Van Der Maaten, L., Weinberger, K.Q.: Densely connected convolutional networks. In: Proceedings of the IEEE conference on computer vision and pattern recognition. pp. 4700–4708 (2017)
- [10] Ilse, M., Tomczak, J.M., Welling, M.: Deep multiple instance learning for digital histopathology. In: Handbook of Medical Image Computing and Computer Assisted Intervention, pp. 521–546. Elsevier (2020)
- [11] Kalra, S., Adnan, M., Taylor, G., Tizhoosh, H.R.: Learning permutation invariant representations using memory networks. In: European Conference on Computer Vision. pp. 677–693. Springer (2020)
- [12] Kalra, S., Tizhoosh, H.R., Shah, S., Choi, C., Damaskinos, S., Safarpoor, A., Shafiei, S., Babaie, M., Diamandis, P., Campbell, C.J., et al.: Pan-cancer diagnostic consensus through searching archival histopathology images using artificial intelligence. NPJ digital medicine 3(1), 1–15 (2020)
- [13] Kalra, S., Tizhoosh, H., Choi, C., Shah, S., Diamandis, P., Campbell, C.J., Pantanowitz, L.: Yottixel–an image search engine for large archives of histopathology whole slide images. Medical Image Analysis 65, 101757 (2020)
- [14] Khan, A., Sohail, A., Zahoora, U., Qureshi, A.S.: A survey of the recent architectures of deep convolutional neural networks. Artificial Intelligence Review 53(8), 5455–5516 (2020)
- [15] Khosravi, P., Kazemi, E., Imielinski, M., Elemento, O., Hajirasouliha, I.: Deep convolutional neural networks enable discrimination of heterogeneous digital pathology images. EBioMedicine 27, 317–328 (2018)
- [16] Kingma, D.P., Ba, J.: Adam: A method for stochastic optimization. arXiv preprint arXiv:1412.6980 (2014)
- [17] Madabhushi, A., Lee, G.: Image analysis and machine learning in digital pathology: Challenges and opportunities. Medical image analysis 33, 170–175 (2016)
- [18] Mahmood, T., Arsalan, M., Owais, M., Lee, M.B., Park, K.R.: Artificial intelligence-based mitosis detection in breast cancer histopathology images using faster r-cnn and deep cnns. Journal of clinical medicine 9(3), 749 (2020)
- [19] Riasatian, A., Babaie, M., Maleki, D., Kalra, S., Valipour, M., Hemati, S., Zaveri, M., Safarpoor, A., Shafiei, S., Afshari, M., et al.: Fine-tuning and training of densenet for histopathology image representation using tcga diagnostic slides. arXiv preprint arXiv:2101.07903 (2021)
- [20] Sudharshan, P., Petitjean, C., Spanhol, F., Oliveira, L.E., Heutte, L., Honeine, P.: Multiple instance learning for histopathological breast cancer image classification. Expert Systems with Applications 117, 103–111 (2019)
- [21] Tidake, V.S., Sane, S.S.: Multi-label classification: a survey. International Journal of Engineering and Technology 7(1045) (2018)
- [22] Tomczak, J.M., Ilse, M., Welling, M.: Deep learning with permutation-invariant operator for multi-instance histopathology classification. arXiv preprint arXiv:1712.00310 (2017)
- [23] Tomczak, K., Czerwińska, P., Wiznerowicz, M.: The cancer genome atlas (tcga): an immeasurable source of knowledge. Contemporary oncology 19(1A), A68 (2015)
- [24] Yu, K.H., Zhang, C., Berry, G.J., Altman, R.B., Ré, C., Rubin, D.L., Snyder, M.: Predicting non-small cell lung cancer prognosis by fully automated microscopic pathology image features. Nature communications 7, 12474 (2016)
- [25] Zaheer, M., Kottur, S., Ravanbakhsh, S., Poczos, B., Salakhutdinov, R., Smola, A.: Deep sets. arXiv preprint arXiv:1703.06114 (2017)
- [26] Zappa, C., Mousa, S.A.: Non-small cell lung cancer: current treatment and future advances. Translational lung cancer research 5(3), 288 (2016)
- [27] Zhang, M.L., Zhou, Z.H.: A review on multi-label learning algorithms. IEEE transactions on knowledge and data engineering 26(8), 1819–1837 (2013)