Anomalous charge transport of superconducting CuxPdTe2 under high pressure
Abstract
By means of high-pressure resistivity measurements on single crystals, we investigate the charge transport properties of CuxPdTe2, notable for the combination of topological type-II Dirac semimetallic properties with superconductivity up to K. In both cases of pristine () and intercalated () samples, we find an unconventional power law behavior of the low-temperature resistivity visible up to 40 K and remarkably stable under pressure up to 8.2 GPa. This observation is explained by the low carrier density , which strongly reduces the -region available for electron-phonon scattering, as previously reported in other low- two-dimensional systems, such as multilayer graphene and semiconductor heterostructures. Our data analysis complemented by specific heat measurements and supported by previous quantum oscillation studies and ab initio calculations suggests a scenario of one-band charge transport. Within this scenario, our analysis yields a large value of transport electron-phonon coupling constant at ambient pressure that appears to be strongly enhanced by pressure assuming a constant effective mass.
pacs:
74.62.Fj,52.25.Fi,74.25.-qI Introduction
Layered transition metal dichalcogenides (TMD) have attracted a great deal of interest for their rich physical properties, such as charge density waves (CDW) E.McCarron et al. (1976); Moncton et al. (1977); Wilson et al. (1975), superconductivity Wilson and Yoffe (1969); Morris et al. (1972) and pressure-induced phase transitions Yang et al. (2019); Wang et al. (2017); Vaidya et al. (2003). Recently, the interest in these compounds has been renewed after Huang et al.’s prediction Huang et al. (2016) of a novel type of topological electronic states, known as type-II Dirac cones. These states are characterized by a tilt of the energy dispersion curve of the cones with respect to the energy axis, which breaks the Lorentz invariance. These states display qualitatively different thermodynamic response as compared to that of type-I cones, typically found in graphene Novoselov et al. (2005). Namely, in type-II cones, the chiral anomaly depends on the direction of the magnetic field, which would lead to unusual topological transport properties.
Following the above seminal work, type-II Dirac cones have been predicted in a number of TMD’s like PdTe2, PtTe2 and PtSe2 Fei et al. (2017); Yan et al. (2017); Guo and Liang (1986), where the spin-orbit coupling (SOC) is sufficiently strong to produce the required tilt of the cones. Among these compounds, PdTe2 has been intensively studied for it displays superconductivity below =1.7-2 K Fei et al. (2017); Liu et al. (2015); Wang et al. (2016); Ryu (2015), attributed to a saddle-point-like van Hove singularity near the Fermi level, Kim et al. (2018), enhanced up to 2.5 K upon Cu intercalation Ryu (2015). PdTe2 has then been regarded as a promising playground to induce a topological superconducting (TSC) state at the surface by proximity Fu and Kane (2008), though the experimental observation of this state remains controversial. On one hand, the existence of type-II Dirac cones have been predicted by ab initio calculations and confirmed experimentally by angle resolved photoemission spectroscopy (ARPES) and by Shubnikov-de Haas (SdH) and de Haas-van Alphen (dHvA) quantum oscillations. The latter measurements further indicate that PdTe2 is a multi-band semimetal with a nontrivial Berry phase for one of these bands Fei et al. (2017); Wang et al. (2016); Zheng et al. (2018). On the other hand, scanning tunneling microscopy and spectroscopy studies Clark et al. (2018); Das et al. (2018); Voerman et al. (2019) support a picture of conventional BCS superconductivity contrasting the scenario of topological states at the Fermi surface.
In order to elucidate this controversy, a theoretical study suggests that high pressure may tune the superconducting and topological properties Xiao et al. (2017). Namely, the above study predicts a monotonic decrease of with pressure, the appearance of type-I cones above 4.7 GPa and the disappearance of the type-II cones above 6 GPa. These two abrupt changes in the electronic structure are expected to govern the interplay - if any - between superconductivity and topological Dirac states that can be probed experimentally. A first experimental study up to 2.5 GPa by Leng et al. unveils a non-monotonic pressure dependence of displaying a maximum at 0.91 GPa Leng et al. (2019), at odds with the above prediction. This discrepancy suggests that the calculations miss the details of the low-energy physics governing the superconducting state.
The purpose of the present study is to probe the signature of the evolution of the Dirac cones as a function of pressure in the electrical resistivity of pristine PdTe2 and intercalated Cu0.05PdTe2 single crystals by means of a systematic study at much higher pressures up to 8.2 GPa. A favorable condition for a quantitative analysis of the results is that the transport properties of the system are dominated by one band, as previously reported Wang et al. (2016).
II Sample Synthesis Methods
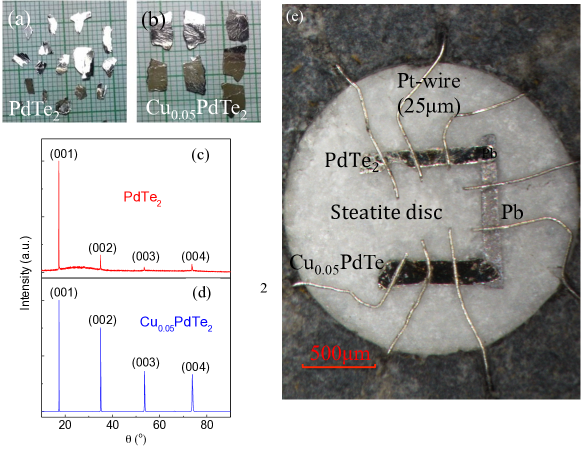
The PdTe2 and Cu0.05PdTe2 single crystals object of the present study have been prepared following a two-step route. First, polycrystalline samples were synthesized via conventional solid-state reaction of a stoichiometric mixture of high-purity Pd, Te and Cu powders. The mixture was ground, pelletized and sealed in evacuated quartz tubes with residual pressure lower than mbar. The pellets in the evacuated tubes were submitted to a heat treatment at 500 ∘C for 3 days followed by a slow cooling-down to room temperature. In the second step, the as-prepared polycrystalline samples were reground and repelletized and submitted to a second heat treatment in evacuated quartz tubes at 757 ∘C for one day, followed by a slow cooling-down to 500 ∘C during one week and a final treatment at this temperature for another week. The heating was finally switched off to cool-down freely the samples to room temperature. The above synthesis route reproducibly yield 3-8 mm-sized platelet-shaped single crystals, as shown in Figs. 1(a,b). X-ray diffractograms obtained using a Rigaku X-ray diffractometer confirm the phase purity of the samples. Figs. 1(c,d) show the -axis [00l] orientation of the platelets. For both compositions, PdTe2 and Cu0.05PdTe2, the data analysis indicates that the crystal structure and the lattice parameters obtained are consistent with previous reports Hooda and Yadav (2018). In Cu0.05PdTe2, we observed a minute shift of peak positions, attributed to a small reduction of the Pd-Te bond length Ryu (2015).
III Specific heat and high-pressure transport measurements
For both measurements, we selected one single crystal from each of the PdTe2 and Cu0.05PdTe2 batches, cleaved it and cut it in pieces of the desired shape and dimension. The isobaric specific heat, was measured in the 2-300 K range using a relaxation method implemented in a Quantum Design Physical Properties Measurement System (PPMS). The same apparatus was used for the electrical resistivity measurements using a conventional four-point method in the bar configuration. Typical bar dimensions are 700 300 20-40 m3. Owing to the platelet shape and orientation of the crystals, we measured the in-plane resistivity. For the ambient-pressure measurements, Au wires were attached on the cleaved surface using silver paste Dupont 6839. High-pressure measurements were carried out using a Bridgman-type cell, as described elsewhere Nakanishi et al. (2007). The samples were positioned inside a pyrophyllite ring and sandwiched between steatite discs used as pressure transmitting medium (see Fig. 1e). In this case, the mechanical action of pressure alone ensures a good electrical contact between Pt wires and sample. Pressure was applied at room temperature by clamping the load using a locking nut and progressively increased up to 8.2 GPa after each measurement. The pressure value was determined by measuring the superconducting transition temperature of a thin Pb sample (Goodfellow, 99.99% purity) placed near the PdTe2 and Cu0.05PdTe2 crystals (see Fig. 1e) and using the pressure dependence of the of Pb as calibration curve.
IV Results
IV.1 Specific heat
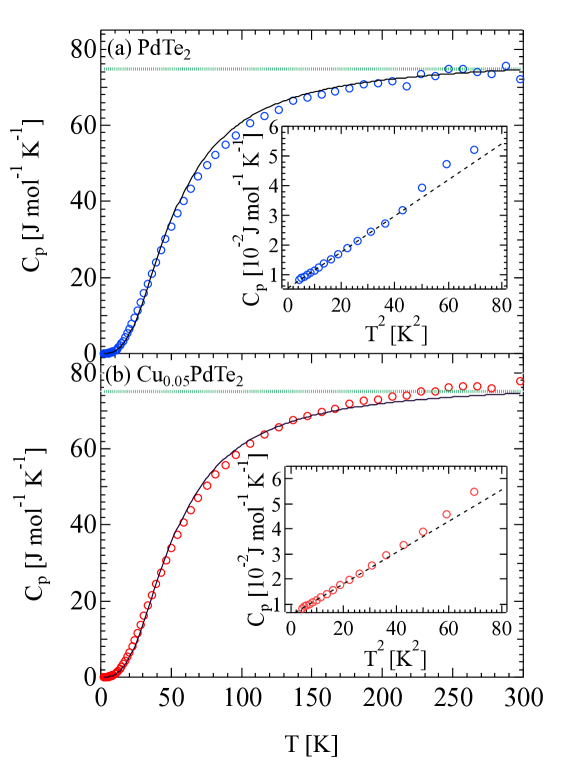
The curves of both PdTe2 and Cu0.05PdTe2 display a smooth behavior with no indication of phase transition in the whole 2-300 K range measured (see Fig. 2). In the high temperature region, the curves level off at the expected Dulong-Petit limit within the error made by neglecting the usually small difference between isobaric () and isochoric () specific heat. A straightforward analysis shows that, in the above temperature range, the data are well described by a conventional behavior resulting from the superposition of a linear electronic contribution and of a phonon contribution of the Debye type:
| (1) |
where , , and are the Sommerfeld coefficient, the number of atoms per formula unit, the gas constant and the Debye temperature. The small difference between calculated and experimental points may be ascribed to the above difference between and . and are determined by fitting the low-temperature data using the asymptotic dependence . In good agreement with Ref.Hooda and Yadav (2018); Amit and Singh (2018), the fit yields mJ mol-1 K-2 and mJ mol-1 K-4 for PdTe2 and mJ mol-1 K-2 and mJ mol-1 K-4 for Cu0.05PdTe2. Using the Fermi liquid expression , we obtain a density of states at the Fermi level of eV-1 f.u.-1 and 2.43 eV-1 f.u.-1 for PdTe2 and Cu0.05PdTe2, respectively. The larger in the latter compound is consistent with the electronic doping produced by Cu-intercalation. These values are consistent with early ab initio calculations that include the SOC Jan and Skriver (1977). Finally, using the Debye relation , within the statistical uncertainty, we find the same value K for the two samples, as expected considering the modest concentration of intercalated Cu atoms.
IV.2 Resistivity
In Fig. 3 we plot the temperature dependence of the normalized in-plane resistivity of the PdTe2 and Cu0.05PdTe2 single crystals at different pressures. In PdTe2, the ambient pressure and room temperature value of cm is consistent with the values in the cm range previously reported Ryu (2015); Amit and Singh (2018); Teknowijoyo et al. (2018); Kjekshus and Pearson (1965). The above scattering of values reported by different groups is attributed to the sensitivity of semimetals like PdTe2 to slightly different concentrations of Te vacancies. The value cm measured in Cu0.05PdTe2 is explained by a significant carrier doping provided by Cu intercalation. For both compounds, the curves evolve smoothly with pressure up to 8.2 GPa, which is expected considering that an earlier X-ray diffraction study gives no indication of any structural transition up to 19 GPa at room temperature Soulard et al. (2005). The absence of any anomaly with pressure indicates that the predicted crossover from type-II Dirac cones to type-I Dirac cones at GPa Xiao et al. (2017) does not affect the transport properties or may occur at higher pressures. We finally note that the residual resistivity ratio () decreases with pressure, probably because of defects in the sample produced by a pressure gradient in the cell.
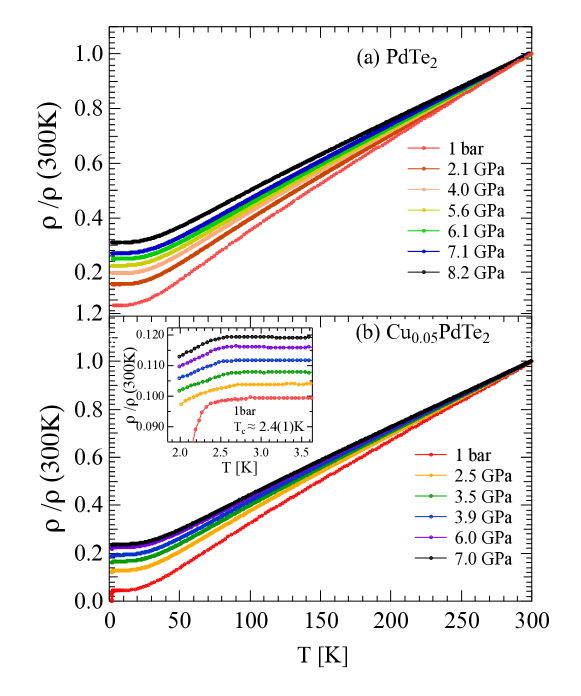
As seen in Fig. 3, no indication of superconductivity is found in PdTe2 above 2 K in the whole pressure range measured, consistent with a theoretical prediction of even lower ’s 1.7-2 K at ambient pressure Fei et al. (2017); Liu et al. (2015); Wang et al. (2016); Ryu (2015) and of a reduction with pressure Xiao et al. (2017). In the ambient pressure curve of Cu0.05PdTe2, we do observe a sharp superconducting transition with onset at 2.4 K, in agreement with a previous report Ryu (2015). Under high-pressure, the transition broadens significantly so that zero resistivity is not achieved yet at 2 K. As above, we attribute this broadening to defects produced by a pressure gradient. The behavior of the onset value with pressure is seen in the inset of Fig. 3b. One may note a slight increase of at 2.5 GPa, followed by an equally slight decrease at higher pressures. Overall, these variations fall within a modest interval of 0.3 K, which corresponds to a rate smaller than 0.05 K/GPa.
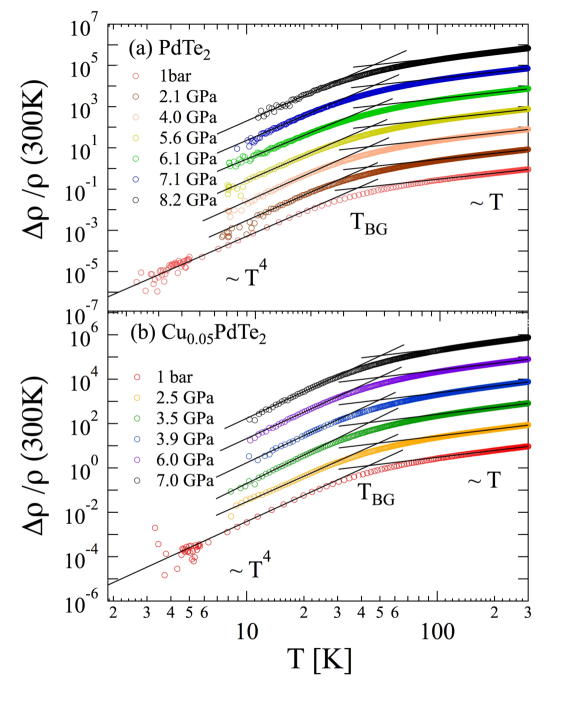
In Fig. 3, one further notes for both compounds a typical metallic behavior, characterized by a markedly linear dependence at high temperature followed by a saturation to a residual resistivity value at low temperature. As customary, we analyzed the behavior of this saturation using the power law . A straightforward data fit (see SM for details) shows that, in the whole pressure range investigated and for both compounds, the low-temperature behavior follows very well an unusual power law up to 40 K (see Fig. 4). At this temperature, the curves exhibit a smooth crossover to a linear dependence. This contrasts the power law expected in metals at low temperature within the Debye approximation.
V Discussion
To the best of our knowledge, the above unusual power-law has been reported previously in a few metallic systems and the proposed explanations are quite diverse Colvin and Arajs (1964); Mackintosh (1963); Bergmann et al. (1982); Hwang and Das Sarma (2008); Stormer et al. (1990); Efetov and Kim (2010). In polycrystalline Gd, a power law of the resistivity with observed in the 5 - 15 K range was explained by a linear spin-wave distribution law combined with a magnetic anisotropy Colvin and Arajs (1964); Mackintosh (1963). This scenario is clearly not applicable to the present case, for PdTe2 and Cu0.05PdTe2 are both paramagnetic above . A second example is given by Ag and Ag-based alloys that have been reported to display a power law similar to ours in
the 2 - 6 K range Bergmann et al. (1982). It was argued that this dependence limited to a narrow range of temperatures is ascribed to the concomitance of electron-phonon scattering and electron-electron scattering where Matthiessen’s rule is not valid. This scenario is not applicable either to our case, where the observed dependence extends to a much wider temperature range, suggesting that a single scattering mechanism dominates.
The peculiar behavior observed here is rather similar to that found in multilayer graphene and bidimensional (2D) semiconductor heterojunctions with low carrier density, to which the so-called acoustic phonon limited model has been applied previously Hwang and Das Sarma (2008); Stormer et al. (1990); Efetov and Kim (2010). All these systems share with PdTe2 and Cu0.05PdTe2 a low carrier density and thus a small Fermi surface and a small Fermi wave vector . When the Fermi surface is much smaller than the first Brillouin zone (BZ), only low-energy acoustic phonons participate in the electron-phonon scattering process. As a result, the low-temperature limit of the Debye model, corresponding to a ratio approximated by infinity, is reached at temperatures much lower than the liquid helium temperatures of standard measurements like ours. In this case, instead of the Debye temperature , one has to introduce a cut-off Bloch-Grüneisen temperature , where is the sound velocity Stormer et al. (1990). A theoretical study proposed for graphene in the absence of screening shows that in the limit, while in the opposite limit Hwang and Das Sarma (2008). This model, suitable to 2D semimetals in general, assumes that only the longitudinal acoustic mode participates in the electron-phonon scattering. Transverse acoustic modes are neglected because of the 2D characteristic of the system while optical modes are not populated at low temperatures Hwang and Das Sarma (2008).
We argue that the above model is suitable indeed for the PdTe2 system. First, in spite of the 3D character of the Fermi surface, a 2D model appears to be appropriate to describe the electrical transport because the electron-phonon coupling displays pronounced 2D properties, as shown by Kim et al. Kim et al. (2018). Namely, by means of ab initio calculations, these authors found that the frequency-dependent electron-phonon coupling constant is dominated by in-plane phonons. Second, we compare the value of with the size of the first BZ in the -plane. Considering that the lattice parameter is Å, so Soulard et al. (2005) and using the Onsager rule relating the frequency of the quantum oscillations to the extremal Fermi surface area normal to the magnetic field, , we estimate and, consequently, . Assuming circular cross sections of the Fermi surface, SdH and dHvA measurements Fei et al. (2017); Wang et al. (2016); Zheng et al. (2018) unveil a low frequency at 8 T, a group of medium frequencies in the 110 T 140 T range and a high frequency of 450 T corresponding to values of 0.016, 0.057 - 0.062 and 0.12 Å-1, respectively. Evidently, these values are small as compared to the size of the first BZ, so the model of acoustic phonon-limited scattering is applicable. The SdH measurements also show very high frequencies of 1000 T and above, which corresponds to values comparable to Zheng et al. (2018). The charge carriers of these small pockets are then expected to dominate the transport properties in PdTe2.
The crossover from to linear behavior in the log-log plot of the curves in Fig 4 indicates that K in PdTe2 and we take m/s for the longitudinal acoustic branch, as reported previously Finlayson et al. (1986). We then find 0.068 Å-1, in good agreement with the magnitude of the medium frequencies of the above dHvA and SdH experiments. This suggests that the charge carriers of the corresponding extremal Fermi surface sections dominate the normal state transport properties. According to ab initio calculations of the band structure and to the dHvA and SdH results, these sections belong to the six-fold plier-shaped Fermi pocket (see Fig.4(b) of Fei et al. (2017)), while the remaining frequencies are associated with other Fermi pockets Fei et al. (2017); Zheng et al. (2018). A further dHvA study shows that these Fermi pockets give large amplitudes in the fast Fourier transform (FFT) spectra Wang et al. (2016), in agreement with the Kohler plot of PdTe2, which features a scaling of the magnetoresistivity in a wide range of temperature Wang et al. (2016), as commonly observed in single-band metals. The discrepancy between experimental and estimated values may be due to the following: (i) the contribution of charge carriers from other Fermi pockets. (ii) The Pd atoms are located in distorted octahedra, so the contribution of transverse acoustic modes with lower sound velocity may not be negligible. (iii) The above estimate of is based on the approximation of circular cross-sections of the Fermi pockets.
One further point of discussion concerns the effects of pressure and intercalation within the proposed scenario of acoustic phonon limited scattering. Although Hall measurements on PdTe2 suggest a multiband picture Fei et al. (2017); Leng et al. (2019), the above analysis suggests that a single band dominates charge transport, which allows us to estimate the electron-phonon coupling constant using a simple one-band model for free-electron-like metals. Within such a model, at high temperatures (), the resistivity is expressed as Grimvall (1976), where and are the effective band mass and the charge carrier density, respectively. The transport electron-phonon coupling differs from the electron-phonon coupling for the presence of the transport factor in the scattering integral averaging over all phonon contributions, which gives extra weight to backscattering processes. Under ambient pressure and at high temperatures, K, the curve yields a resistivity coefficient cm/K. So, taking cm-3 estimated at low field Leng et al. (2019) and ( is the free electron mass), which corresponds to the medium frequencies of the quantum oscillations Fei et al. (2017), we obtain , to be compared with predicted by ab initio calculations Kim et al. (2018) and reported in a very recent helium atom scattering study Anemone et al. (2021). We ascribe this discrepancy between and values partly to the above transport factor and partly to the uncertainty in the geometry of the present resistivity measurements. In any case, the present estimate of gives a useful indication regarding the effect of pressure on the electron-phonon coupling. For instance, at 2 GPa, we find that increases up to cm-3 Leng et al. (2019), and the slope of the (T) curve at high temperature is 0.1 cm/K. Assuming that the remains constant, we conclude that increases by a factor 2 as compared to ambient pressure. This enhancement is at odds with the observed decrease of at 2 GPa Leng et al. (2019). We can reconcile the two results by considering that the effective mass - and thus the band structure - is also expected to change with pressure.
.
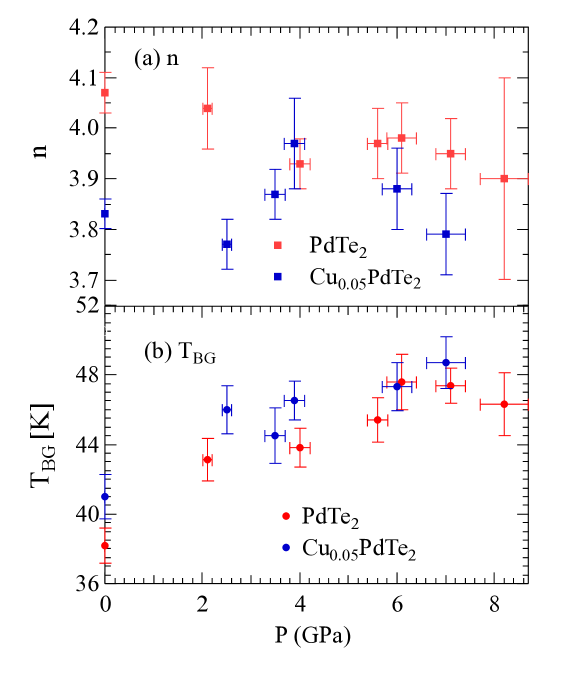
We finally ask ourselves whether the 2D character of PdTe2 is affected under high pressure or upon intercalation due to a larger orbital overlap along the -axis and to the increasing importance of transverse modes. To test this possibility, in Fig. 5a we plot the power law coefficient as a function of pressure for PdTe2 and Cu0.05PdTe2. Remarkably, is not sensitive to pressure and remains equal to 4 for both compounds within the statistical uncertainty. We argue that this robustness reflects the stability of the 2D character of the system. Indeed, it was reported Soulard et al. (2005) that, at 8 GPa, the lattice constant ratio of PdTe2 decreases by only 2.4% as compared to the ambient pressure value. The value of Cu0.05PdTe2 is smaller than that for PdTe2, which suggests that the 2D character is reduced by Cu intercalation, as expected. Fig. 5(b) shows the experimental values of as a function of pressure for PdTe2 and Cu0.05PdTe2. For both compounds, note an abrupt increase of at low pressure, 2 GPa. Considering that the lattice parameters and the carrier density vary smoothly with pressure Leng et al. (2019); Soulard et al. (2005), one possible explanation is an anomalous variation of sound velocity at low pressure. Above 2 GPa, the moderate increase of with pressure is ascribed to an increased carrier density. The value of in Cu0.05PdTe2 slightly exceeds that of PdTe2, which supports the picture that Cu intercalation enhances carrier density.
VI Conclusion
The present study on the type-II Dirac semimetals PdTe2 and Cu0.05PdTe2 shows that the superconducting transition temperature is weakly affected by high pressure, with no anomaly in the pressure dependence of the resistivity curves up to 8.2 GPa. The latter result is at odds with the predicted pressure-induced evolution of . Charge transport is also insensitive to the variations of the topological properties of the system under pressure, i.e. the evolution of type II to type I Dirac cone, because the latter is located far from the Fermi energy. At low temperatures, all resistivity curves exhibit a remarkable power law up to 40 K and independent of pressure up to 8.2 GPa. Our data analysis supports a model of acoustic phonon-limited scattering suitable for low-density 2D materials, consistent with a scenario of charge transport dominated by one electronic band, as proposed previously Wang et al. (2016). Within this scenario, the dominant band is likely to be the six-fold plier-shaped Fermi surface pocket probed experimentally by quantum oscillations and predicted by ab initio calculations. For this dominant band, our analysis yields a remarkably large value of transport electron-phonon coupling constant at ambient pressure that appears to be strongly enhanced by pressure assuming a constant effective mass. Further studies are needed to confirm this enhancement while measurements at even higher pressures may definitely rule out the possibility that pressure can tune the topological properties of the system.
VII Acknowledgement
The authors are grateful to Stefan Klotz for useful discussions and Nicolas Dumesnil, Philippe Rosier and the staff of the low-temperature physical properties service (MPBT) of Sorbonne Université for technical support. The authors gratefully acknowledge the financial support provided by the Chinese Scholarship Council (Grant No. 201608070037) and by the Laboratory of Excellence MATISSE within the frame of the "Investissements d’Avenir Programme" of the French Ministery of University and Research (MESRI) under reference ANR-11-IDEX-0004-02.
References
- E.McCarron et al. (1976) E.McCarron, R.Korenstein, and A.Wold, Materials Research Bulletin 11, 1457 (1976).
- Moncton et al. (1977) D. E. Moncton, J. D. Axe, and F. J. DiSalvo, Phys. Rev. B 16, 801 (1977), URL https://link.aps.org/doi/10.1103/PhysRevB.16.801.
- Wilson et al. (1975) J. Wilson, F. D. Salvo, and S. Mahajan, Advances in Physics 24, 117 (1975).
- Wilson and Yoffe (1969) J. Wilson and A. Yoffe, Advances in Physics 18, 193 (1969).
- Morris et al. (1972) R. C. Morris, R. V. Coleman, and R. Bhandari, Phys. Rev. B 5, 895 (1972), URL https://link.aps.org/doi/10.1103/PhysRevB.5.895.
- Yang et al. (2019) L. Yang, L. Dai, H. Li, H. Hu, K. Liu, C. Pu, M. Hong, and P. Liu, AIP Advances 9, 065104 (2019).
- Wang et al. (2017) X. Wang, X. Chen, Y. Zhou, C. Park, C. An, Y. Zhou, R. Zhang, C. Gu, W. Yang, and Z. Yang, Scientific Reports 7, 46694 (2017), URL https://doi.org/10.1038/srep46694.
- Vaidya et al. (2003) R. Vaidya, N. Bhatt, S. G. Patel, A. R. Jani, A. B. Garg, V. Vijayakumar, and B. K. Godwal, Pramana 61, 183 (2003), URL https://doi.org/10.1007/BF02704523.
- Huang et al. (2016) H. Huang, S. Zhou, and W. Duan, Phys. Rev. B 94, 121117 (2016), URL https://link.aps.org/doi/10.1103/PhysRevB.94.121117.
- Novoselov et al. (2005) K. S. Novoselov, A. K. Geim, S. V. Morozov, D. Jiang, M. I. Katsnelson, I. V. Grigorieva, S. V. Dubonos, and A. A. Firsov, Nature 438, 197 (2005), URL https://doi.org/10.1038/nature04233.
- Fei et al. (2017) F. Fei, X. Bo, R. Wang, B. Wu, J. Jiang, D. Fu, M. Gao, H. Zheng, Y. Chen, X. Wang, et al., Phys. Rev. B 96, 041201 (2017), URL https://link.aps.org/doi/10.1103/PhysRevB.96.041201.
- Yan et al. (2017) M. Yan, H. Huang, K. Zhang, E. Wang, W. Yao, K. Deng, G. Wan, H. Zhang, M. Arita, H. Yang, et al., Nature Communications 8, 257 (2017), URL https://doi.org/10.1038/s41467-017-00280-6.
- Guo and Liang (1986) G. Y. Guo and W. Y. Liang, Journal of Physics C: Solid State Physics 19, 995 (1986), URL https://doi.org/10.1088%2F0022-3719%2F19%2F7%2F011.
- Liu et al. (2015) Y. Liu, J.-Z. Zhao, L. Yu, C.-T. Lin, A.-J. Liang, C. Hu, Y. Ding, Y. Xu, S.-L. He, L. Zhao, et al., Chinese Physics Letters 32, 067303 (2015), URL https://doi.org/10.1088%2F0256-307x%2F32%2F6%2F067303.
- Wang et al. (2016) Y. Wang, J. Zhang, W. Zhu, Y. Zou, C. Xi, L. Ma, T. Han, J. Yang, J. Wang, J. Xu, et al., Scientific Reports 6, 31554 (2016), URL https://doi.org/10.1038/srep31554.
- Ryu (2015) G. Ryu, Journal of Superconductivity and Novel Magnetism 28, 3275 (2015), URL https://doi.org/10.1007/s10948-015-3195-2.
- Kim et al. (2018) K. Kim, S. Kim, J. S. Kim, H. Kim, J.-H. Park, and B. I. Min, Phys. Rev. B 97, 165102 (2018), URL https://link.aps.org/doi/10.1103/PhysRevB.97.165102.
- Fu and Kane (2008) L. Fu and C. L. Kane, Phys. Rev. Lett. 100, 096407 (2008), URL https://link.aps.org/doi/10.1103/PhysRevLett.100.096407.
- Zheng et al. (2018) W. Zheng, R. Schönemann, N. Aryal, Q. Zhou, D. Rhodes, Y.-C. Chiu, K.-W. Chen, E. Kampert, T. Förster, T. J. Martin, et al., Phys. Rev. B 97, 235154 (2018), URL https://link.aps.org/doi/10.1103/PhysRevB.97.235154.
- Clark et al. (2018) O. J. Clark, M. J. Neat, K. Okawa, L. Bawden, I. Marković, F. Mazzola, J. Feng, V. Sunko, J. M. Riley, W. Meevasana, et al., Phys. Rev. Lett. 120, 156401 (2018), URL https://link.aps.org/doi/10.1103/PhysRevLett.120.156401.
- Das et al. (2018) S. Das, Amit, A. Sirohi, L. Yadav, S. Gayen, Y. Singh, and G. Sheet, Phys. Rev. B 97, 014523 (2018), URL https://link.aps.org/doi/10.1103/PhysRevB.97.014523.
- Voerman et al. (2019) J. A. Voerman, J. C. de Boer, T. Hashimoto, Y. Huang, C. Li, and A. Brinkman, Phys. Rev. B 99, 014510 (2019), URL https://link.aps.org/doi/10.1103/PhysRevB.99.014510.
- Xiao et al. (2017) R. C. Xiao, P. L. Gong, Q. S. Wu, W. J. Lu, M. J. Wei, J. Y. Li, H. Y. Lv, X. Luo, P. Tong, X. B. Zhu, et al., Phys. Rev. B 96, 075101 (2017), URL https://link.aps.org/doi/10.1103/PhysRevB.96.075101.
- Leng et al. (2019) H. Leng, A. Ohmura, L. N. Anh, F. Ishikawa, T. Naka, Y. K. Huang, and A. de Visser, Journal of Physics: Condensed Matter 32, 025603 (2019), URL https://doi.org/10.1088%2F1361-648x%2Fab49b5.
- Hooda and Yadav (2018) M. K. Hooda and C. S. Yadav, EPL (Europhysics Letters) 121, 17001 (2018), URL https://doi.org/10.1209%2F0295-5075%2F121%2F17001.
- Nakanishi et al. (2007) T. Nakanishi, M. Nicklas, G. Sparn, and F. Steglich, Journal of the Physical Society of Japan 76, 223 (2007), eprint https://doi.org/10.1143/JPSJS.76SA.223, URL https://doi.org/10.1143/JPSJS.76SA.223.
- Amit and Singh (2018) Amit and Y. Singh, Phys. Rev. B 97, 054515 (2018), URL https://link.aps.org/doi/10.1103/PhysRevB.97.054515.
- Jan and Skriver (1977) J. P. Jan and H. L. Skriver, Journal of Physics F: Metal Physics 7, 1719 (1977), URL https://doi.org/10.1088%2F0305-4608%2F7%2F9%2F017.
- Teknowijoyo et al. (2018) S. Teknowijoyo, N. H. Jo, M. S. Scheurer, M. A. Tanatar, K. Cho, S. L. Bud’ko, P. P. Orth, P. C. Canfield, and R. Prozorov, Phys. Rev. B 98, 024508 (2018), URL https://link.aps.org/doi/10.1103/PhysRevB.98.024508.
- Kjekshus and Pearson (1965) A. Kjekshus and W. Pearson, Can. J. Phys. 43(3), 438 (1965).
- Soulard et al. (2005) C. Soulard, P. Petit, P. Deniard, M. Evain, S. Jobic, M.-H. Whangbo, and A.-C. Dhaussy, Journal of Solid State Chemistry 178, 2008 (2005), ISSN 0022-4596, URL http://www.sciencedirect.com/science/article/pii/S0022459605001623.
- Colvin and Arajs (1964) R. V. Colvin and S. Arajs, physica status solidi (b) 4, 37 (1964), eprint https://onlinelibrary.wiley.com/doi/pdf/10.1002/pssb.19640040104, URL https://onlinelibrary.wiley.com/doi/abs/10.1002/pssb.19640040104.
- Mackintosh (1963) A. Mackintosh, Physics Letters 4, 140 (1963), ISSN 0031-9163, URL http://www.sciencedirect.com/science/article/pii/0031916363901434.
- Bergmann et al. (1982) A. Bergmann, M. Kaveh, and N. Wiser, Journal of Physics F: Metal Physics 12, 2985 (1982), URL https://doi.org/10.1088%2F0305-4608%2F12%2F12%2F028.
- Hwang and Das Sarma (2008) E. H. Hwang and S. Das Sarma, Phys. Rev. B 77, 115449 (2008), URL https://link.aps.org/doi/10.1103/PhysRevB.77.115449.
- Stormer et al. (1990) H. L. Stormer, L. N. Pfeiffer, K. W. Baldwin, and K. W. West, Phys. Rev. B 41, 1278 (1990), URL https://link.aps.org/doi/10.1103/PhysRevB.41.1278.
- Efetov and Kim (2010) D. K. Efetov and P. Kim, Phys. Rev. Lett. 105, 256805 (2010), URL https://link.aps.org/doi/10.1103/PhysRevLett.105.256805.
- Finlayson et al. (1986) T. R. Finlayson, W. Reichardt, and H. G. Smith, Phys. Rev. B 33, 2473 (1986), URL https://link.aps.org/doi/10.1103/PhysRevB.33.2473.
- Grimvall (1976) G. Grimvall, Physica Scripta 14, 63 (1976), URL https://doi.org/10.1088%2F0031-8949%2F14%2F1-2%2F013.
- Anemone et al. (2021) G. Anemone, P. Casado Aguilar, M. Garnica, F. Calleja, A. Al Taleb, C.-N. Kuo, C. S. Lue, A. Politano, A. L. Vázquez de Parga, G. Benedek, et al., npj 2D Materials and Applications 5, 25 (2021), URL https://doi.org/10.1038/s41699-021-00204-5.