The onset of jets in classical novae
Abstract
We present two further classical novae, V906 Car and V5668 Sgr, that show jets and accretion disc spectral signatures in their H-alpha complexes throughout the first 1000 days following their eruptions. From extensive densely time-sampled spectroscopy, we measure the appearance of the first high-velocity absorption component in V906 Car, and the duration of the commencement of the main H-alpha emission. We constrain the time taken for V5668 Sgr to transition to the nebular phase using [N II] 6584Å. We find these timings to be consistent with the jet and accretion disc model for explaining optical spectral line profile changes in classical novae, and discuss the implications of this model for enrichment of the interstellar medium.
keywords:
stars: jets – accretion discs – novae – stars: individual: V5668 Sgr,Nova Sagittarii 2015b – stars: individual: V906 Car,ASASSN-18fv,Nova Car 2018 – stars: individual: YZ Reticuli,MGAB-V207,Nova Reticuli 20201 Introduction
Classical novae are explosive events which occur on the surface of white dwarfs found in close binaries. Hydrogen accretes onto the degenerate surface, and heats up until it reaches temperatures of around K, when it ignites and thermonuclear runaway occurs (Gallagher & Starrfield, 1978). This ejects a shell of the accreted hydrogen, whose mass is dependent on that of the underlying white dwarf. The exact nature of the outflows from such an eruption are not well known, and there are competing theories about interactions between the potentially complex ejecta and the immediate surroundings (Arai et al., 2016; Williams & Mason, 2010).
One particular topic about which not much is known is the accretion disc and its survival in the immediate aftermath of a classical nova. While simulations suggest that such a disc might be destroyed by the eruption (Figueira et al., 2018), observational evidence indicates that discs may survive in some form (Skillman et al., 1997; Hounsell et al., 2011; Hachisu & Kato, 2012). This paper follows McLoughlin et al. (2021) which presented, from an analysis of time-resolved spectroscopy, evidence for the persistence of both jets and an accretion disc in the weeks and months that followed the eruption of classical nova YZ Reticuli. A key significance of the surviving accretion disc is that a disc is considered a necessary (but not sufficient) condition for the launching of jets (de Gouveia Dal Pino, 2005; Coppejans & Knigge, 2020). In the present paper, we add two new examples, V5668 Sgr and V906 Car, which also seem to display the spectral signature of accretion discs from early times after the eruption. We also detect jets in both of these novae, and are able to time the onset of their becoming spectrally significant in H observations.
Astrophysical jets are a ubiquitous phenomenon arising from central masses having a huge dynamic range of mass, from supermassive black holes giving rise to synchrotron-emitting jets in quasars, to stellar-mass black holes in microquasars giving jets that are both line-emitting and synchrotron, to young stellar objects having line-emitting jets. Recently-launched line-emitting jets from classical novae therefore afford a new opportunity to study the commencement of jet launch in lower-mass systems.
Objects classified as classical novae display a rich variety of behaviours, yet there are many phases which most novae appear to exhibit. We use densely time-sampled spectroscopic observations of three classical novae to tightly constrain the durations of certain transitions between phases for these particular objects.
In Section 2, we explain the data collected for each target. In Section 3, we quantify the duration of certain phase changes for V906 Car. In Section 4, we perform a similar set of analyses for V5668 Sgr, which also reveal the spectral signature of jets and an accretion disc. In Section 5, we discuss the jets and disc of V906 Car and the overall picture of classical nova evolution in light of this model, and consider the impact nova jets may have on enrichment of the interstellar medium. In Section 6, we conclude by recommending new observations to target direct observations of such jets.
1.1 Classification schemes for classical novae
Over the years, there have been several efforts to categorise different aspects of the hugely varied range of behaviours exhibited by classical novae in spectroscopic, photometric and polarimetric data. A thorough account of our modern understanding of the phases typically exhibited by classical novae is given in section 4 of Della Valle & Izzo (2020), and so here we give just a brief summary of a relevant subset of this material.
In terms of spectral characteristics, Williams et al. (1991); Williams (1992, 1994) performed a deep analysis of optical spectra for a set of 13 novae, and found that they separate into two spectral classes — Fe ii and He /N , a designation known as the Tololo scheme. The Fe ii spectral type is typified by having many low-excitation Fe ii emission lines, along with P-Cygni profiles shortly after eruption in low-ionisation heavy elements, and these spectra are thought to be formed in a circumbinary reservoir, fed by the wind off the secondary. He /N novae on the other hand, show strong flat-topped emission lines of helium and neon, hinting at their formation in the white dwarf ejecta. They also found that some classical novae exhibit a “hybrid” evolution, changing between the two types.
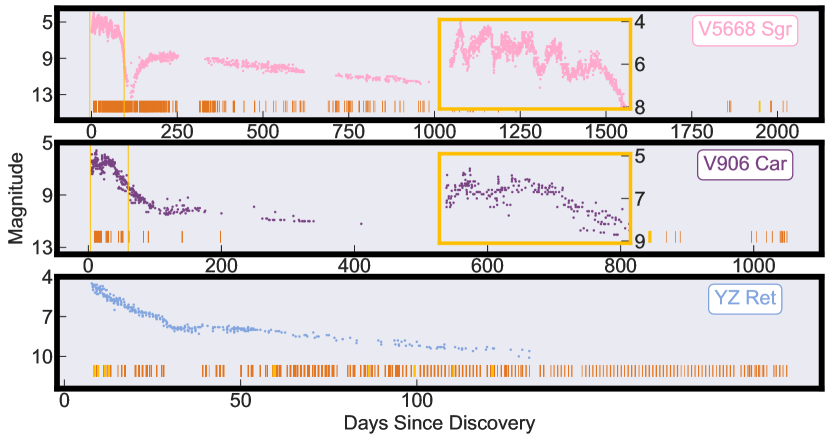
Light curves of classical novae can be organised into several broad types based on features they exhibit (Strope et al., 2010). For instance, a “dust dip” light curve (like that of V5668 Sgr, shown in the upper panel of Figure 1) indicates condensation of dust in the nova ejecta, leading to a months-long dip in optical brightness and a corresponding increase in the infrared, while a “smooth” light curve follows a simple broken power law of decline, due to radiative transfer in the shell ejecta.
Classical nova light curves also have speed classes, with typical designations based on the time to decline by two optical magnitudes from maximum (known as ), although this can be difficult to assign in cases when the maximum is not well-sampled or the decline is not smooth. It is thought that the faster a classical nova fades, the more massive the white dwarf is, and the more rapidly it will recur (Kato, 2002; Shara et al., 2018).
Studies of classical novae in the X-ray have revealed a clear distinction between hard and soft X-ray radiation, with the former being associated with shocks in outflows and the latter with the surface burning. Schwarz et al. (2011) performed a population study of the X-ray behaviour of classical novae, and determined that systems with a faster speed class show early hard X-rays, which are not present for slow novae.
1.2 Jets and shell ejecta in novae
The previous paper in this series (McLoughlin et al., 2021) studied the H complex of classical nova YZ Reticuli, and found it to be well-fit by the same five Gaussian emission components throughout the many months following its July 2020 eruption. Four of the five components naturally divide into two pairs, with each pair consisting of a red-shifted and a blue-shifted component; in addition there was a fifth component which did not appear to be dynamically significant.
McLoughlin et al. (2021) made the case for oppositely-directed outflows in YZ Reticuli i.e. jets. We also presented evidence that the slower-moving pair might arise from an accretion disc, which would provide a means for launching the jets. For each of the two pairs, some intriguing patterns appeared as can be seen in figures 6 and 7 of McLoughlin et al. (2021). For example, the radial-velocity separation within each pair increased and decreased repeatedly, because of symmetric, correlated motions of each of its constituent components.
The most natural interpretation of this behaviour, as presented in McLoughlin et al. (2021), is that the angle with which the components are moving with respect to Earth’s line of sight was changing. This phenomenon, in the case of oppositely-directed jets, is known as precession. Those figures show that the varying separation of the higher radial-velocity pair of lines does not have a simple phase-relationship with that of the lower-speed pair.
Precession in jets is likely to arise because of precession of the accretion disc which launches those jets; this is directly evidenced in the case of the steadily precessing accretion disc and jets of the microquasar SS433 (Blundell et al., 2008). In contrast, a newly-erupted classical nova will have an unbalanced accretion disc that has not yet equilibrated that is likely to precess as it launches the jets; the phase-relationship between its precession and that of the jets will not be as straightforward to identify.
McLoughlin et al. (2021) further found that a similar model accounted for the emission in V6568 Sgr, a classical nova which rapidly faded and so did not warrant a major observing campaign. In the present paper we extend that work by examining historical data captured in two major campaigns by the Global Jet Watch on two previous classical novae, V906 Car and V5668 Sgr, with the jets and disc model found to describe the behaviour of YZ Reticuli.
McLoughlin et al. (2021) proposed that V6568 Sgr bridges the gap in white dwarf mass between YZ Reticuli and the recurrent novae (that are already known to produce jets e.g. (Sokoloski et al., 2008; Rupen et al., 2008)), whose rapid recurrence timescales are believed to be due to their masses being higher than non-recurrent classical nova systems. White dwarf mass is intrinsically linked to their nova speed class, with higher masses leading to faster recurrence rates and shorter decline times (Schwarz et al., 2011). Speed class therefore may relate to the propensity of a nova system to launch jets along the axis of spin of the white dwarf.
1.3 Classical nova V5668 Sgr
Classical nova V5668 Sgr was discovered by John Seach on 2015 March 15.634 UT (= JD), which we take as d for this paper. It is also known as Nova Sgr 2015b, and PNV J183657002855420. It has (J2000) Right Ascension 18 37 39.9 and Declination 29 04 03, and Galactic coordinates of 005.3211 10.0678. It was classified as being of type Fe ii by Banerjee et al. (2015) using near-infrared observations.
This nova, like the others we study in this paper, benefits from light curves whose data points have been contributed by many amateur observers around the world. It is remarkable that despite the non-uniformity of technique and instrumentation (visual vs camera) a clear picture of the changing flux density emerges, as exemplified in Figure 1. While there is some scatter arising from such heterogeneous collections of data (see for example the analysis in Baluev et al. (2015) and references therein) this does not in any way hinder the scope of this paper. The AAVSO111aavso.org light curve for this classical nova (shown in the first panel of Figure 1) showed a prominent dust-dip from approximately d to d (Banerjee et al., 2015). It was found to have a white dwarf mass of by Hachisu & Kato (2019), using their scaled light curve method.
Gehrz et al. (2018) describes in detail the X-ray story according to Swift observations of V5668 Sgr. Their first detection in X-ray was at JD, which corresponds to d. They derive supersoft source switch-on and switch-off times as d and d to d. They find the mass of the underlying CO white dwarf to be .
Molaro et al. (2016) found V5668 Sgr to be a significant producer of 7Be ii, and used this to suggest that classical novae may be the source of all the 7Li in the Milky Way. Diaz et al. (2018) discovered structures in ALMA imaging of the ejecta of V5668 Sgr which were the smallest scale of those found in the remnants of any stellar explosion so far, although the veracity of the details of the extended emission depends on UV-plane coverage of the interferometric ALMA observations.
Jack et al. (2017) performed a detailed identification of four optical spectra of V5668 Sgr and compared their spectroscopy with the light curve to show that certain blue-shifted absorption features moved to slower radial velocities during the multiple rises to maximum (present until d in the light curve of V5668 Sgr in the upper panel of Figure 1), and to faster radial velocities during the decline. We briefly expand on this work in Section 4.4.
1.4 Classical nova V906 Car
The earliest detection of classical nova V906 Car was at JD by the Evryscope-South observatory, according to Corbett et al. (2018), which we refer to as the discovery date for the system. It was independently discovered after this by Stanek et al. (2018) using the All Sky Automated Survey for SuperNovae (hereafter ASAS-SN). In this paper, we reference times as days since commencement of brightening (JD). It has (J2000) Right Ascension 10:36:15.426 and Declination 59:35:53.731; its Galactic coordinates are 286.580 01.088.
The mass of the white dwarf in V906 Car was estimated at through an analysis of the progenitor system by Wee et al. (2020) using an accretion disc model to understand the light curve. Their decline times of d and d point to V906 Car’s being a moderately fast classical nova, although Aydi et al. (2020b) suggest a value of d. Sokolovsky et al. (2020b) determined that this classical nova occured on a CO white dwarf, and they concluded that the mass must have been low as there was no distinct supersoft phase detected in the X-ray. Their thorough analysis of the NuSTAR, Fermi/LAT, XMM–Newton and Swift/XRT X-ray data revealed that the nova shell was expelled by d. The white dwarf was found to be of CO-type by Sokolovsky et al. (2020b).
The optical AAVSO light curve shows some initial flares up to around d, and exhibited weak cusp-like behaviour between d and d. Aydi et al. (2020a) used correlated flares in the optical and gamma-ray light curves of V906 Car to show that the emission in both bands is probably powered by the same underlying mechanism, which they took to be fast outflow colliding with slower outflows, and shock-heating it. Observations by Pavana et al. (2020) show V906 Car to be of the hybrid class of classical novae. Wee et al. (2020) associate V906 Car with the Carina Nebula, and thus assume a distance to the classical nova of kpc.
1.5 Classical nova YZ Reticuli
YZ Reticuli was discovered by Robert H. McNaught (Coonabarabran, NSW, Australia) at magnitude 5.3 on 2020 July 15.590 UT (CBET 4811). It is also identified as Nova Reticuli 2020, and MGAB-V207, with Right Ascension of 03 58 29.55 and Declination 54 46 41.2 (J2000), its Galactic coordinates 265.397 46.395. Following McLoughlin et al. (2021), we take the date of discovery as 2020-07-08.1708, or JD 2459038.6708, henceforth d.
The lower panel of Figure 1 shows the AAVSO light curve of YZ Reticuli for the 125 days following eruption. YZ Reticuli exhibits a plateau-type light curve (Strope et al., 2010) between d and d, which may relate to the plateau in the light curve of classical nova V407 Cyg, interpreted by Hachisu & Kato (2012) as a surviving accretion disc emerging out of the receding photosphere. The decline time of this classical nova is days during the initial decline (although this changes during the plateau event) (Sokolovsky et al., 2020a). A summary of the behaviour in X-rays and in gamma rays is given in McLoughlin et al. (2021), and we refer the reader there for more detail. As discussed in that paper, the GAIA distance is (Bailer-Jones et al., 2018). It was classified as a He /N classical nova (A. Carr et al., 2020), while (L. Izzo et al., 2020) suggest that this is an ONe white dwarf.
1.6 A heterogenous sample
The set of novae we examine includes one of each kind of the Tololo scheme for classical nova spectra; one Fe ii, one He /N , and one hybrid as detailed in Table 1. The light curves (shown in Figure 1) are thoroughly distinct, in their classifications, peculiar idiosyncrasies and timescales. Also, the underlying white dwarf compositions include both ONe and CO types. In Table 1, we summarise the key details of three classical novae.
Banerjee et al. (2015); Pavana et al. (2020); A. Carr et al. (2020); Aydi et al. (2020b); McLoughlin et al. (2021); Sokolovsky et al. (2020a); Gehrz et al. (2018); Sokolovsky et al. (2020b); L. Izzo et al. (2020); Wee et al. (2020);
| V5668 Sgr | V906 Car | YZ Ret | |
| Tololo class | Fe ii | Hybrid | He /N |
| Light curve | Dust-dip | Jitter/Cusp | Plateau |
| Decline time | d | d | |
| SSS on | d | ||
| SSS off | d to d | ||
| White dwarf type | CO | CO | ONe |
| White dwarf mass |
2 Observations
The observational set-up and reduction pipeline for the data used in this paper are largely identical to the procedures described in our previous paper, McLoughlin et al. (2021), so we here provide only a brief summary.
2.1 Observatories
The spectroscopic data in this paper is based on three major observational campaigns carried out by the Global Jet Watch telescopes, a system of 5 terrestrial observatories separated around the world by longitude to enable continuous monitoring of rapidly evolving astrophysical targets. The observatories house 0.5 m telescopes, each with an Aquila spectrograph which gave most of the observations and cover the wavelength range of approximately to with a resolution of . The majority of our spectra had exposure times of s, s, s, s. The shorter exposure times were employed to ensure that the H line did not saturate to enable high-fidelity fitting of this complex, and longer exposures were used to give good signal-to-noise for the rest of the spectrum. The longer exposure time were necessitated as the classical novae faded. By d, all our classical novae were typically observed with an exposure time of s.
2.2 Major campaigns
The time-sampling we have on each of the three major campaigns discussed in this paper differ qualitatively, and as such the insights we gain from each differs accordingly. We summarise each campaign in Table 2.
V5668 Sgr erupted 6 years ago, and we have data spanning most of the intervening time. This allows us to trace the different components over broad changes, and enables quantitative comparisons between early spectra and later analogues. We were particularly fortunate that this classical nova erupted just after the system emerged from behind the sun, allowing for several months of consistent follow-up observations.
For V906 Car, our campaign was focused on dense time-sampling for the first three weeks, with somewhat sparser observations beyond this. The strength of this campaign is that we were able to capture and precisely time (to within hundreds of seconds) the exact nature of certain early changes to the line profiles.
Our coverage of YZ Reticuli was a hybrid of these two extremes, with a virtually uninterrupted sequence of nightly spectra captured across the four months between d and d. This enabled us to ‘crack the code’, and determine that a particular set of five Gaussian components (two pairs and an additional component) could satisfactorily explain the entire progression of its spectral changes over several months (McLoughlin et al., 2021). We used this model as a template to aid understanding of V5668 Sgr and V906 Car, and discuss the similarities and differences between these three examples of the varied field of objects that is classical novae.
| V5668 Sgr | V906 Car | YZ Ret | |
| First spectrum | 2015-03-20 | 2018-03-25 | 2020-07-15 |
| Last spectrum | 2020-10-01 | 2020-12-28 | 2021-01-28 |
| Discovery JD | 2457097.134 | 2458193.819 | 2459038.670 |
| Aquila spectra | 2792 | 3166 | 5226 |
| LHires spectra | 1 | 5 | 36 |
| Total exposures (h) | 304 | 172 | 593 |
2.3 Data reduction
The data reduction pipeline used is called endeavour, and it performs the necessary dark subtraction, flat-fielding and wavelength calibration to produce one-dimensional output spectra from the input two-dimensional CCD data. We then use a bespoke spectroscopic analysis tool called poirot to perform the heliocentric correction and then carry out fitting, following the same protocols as those detailed in section 2.6 of McLoughlin et al. (2021). The data are not photometrically calibrated, and so for visual consistency all the plots in this paper are normalised to unity.
3 Timing phase transitions for V906 Car
The existence of distinct phases has been known for some time, as mentioned in Section 1. Here, with an intensive follow-up campaign for the first three weeks after V906 Car erupted, we are able to quantify the duration of transitions between these phases, shedding light on the underlying physical mechanisms driving the observed changes in the optical spectroscopy.
3.1 Timing the high-velocity absorption in V906 Car
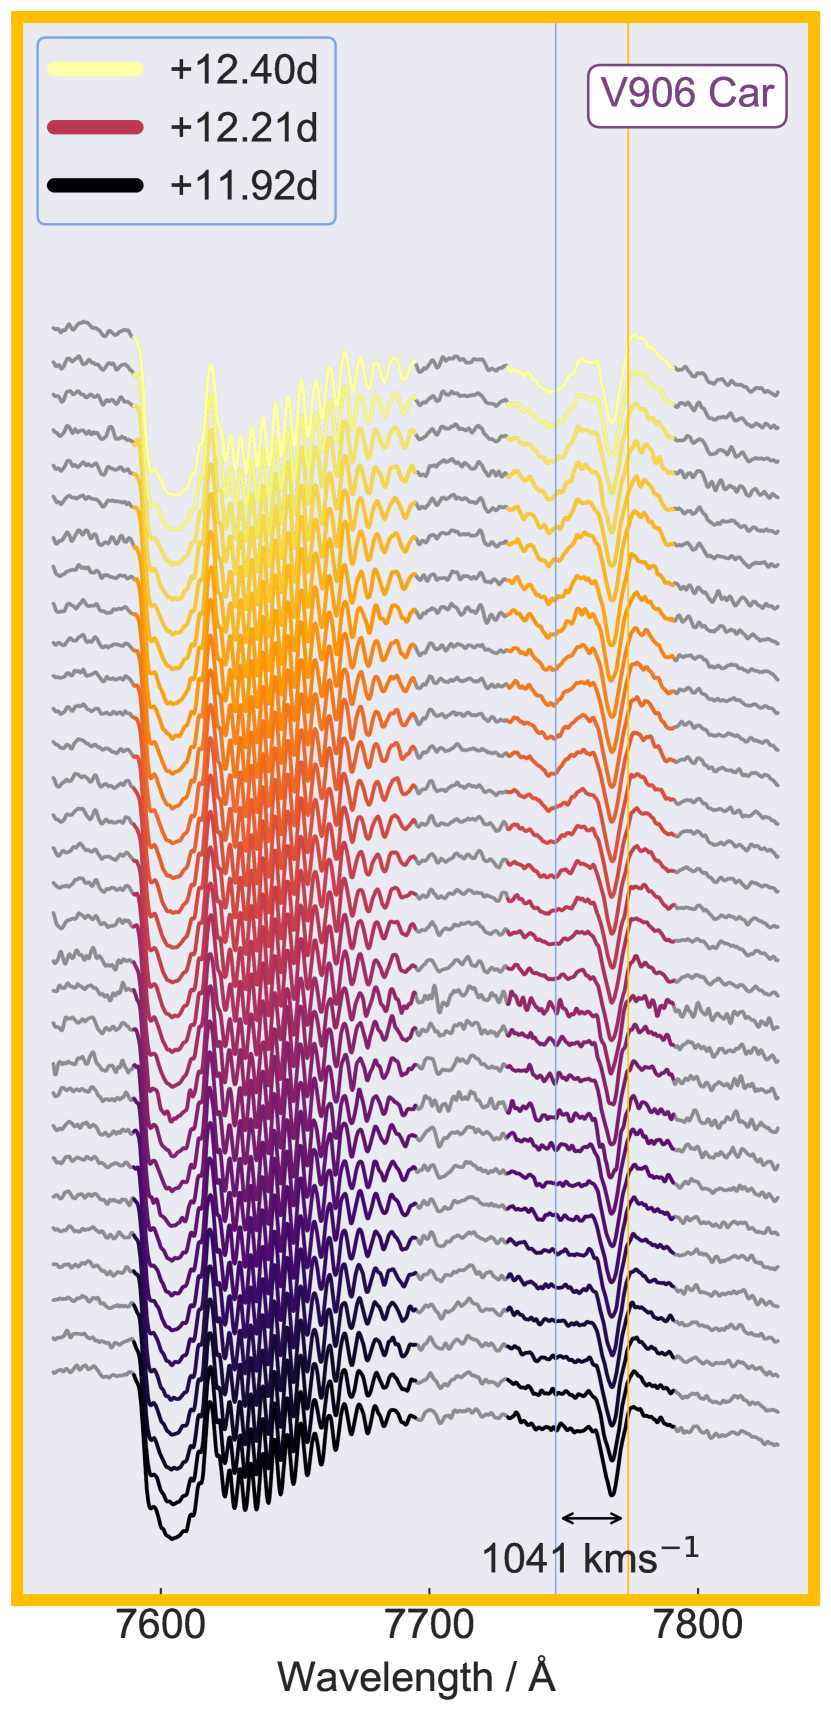
Figure 2 shows the early evolution of the [O i] complex alongside the telluric-A band (included to show stability of the wavelength calibration). Time runs from bottom to top, and the whole series lasts only half a day. In this time, the principal absorption component at () stays relatively steady, whilst a new and higher-velocity absorption complex appears at (), shown with a fiducial vertical line. The last non-detection of the secondary absorption is at d, and by d there is a clear detection. We are thus able to constrain the duration of this rapid phase transition to hours; Aydi et al. (2020b) had noticed such a transition for H and H to have occurred in their spectra taken a day apart.
3.2 Timing the jet phase onset in V906 Car
While it has been well-understood for many years that classical novae can quickly transition from single to multiple absorption, we believe these observations constitute the finest time-resolution yet for timing the transition.
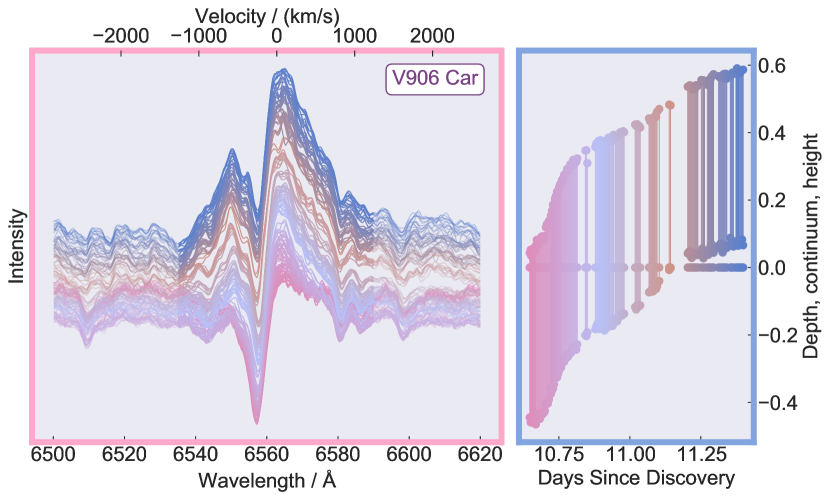
Figure 3 shows the sudden onset of significantly increased emission in V906 Car. The left panel shows the spectra stacked with time increasing upwards, normalised from zero to one, while the right panel shows (with the corresponding colour for each spectrum) the depth of absorption and height of emission relative to that normalisation. Each vertical line in the right panel represents a single observation. The lower end of each vertical line represents the depth of the low-velocity absorption component, while the upper end is set to the height of the emission peak. This then shows that over the course of only half a day between d and d, there is a transition from predominantly absorption to predominantly emission. At the end of this sequence, the low-velocity absorption component is still present, but the minimum is now above the continuum level, due to the immense emission at that same wavelength.
The emission is hard to fit well while the P-Cygni absorption is present. As explained in Section 1.2, McLoughlin et al. (2021) found that five emission Gaussian components accurately fitted the H complex of classical nova YZ Reticuli, and further showed that these five components split naturally into a fast-moving pair, a slow-moving pair, and a single additional central emission line. The pairs were then identified as representing jets and an accretion disc respectively, while the additional emission, which was less dynamically significant, and presumed to be emanating from the slow-moving spherical ejecta. With the diminishing of the absorption systems in V906 Car by d, we obtain an uncontaminated view of the emission profile, revealing an emission complex that is well fit by this jets and accretion disc model. We therefore infer that, since the qualitative shape of the emission does not significantly change between d and d, the fresh emission shown in Figure 3 is most likely due to the jets and accretion disc just as in YZ Reticuli in McLoughlin et al. (2021).
There are two plausible explanations for this sudden onset of H emission in the context of jets in V906 Car. One is that it takes a certain amount of time for the recently ejected material in the immediate vicinity of the eruption to be processed down the accretion disc and then launched as jets. In this scenario, one would expect to see the accretion disc emerging prior to the jets being formed; in the right-hand panel of Figure 3, we note a distinct change in the gradient of growth of emission occurring at d and speculate that this may mark the onset of jets.
The second possible conjecture is that the disc, fuelled by the recently ejected material, immediately forms jets which, initially buried in the heavily absorbing shell-like ejecta, emerge at this epoch and become spectrally significant.
3.3 Evolution of nitrogen and oxygen in V906 Car
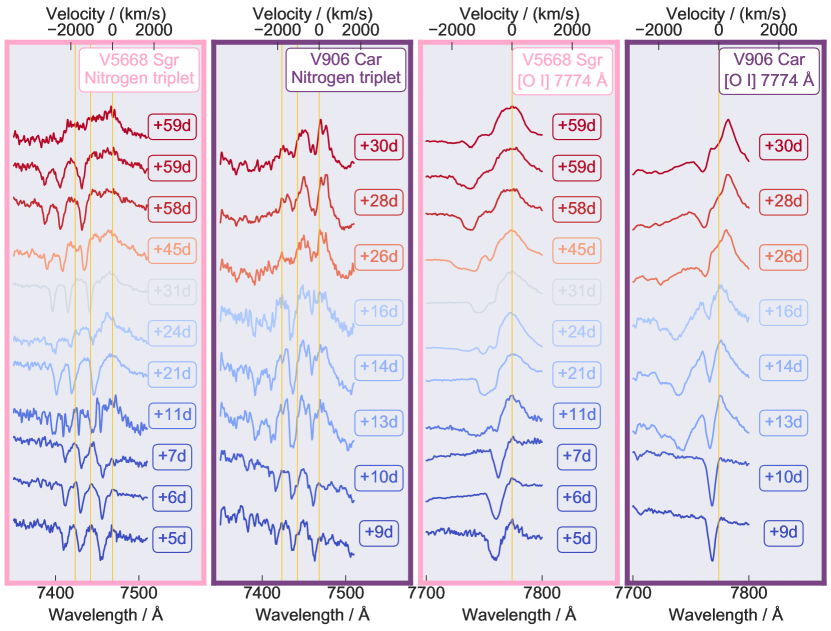
The second panel in Figure 4 displays the evolution of the nitrogen triplet (, , and ) as it moves from absorption through to emission. From d and beyond, we note hints of splitting in the peaks of some of these lines. Although this probes the limit of sensitivity given the signal-to-noise in this faint complex, splittings of are suggested. These spectra also serve as a reference for the discussion of sudden changes in V5668 Sgr in Section 4.4.
In the right panel of Figure 4, we show the progression of the O I complex of V906 Car. Perhaps more clearly than in the equivalent nitrogen panel, the oxygen low-velocity absorption line moves to increasingly blue-shifted wavelengths over time. We then see the commencement of emission between d and d, which mimics the behaviour shown for the H complex in Figure 3.
4 Timing phase transitions for V5668 Sgr
Figure 5 shows the progression of the H complex of V5668 Sgr through the several phases, discussed in this section. The three distinct phases that we focus on each approximately span a year in this classical nova; in the following sections, we consider each in turn. We then comment on the rapidly evolving nitrogen triplet, and contrast this with that observed in V906 Car in Section 3.3.
4.1 V5668 Sgr: Initial jets and accretion disc
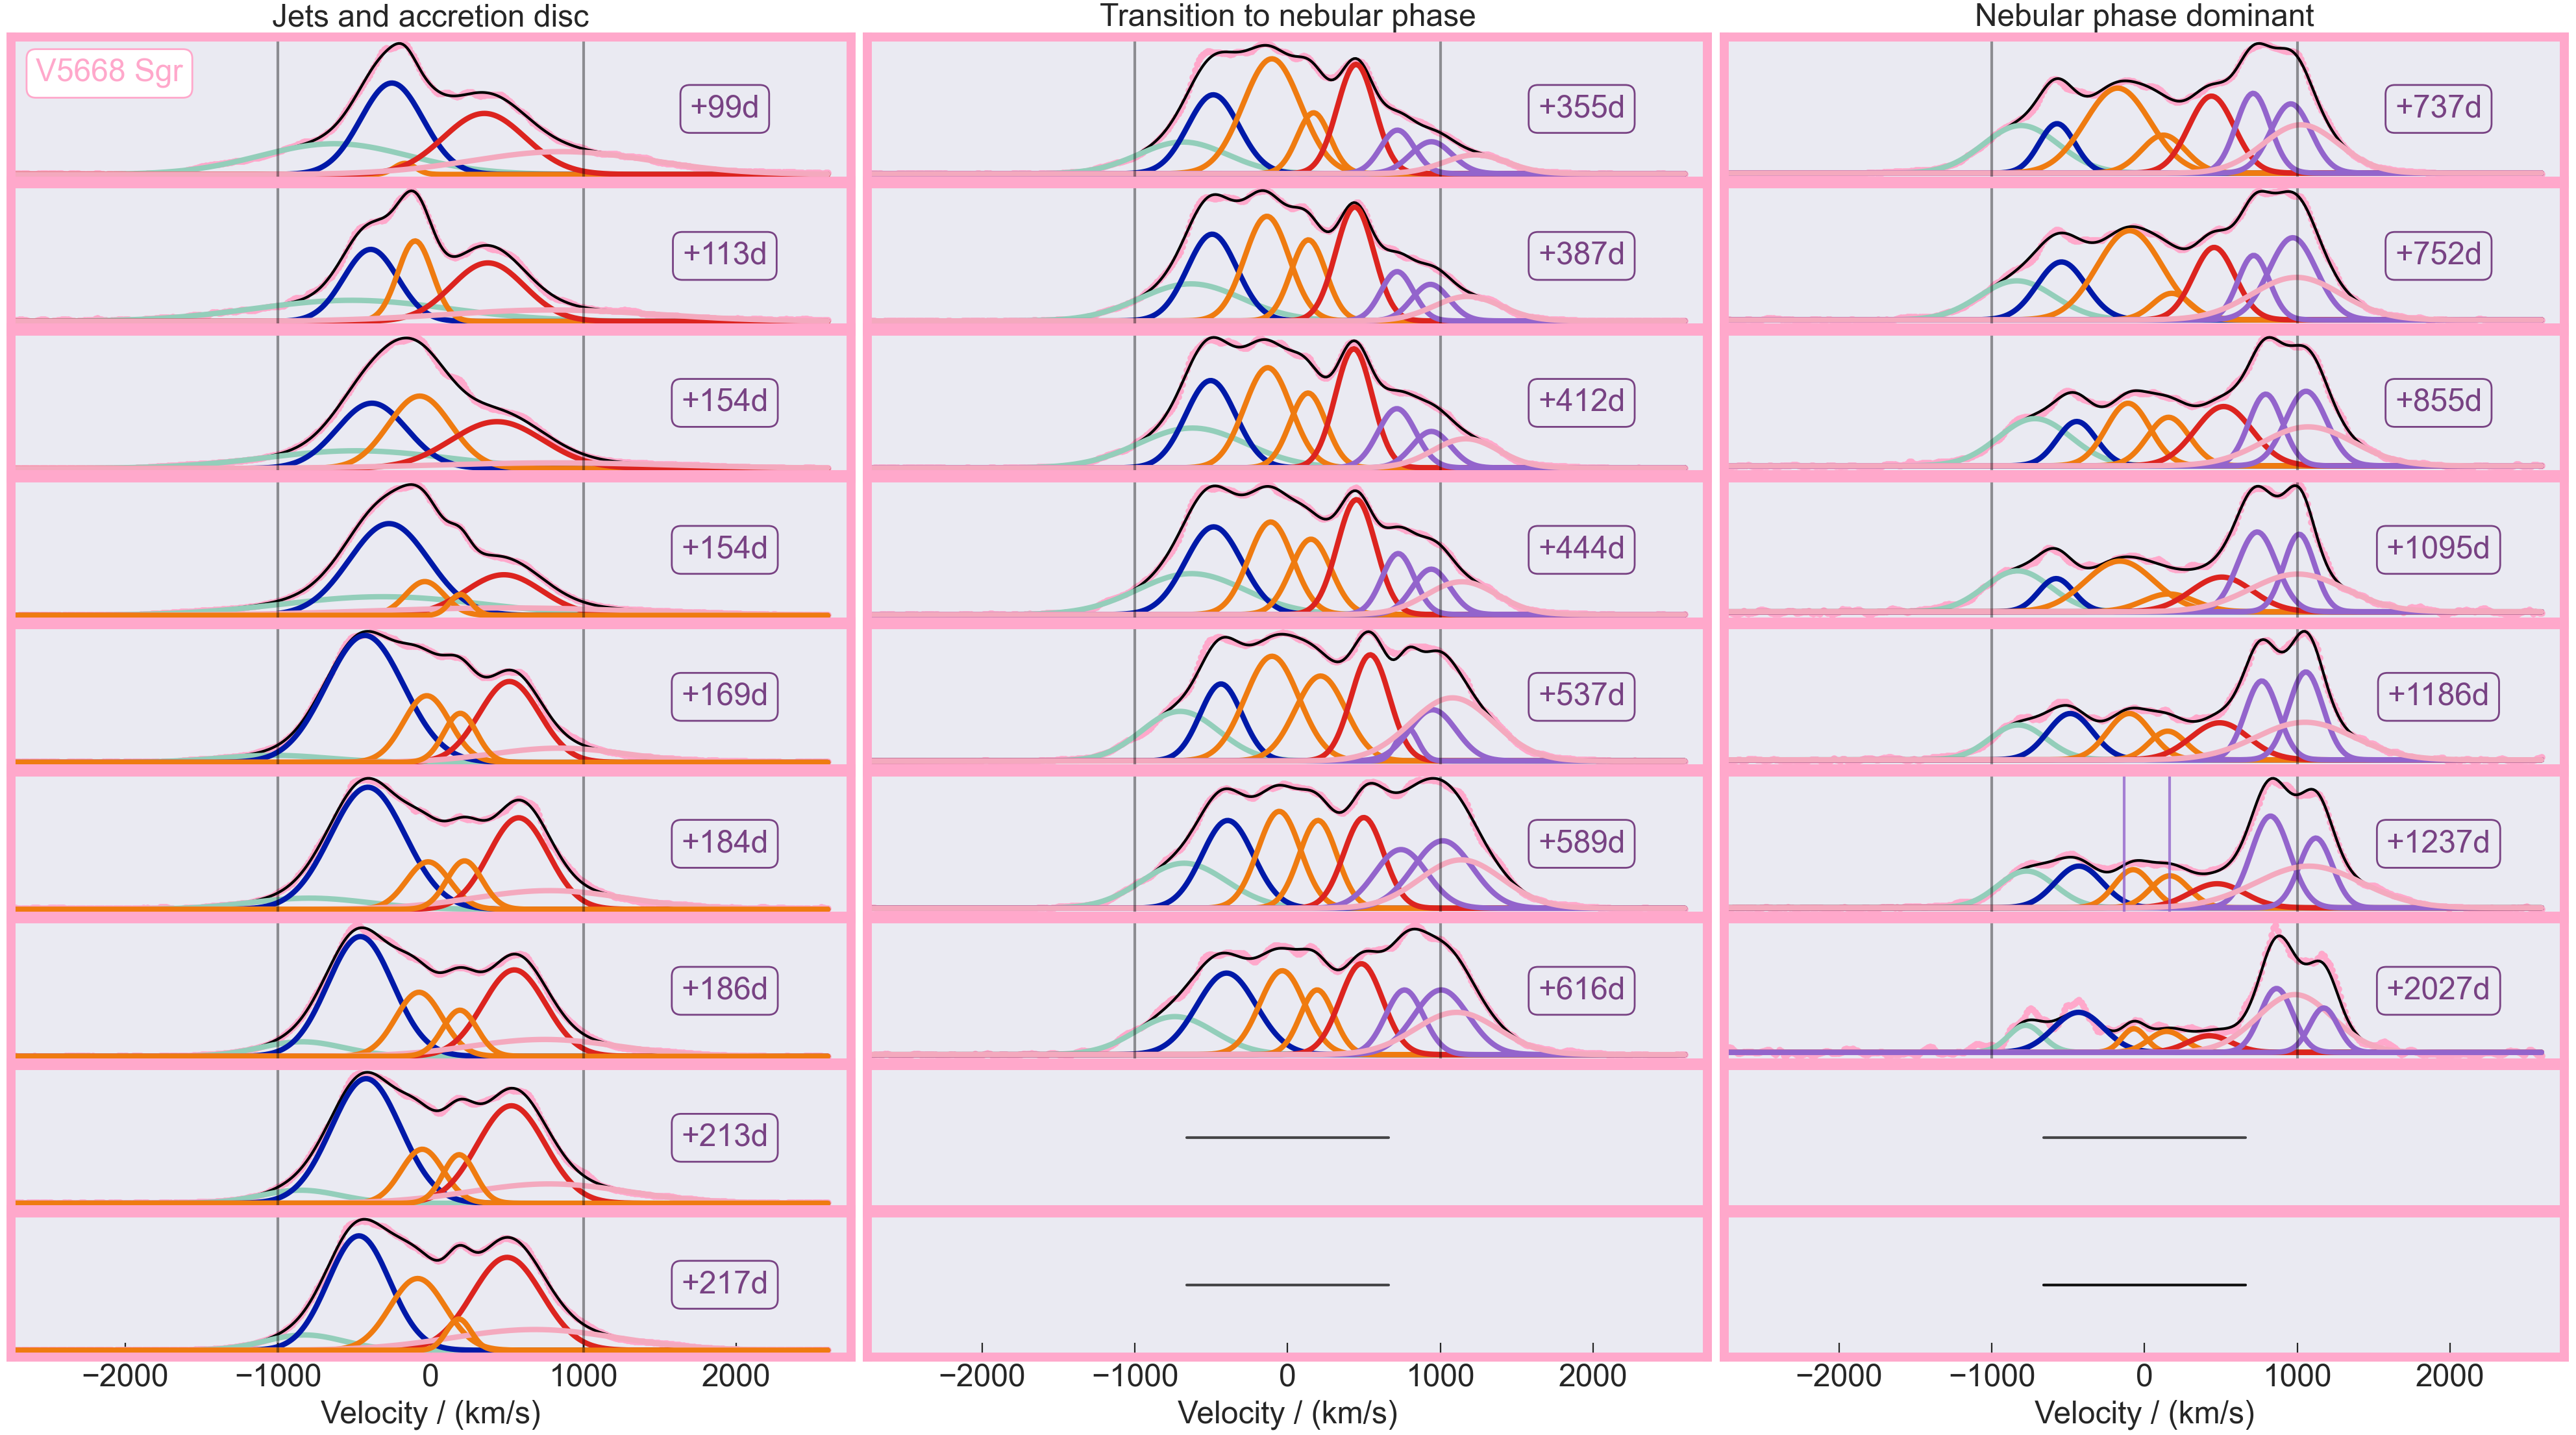
Here we apply the same model developed in McLoughlin et al. (2021), and discussed in Section 1.2, consisting of a fast-moving pair of emission lines, a slow-moving pair, and additional central Gaussians, to the H complex of V5668 Sgr.
The fits shown for the first spectra in the first column of Figure 5 show a remarkably similar set of Gaussian components to those observed in YZ Reticuli in McLoughlin et al. (2021). In all cases, we removed spectra that were in any way compromised, for example by the onset of clouds or by saturation in the H complex. The separation of the fast-moving pair of Gaussians is too fast to be plausible as material orbiting the white dwarf, yet far enough away to be cool enough to radiate Balmer H emission (i.e. given the continued nuclear burning at the surface and temperatures in excess of K). We therefore infer that these spectra of V5668 Sgr also represent anti-parallel jets (shown in turquoise and pink), and an accretion disc (blue and red), with an additional component (orange) perhaps formed in a shell-like outflow. Initially, this additional component does not account for a significant proportion of the flux relative to the far stronger jet and disc signatures. However, by d, the disc has begun to weaken in emission, and the jets have declined slightly too.
By d, we begin to require two additional Gaussian components (other than the jets and disc) to fit the profiles well. Figure 5 shows d twice: once with and once without an extra component to show its inclusion is necessary to obtain a close fit. The close similarity between these two additional components of H and the nebular nitrogen lines which appear later (see Section 4.2) suggests that these are formed in the ejected shell, which is supported by [N ii] 6584 Å rest-frame filtered imaging observations reported by Slavin et al. (1995) for several old classical nova remnants.
4.2 V5668 Sgr: Transition to nebular phase
The middle column of Figure 5 approximately spans the second year after eruption. During this time, additional lines appear to the red of the rest wavelength. We use the latest time spectra to get an accurate initial guess for the central wavelength of the extra components, and find that they are consistent with being a double-peaked [N ii] line. These spectra are well fit by the same set of six Gaussian components as those fitting the spectrum at d, but require the addition of two nitrogen lines ([N ii] 6584 Å). With the goal of using the H complex alone to determine the phase of a classical nova, this change would provide a straightforward marker for the onset of the nebular phase. At this point, there is still comparable flux coming from H, and so there is not a distinct moment at which the nebular lines begin to dominate.
4.3 V5668 Sgr: Nebular phase dominant
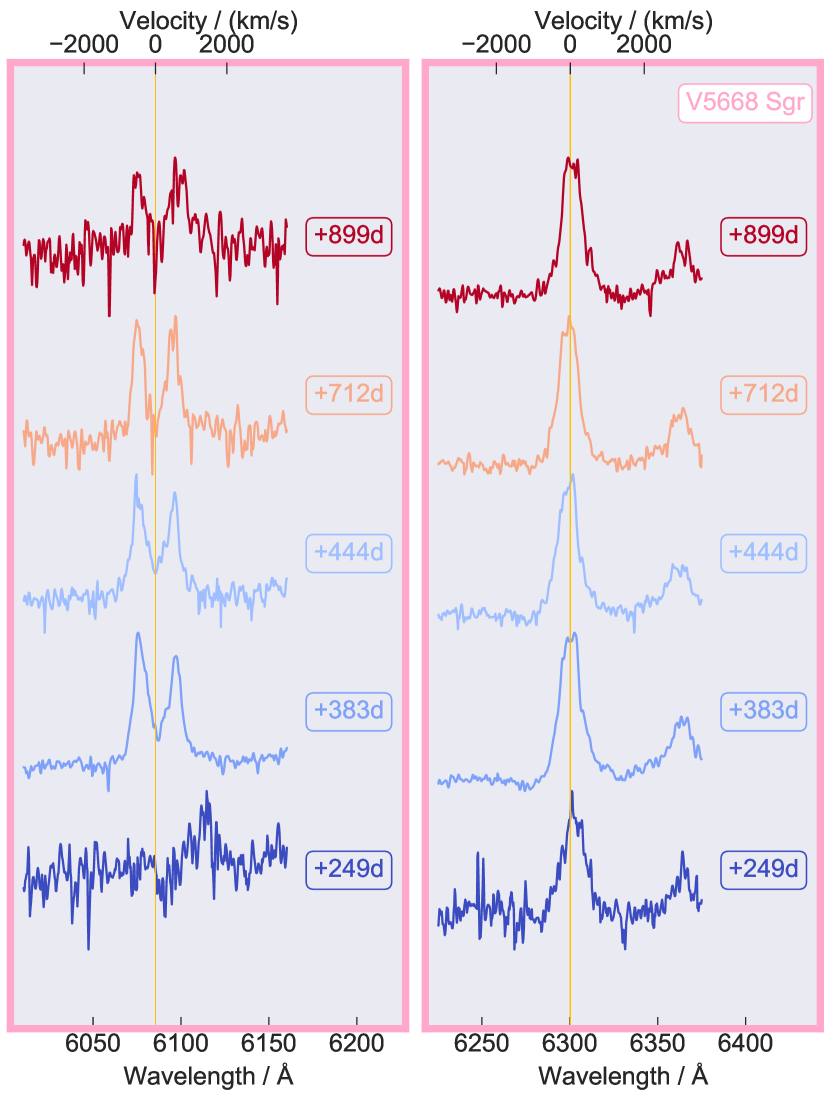
In the third column of Figure 5, the nebular phase begins to dominate. By d the [N ii] profile gives the strongest emission in this wavelength range, and by d, nitrogen is totally dominant. Gehrz et al. (2018) identify the presence of the high-excitation forbidden coronal line of [Fe vii] 6085 Å. Figure 6 demonstrates the arrival and departure times of the [Fe vii] 6085 Å line in our data; the [O i] 6300 Å is present throughout the existence and demise of the [Fe vii] 6085 Å line. The [Fe vii] 6085 Å emission is contemporaneous with the nitrogen lines shown in Figure 5 (in purple), which begin to emit strongly after approximately one year since detonation. Unlike these nitrogen lines, which establish themselves as the strongest lines in our optical spectra after d, the [Fe vii] 6085 Å line dwindles in comparison to H at late times.
The [N ii] lines have the same radial velocity as the two additional components of H, shown in Figure 5 by two purple fiducial vertical markers. The nitrogen only becomes important compared to H at late times once the density has decreased sufficiently, since it is a forbidden transition; by this time, the strength of the H equivalent pair of lines has diminished.
4.4 V5668 Sgr: evolution of nitrogen and oxygen
The left panel of Figure 4 shows the progression of the nitrogen triplet (, , and ) in V5668 Sgr. What is fascinating about this is the suddenness of the disappearance of absorption lines between two spectra both taken on d. Using our time-resolved spectroscopy, we can put an upper bound on the duration of this phase transition of h. The absorption was not present in any of the subsequent spectra.
There is a trend in the radial velocity of nitrogen absorption lines, which moves to higher speeds as time progresses between d () to d (). In the very early spectra taken before d though, it decreases in radial speed, which we discuss in more detail below. Our spectrum taken at d shows at least two distinct features, a narrow low-velocity component at and a broader high-velocity complex between and . It is therefore likely the dominant line in our later spectra is related to the high-velocity component, rather than a drastically shifted low-velocity component.
The third panel of Figure 4 follows the O I line through a series of changes. It starts off at d and d with a single low-velocity P-Cygni absorption feature with a speed of along the line-of-sight. This then slows, reaching a minimum speed of on d, before progressively increasing in blue-shift up to a maximum of on d. This pattern of slowing before continuing to advance to the blue, which is also present in our data of this nitrogen complex, has previously been recorded in V906 Car by Aydi et al. (2020a), and is only apparent when spectral data are captured close to or before optical maximum. V5668 Sgr has many large-scale jitters in the early light curve (Figure 1), and this is probably why we are able to see this early ‘retrograde’ pattern.
From d, the low-velocity component is joined by a high-velocity system, with a wide range of absorption velocities. This high-velocity absorption system of V5668 Sgr was the subject of a thorough study with high-resolution data (Tajitsu et al., 2016), which studied a snapshot of the Balmer lines of hydrogen and other metal lines, and measured the precise wavelengths of various narrow components within the complex.
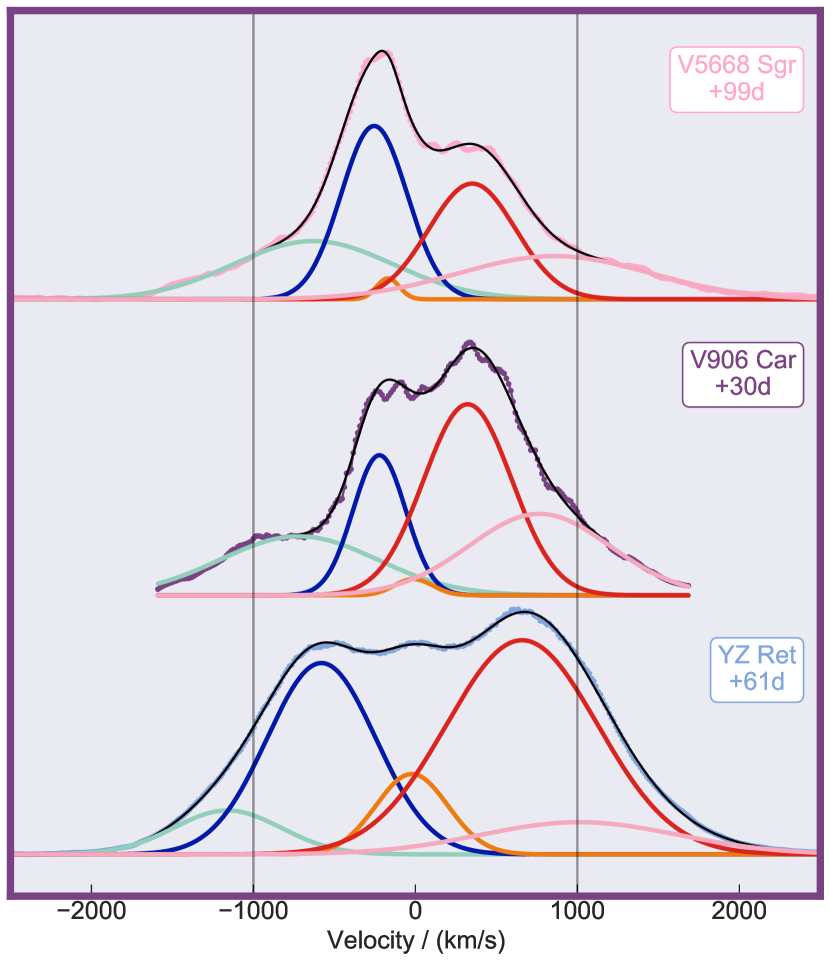
5 Overview: A dynamical model for nova phases
Figure 7 shows the striking similarity between three seemingly very different eruptions. For each of these systems, we have coloured the putative jet components in turquoise and pink, with the accretion disc in blue and red. The jet speeds differ substantially, although we cannot here separate the effects of inclination angle from the actual rest frame jet-launch speed.
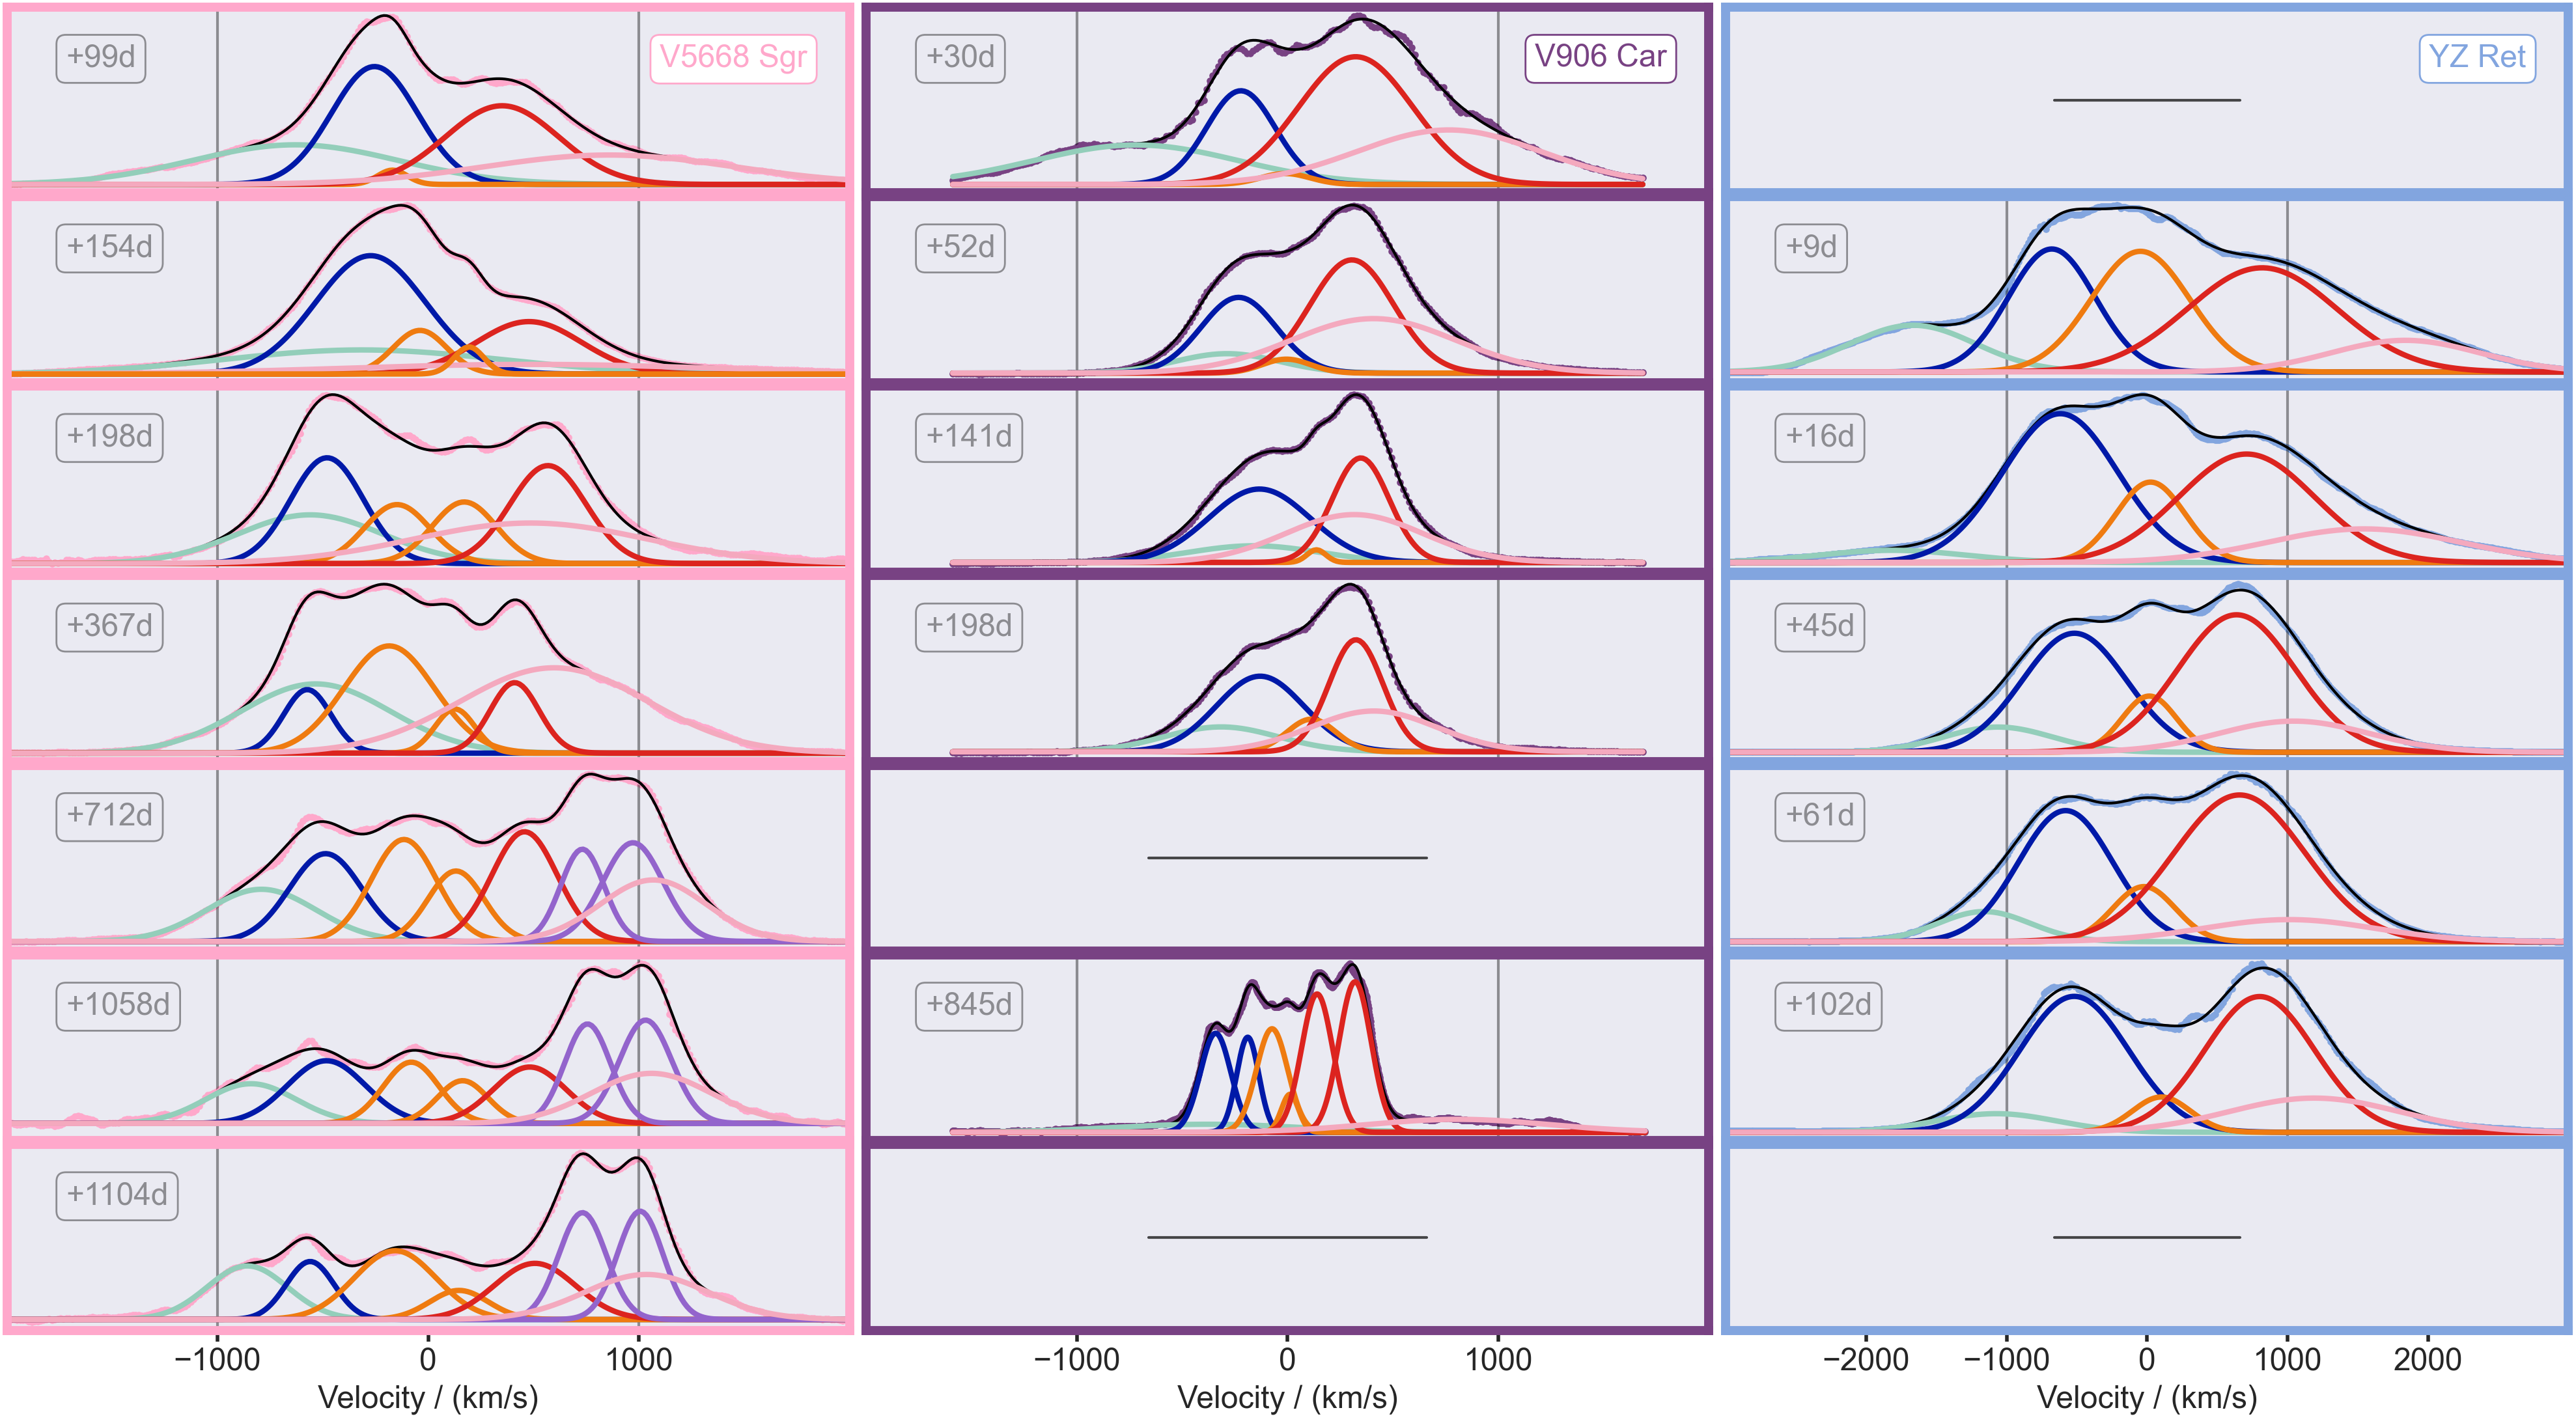
5.1 Onset of jets and accretion disc in V906 Car
Our observational campaign for V906 Car focused keenly on the first three weeks, which made it possible to capture several key early transitions in the spectroscopic development of this classical nova. However, as shown in panels two and four of Figure 4, the emerging emission spectrum is interspersed with several highly variable absorption systems during the first month following eruption. In Figure 8 therefore, we begin fitting the emission complex for V906 Car (middle column) from d, by which time the complex is well-fit by the standard five emission Gaussians model we previously identified as jets and accretion disc for YZ Reticuli and V6568 Sgr in McLoughlin et al. (2021). This fit remains accurate at least until d. Following Section 3.2 where we discuss the onset of substantial emission in V906 Car, it is reasonable to assume that the emission complex that emerges suddenly around d would also, in the absence of complex absorption systems, be well-fit by the same model as the one which remains in place from d to d. We therefore feel confident placing V906 Car in the collection of classical novae which display jets and an accretion disc in their H profiles, and believe that this is the emission responsible for the initial rise in H flux from d to d.
5.2 An updated prescription for classical nova optical evolution
There is a small but growing sample of classical novae which show jets and an accretion disc in their H spectra, which are the two examples we have presented in this paper (V906 Car, V5668 Sgr), together with the two in McLoughlin et al. (2021) (YZ Reticuli and V6568 Sgr, in their figures 3 & 8 respectively). We therefore suggest an update to the traditional physical model underpinned by optical observations. At first, there is a P-Cygni spectrum, with a relatively low velocity absorption component on the order of hundreds of (the LVC), most likely associated with a slowly-ejected shell. This is promptly followed by the arrival of secondary absorption, with far higher radial velocities on the order of thousands of (the HVC), which often consists of multiple separate components. Very shortly after this, emission features originating from material at the base of jets and from the accretion disc emerge, taking only a few hours to push the minimum of the LVC absorption trough above the continuum level. The jets and the accretion disc appear to be precessing in YZ Reticuli, and similarly systematic follow-up of other classical novae may well yield similar results. At late times, nebular lines of forbidden transitions become strong, a process through which [N ii] took approximately a year to compete with H in V5668 Sgr, and approximately another year to become the dominant source of emission in our optical spectra.
5.3 Jets, not clumps, responsible for H-alpha spectra
What is most remarkable about the fits shown in Figure 8 is how well this model accounts for variability in the line profiles. It is not warranted to claim that mere “clumpiness” can account for all this complexity. While we do of course agree that the ejecta does form clumps of some description, as suggested by imaging of classical nova remnants (such as the ALMA imaging of V5668 Sgr by Diaz et al. (2018), though detailed conclusions are hindered by a lack of short UV-spacings), we believe that our data set shows that it is not necessary to invoke clumps in order to explain the complex profiles. Instead, a dynamical model consisting of jets, an accretion disc and a simple shell outflow is sufficient to explain the spectra from the early fading of absorption systems until the late nebular phase. Of course, the [N ii] lines need to be considered also, but they appear at late times, following the same dynamical prescription as the H shell, and as such are easily understood.
5.4 Implications for interstellar enrichment
Another interesting consequence of the developments to the jet model for nova outflows is that it informs our understanding of the interstellar enrichment capabilities of classical novae. Considering the ejection to take place from near the surface of the white dwarf, where the escape velocity is approximately given by which yields a value of around , in excess of the shell ejection speeds observed in the majority of systems which thus implies that these do not contribute significantly to the enrichment of the interstellar medium (ISM). In the jet paradigm however, material is not launched from the white dwarf surface itself but is instead launched from the accretion disc. Jet models based on young stellar objects show the jets to be launched from the co-rotation radius, where the Keplerian accretion disc angular speed matches that of the white dwarf spin, and these indicate that the jet speed is proportional to the Keplerian speed with a small, order-unity constant (Tzeferacos et al., 2013; Shu et al., 1994). For a classical nova with a canonical mass of and a spin period of s following the X-ray evidence hinted at by Osborne (2015), this gives as the Keplerian velocity of the disc at the co-rotation radius, and thus an approximate estimate for the jet speed in the frame of the eruption (here is the gravitational constant, is the enclosed mass and is the angular frequency). This speed is comparable with the jet launch speeds observed in YZ Reticuli and V6568 Sgr, of and respectively, given the uncertainty introduced by poorly constrained inclination angles.
The escape velocity from the co-rotation radius () of a canonical classical nova is given by , which is greatly reduced compared to that at the surface of the accretor and, crucially, is less than the likely jet launch speed for the fastest jets we observe (especially since observed radial speeds are lower than the nova-frame speeds by expected projection effects). The consequence of this is that classical novae with fast jets may therefore play a role in enrichment of the ISM. In the case of V5668 Sgr, the jets appear to last in excess of five years; in this time, the initial ejecta will have reached a distance of at least 1000 AU. The stellar mass density close to the Galactic centre is approximately pc-3, which, assuming typical stellar masses of , suggests an average distance between stars of AU. Therefore it seems likely that the jet ejecta of classical novae can indeed penetrate the surrounding ISM, increasing its enthalpy and temperature. With 100 classical novae per year in the Milky Way, and a typical mass ejection of around per nova (Yaron et al., 2005), the cumulative enrichment effect of classical novae on the Galactic ISM may be on the order of every billion years.
5.5 Prediction for spatially resolved spectroscopy
The sprouting of the lines of [N ii] 6584 Å (shown in purple in Figure 5) around at the anniversary of the explosion, and their resemblance to the central lines of H, is a reminder that detailed spectrally-resolved imaging of classical novae a few years after eruption would likely reveal structures that could confirm or refute the jets model. In the case of the B[e] star studied in Mehner et al. (2016), an 8 m class telescope (VLT) together with a modern IFU (MUSE) revealed a slender jet in the [N ii] 6584 Å line (their figure 8). With sensitive, high-angular resolution observations, it would be very instructive to see nitrogen-free H imaging, and to see which shells and which elongated outflows appear in emission lines besides hydrogen.
6 Conclusions
The designation of phases for the optical spectroscopic progression of classical novae has typically focused on relatively early-time absorption lines to elucidate what is happening specifically along the line-of-sight to the eruption (McLaughlin, 1956). However, a full understanding of the nature and evolution of the classical nova phenomenon necessitates sustained time-resolved studies beyond this regime. Traditionally, the H emission complex has been deemed too contaminated to be straightforwardly fit and understood. In this paper, we extend the sample of two classical novae in McLoughlin et al. (2021) to include two further classical novae, and show that a jets and accretion disc model for understanding the H emission is perhaps more widely applicable to classical novae than was previously imagined. With the sample size growing, we propose a simple addition to the standard sequence of events and phases in optical spectra and the way of understanding them. The variety of the classical novae now in the sample is encouraging, since it suggests that the jets and accretion disc model may be a feature of classical novae in general, rather than just restricted to one type.
We provide tight constraints on the timing of transitions between these classic phases, which lends support to the conjecture that jets and an accretion disc are key to understanding the optical emission of classical novae in the first thousand days.
We further speculate that thinking of the emission in terms of jets launched by an accretion disc rather than from the white dwarf surface could alter the relevant escape velocity, and may therefore allow for enhanced enrichment of the interstellar medium compared to what was previously thought possible from classical novae.
Beyond the spectroscopic evidence we have presented for these novae, independent support for our conjecture would come from a spatially-resolved spectroscopic image of these targets in a few years time, when the angular sizes would have grown sufficiently large to be well-matched to modern IFUs.
Such detailed evolving spectral behaviour now warrants development of a detailed underlying physical model. This would need to explain how the accretion process launches jets in the immediate aftermath of classical nova outbursts as well as the detailed observational features of the spectroscopic signals we have presented here and in McLoughlin et al. (2021). These include (a) the suddenness of the onset of emission (b) the coupled precession of the jet and accretion disc radial velocities (c) the persistence of jet emission for at least several years following the eruption.
It is possible that the pursuit of a physical model elucidating the launching of jets after the nova eruption in a system that, prior to the explosion did not show jets, may yield important insights on the astrophysical jet phenomenon as a whole. This may inform studies of systems which show similar behaviour, albeit on a variety of scales with a dynamical range of many orders of magnitude (including young stellar objects, microquasars and supermassive black holes).
Acknowledgements
A great many organisations and individuals have contributed to the success of the Global Jet Watch observatories and these are listed on www.GlobalJetWatch.net but we particularly thank the University of Oxford and the Australian Astronomical Observatory. DM thanks the STFC for a doctoral studentship, and Oriel College, Oxford, for a graduate scholarship. We acknowledge with thanks the variable star observations from the AAVSO International Database contributed by observers worldwide and used in this research.
Data availability
Light curve data for all our targets is made available by the AAVSO, at aavso.org. The data underlying this article were provided by the Global Jet Watch222www.GlobalJetWatch.net by permission. Data will be shared on request to the corresponding author with permission of the Global Jet Watch.
References
- A. Carr et al. (2020) A. Carr K. Said T. M. Davis 2020, ATel #13874: WiFeS follow-up observations of the naked-eye nova associated to MGAB-V207, http://www.astronomerstelegram.org/?read=13874
- Arai et al. (2016) Arai A., Kawakita H., Shinnaka Y., Tajitsu A., 2016, The Astrophysical Journal, 830,
- Aydi et al. (2020a) Aydi E., et al., 2020a, Nature Astronomy, pp 1–5
- Aydi et al. (2020b) Aydi E., et al., 2020b, The Astrophysical Journal, 905, 62
- Bailer-Jones et al. (2018) Bailer-Jones C. A. L., Rybizki J., Fouesneau M., Mantelet G., Andrae R., 2018, The Astronomical Journal, 156, 58
- Baluev et al. (2015) Baluev R. V., et al., 2015, Monthly Notices of the Royal Astronomical Society, 450, 3101
- Banerjee et al. (2015) Banerjee D. P. K., Srivastava M. K., Ashok N. M., Venkataraman V., 2015, Monthly Notices of the Royal Astronomical Society, 455
- Blundell et al. (2008) Blundell K. M., Bowler M. G., Schmidtobreick L., 2008, The Astrophysical Journal, 678, 47
- Coppejans & Knigge (2020) Coppejans D. L., Knigge C., 2020, New Astronomy Reviews, 89, 101540
- Corbett et al. (2018) Corbett H., Law N., Goeke E., Ratzloff J., Howard W., Fors O., del Ser D., Quimby R. M., 2018, The Astronomer’s Telegram, No. 11467, 11467
- Della Valle & Izzo (2020) Della Valle M., Izzo L., 2020, Astronomy and Astrophysics Review, 28
- Diaz et al. (2018) Diaz M. P., Abraham Z., Ribeiro V. A. R. M., Beaklini P. P. B., Takeda L., 2018, Monthly Notices of the Royal Astronomical Society, 480, 54
- Figueira et al. (2018) Figueira J., José J., García-Berro E., Campbell S. W., García-Senz D., Mohamed S., 2018, Astronomy & Astrophysics, 613, 8
- Gallagher & Starrfield (1978) Gallagher J. S., Starrfield S., 1978, Annual Review of Astronomy and Astrophysics, 16, 171
- Gehrz et al. (2018) Gehrz R. D., et al., 2018, The Astrophysical Journal, 858
- Hachisu & Kato (2012) Hachisu I., Kato M., 2012, Baltic Astronomy, 21, 68
- Hachisu & Kato (2019) Hachisu I., Kato M., 2019, The Astrophysical Journal Supplement Series, 242, 18
- Hounsell et al. (2011) Hounsell R., Darnley M. J., Bode M. F., Harman D. J., Helton L. A., Schwarz G. J., 2011, Astronomy & Astrophysics, 530, A81
- Jack et al. (2017) Jack D., et al., 2017, Astronomische Nachrichten, 338, 91
- Kato (2002) Kato M., 2002, in The Physics of Cataclysmic Variables and Related Objects. pp 595–604
- L. Izzo et al. (2020) L. Izzo et al., 2020, ATel 14048: UVES observations of Nova Reticuli 2020 during Minimal Science Operations show it is entering the nebular phase, http://www.astronomerstelegram.org/?read=14048
- McLaughlin (1956) McLaughlin D. B., 1956, Vistas in Astronomy
- McLoughlin et al. (2020) McLoughlin D., Blundell K. M., Lee S., 2020, Monthly Notices of the Royal Astronomical Society, 494, 743
- McLoughlin et al. (2021) McLoughlin D., Blundell K. M., Lee S., McCowage C., 2021, Monthly Notices of the Royal Astronomical Society, 503, 704
- Mehner et al. (2016) Mehner A., et al., 2016, Astronomy and Astrophysics, 585
- Molaro et al. (2016) Molaro P., Izzo L., Mason E., Bonifacio P., Della Valle M., 2016, MNRAS, 463, 117
- Osborne (2015) Osborne J. P., 2015, Journal of High Energy Astrophysics, 7, 117
- Pavana et al. (2020) Pavana M., Raj A., Bohlsen T., Anupama G. C., Gupta R., Selvakumar G., 2020, Monthly Notices of the Royal Astronomical Society, 495, 2075
- Rupen et al. (2008) Rupen M. P., Mioduszewski A. J., Sokoloski J. L., 2008, The Astrophysical Journal, 688, 559
- Schwarz et al. (2011) Schwarz G. J., et al., 2011, Astrophysical Journal, Supplement Series, 197
- Shara et al. (2018) Shara M. M., Prialnik D., Hillman Y., Kovetz A., 2018, The Astrophysical Journal, 860, 110
- Shu et al. (1994) Shu F., Najita J., Ostriker E., Wilkin F., Ruden S., Lizano S., 1994, The Astrophysical Journal, 429
- Skillman et al. (1997) Skillman D. R., Harvey D., Patterson J., Vanmunster T., 1997, Publications of the Astronomical Society of the Pacific, 109, 114
- Slavin et al. (1995) Slavin A. J., O’Brien T. J., Dunlop J. S., 1995, 353S Mon. Not. R. Astron. Soc, 276, 353
- Sokoloski et al. (2008) Sokoloski J. L., Rupen M. P., Mioduszewski A. J., 2008, The Astrophysical Journal, 685, 137
- Sokolovsky et al. (2020a) Sokolovsky K., Aydi E., Chomiuk L., Kawash A., 2020a, ATel #14043: Super-soft X-ray emission of Nova Reticuli 2020, http://www.astronomerstelegram.org/?read=14043
- Sokolovsky et al. (2020b) Sokolovsky K. V., et al., 2020b, Monthly Notices of the Royal Astronomical Society, 497, 2569
- Stanek et al. (2018) Stanek K. Z., et al., 2018, ATel #11454: ASAS-SN Discovery of a Possible, Very Bright Galactic Nova ASASSN-18fv, http://www.astronomerstelegram.org/?read=11454
- Strope et al. (2010) Strope R. J., Schaefer B. E., Henden A. A., 2010, Astronomical Journal, 140, 34
- Tajitsu et al. (2016) Tajitsu A., Sadakane K., Naito H., Arai A., Kawakita H., Aoki W., 2016, The Astrophysical Journal, 818, 1
- Tzeferacos et al. (2013) Tzeferacos P., Ferrari A., Mignone A., Zanni C., Bodo G., Massaglia S., 2013, Monthly Notices of the Royal Astronomical Society, 428, 3151
- Wee et al. (2020) Wee J., et al., 2020, The Astrophysical Journal, 899, 162
- Williams (1992) Williams R. E., 1992, The Astronomical Journal, 104, 725
- Williams (1994) Williams R. E., 1994, The Astrophysical Journal, 426, 279
- Williams & Mason (2010) Williams R., Mason E., 2010, Astrophysics and Space Science, 327, 207
- Williams et al. (1991) Williams R. E., Hamuy M., Phillips M. M., Heathcote S. R., Wells L., Navarrete M., 1991, The Astrophysical Journal, 376, 721
- Yaron et al. (2005) Yaron O., Prialnik D., Shara M. M., Kovetz A., 2005, The Astrophysical Journal
- de Gouveia Dal Pino (2005) de Gouveia Dal Pino E. M., 2005, in AIP Conference Proceedings. AIP, pp 183–194, doi:10.1063/1.2077183, http://aip.scitation.org/doi/abs/10.1063/1.2077183