Deep Clustering based Fair Outlier Detection
Abstract.
In this paper, we focus on the fairness issues regarding unsupervised outlier detection. Traditional algorithms, without a specific design for algorithmic fairness, could implicitly encode and propagate statistical bias in data and raise societal concerns. To correct such unfairness and deliver a fair set of potential outlier candidates, we propose Deep Clustering based Fair Outlier Detection (DCFOD) that learns a good representation for utility maximization while enforcing the learnable representation to be subgroup-invariant on the sensitive attribute. Considering the coupled and reciprocal nature between clustering and outlier detection, we leverage deep clustering to discover the intrinsic cluster structure and out-of-structure instances. Meanwhile, an adversarial training erases the sensitive pattern for instances for fairness adaptation. Technically, we propose an instance-level weighted representation learning strategy to enhance the joint deep clustering and outlier detection, where the dynamic weight module re-emphasizes contributions of likely-inliers while mitigating the negative impact from outliers. Demonstrated by experiments on eight datasets comparing to 17 outlier detection algorithms, our DCFOD method consistently achieves superior performance on both the outlier detection validity and two types of fairness notions in outlier detection.
1. Introduction
Utility-oriented machine learning systems have trickled down to the real-world in aid of high-stake decision making in various fields. The inherent bias brought by unbalanced data and embedded in those models, if not controlled with specific algorithmic design, will inevitably backfire and deteriorate the existing social barricades. Due to the rising societal concerns, fairness in machine learning has received increasing attention in recent years (Chouldechova and Roth, 2018; Hashimoto et al., 2018; Kearns et al., 2019; Li et al., 2020b). Outlier detection is one of the most vulnerable domains in face of the lurking algorithmic unfairness. The task is to find rare or suspicious individuals that deviate from the majority. Due to the strong correlation between the minority and outliers, an outlier detector might easily suffer from discrimination against certain sensitive attributes like ethnicity or gender. For instance, in credit risk assessment, credit card applicants may suffer from a biased credit scoring algorithm against certain sexuality (Evelina Nedlund, 2019); racial equality will deteriorate when criminality detection heavily hinges on the object’s appearance (NEWS, 2020). To recognize the significance of equality preservation, we need to address the urgent demands of fairness-aware outlier detection methods. However, this recently-emerged task has received little attention before 2020 and has not been fully addressed yet.
On a colloquial formulation, unsupervised fair outlier detection aims to find potential outlier candidates that substantially differ from the majority instances while maintaining insignificant to sensitive attribute subgroups111In the paper we use ”sensitive attribute subgroup”, ”sensitive subgroup”, and ”protected subgroup” interchangeably. (i.e., gender or ethnicity) (Davidson and Ravi, 2020). To our best knowledge, only two methods exist along this direction and are both proposed in 2020. Deepak and Abraham (2020) propose the FairLOF algorithm, which improves classical LOF (Breunig et al., 2000) in regards to three heuristic principles: neighborhood diversity, apriori distribution, and attribute asymmetry, to prevent an unfair sensitive subgroup distribution among top-ranked outlier candidates. Shekhar et al. (2020) design FairOD, a deep model using a standard autoencoder component for self-reconstruction with the statistical parity and group fidelity as fairness constraints to ensure the majority protected subgroup share the same outlier rate as the minority one.
Although the above attempts have made pioneering progress in addressing this newly emerging yet crucial problem, we see some limitations in the existing work that could be further improved. FairLOF operates on the original feature space, which limits its capacity towards detection accuracy and fairness degree. Since the original feature space often does not expose much information on the underlying data pattern, it adds difficulty to separate anomalies from inliers. FairOD employs the classic autoencoder for representation learning via minimizing the self-reconstruction loss and uses it as the outlier detection criteria. However, such a deep embedding treats all samples indifferently. It does not filter the noise and disruptions that outliers may impose on the feature space, thus preventing itself from pursuing high performance. Moreover, existing methods evaluate fairness degree only in terms of the outlier rates in different groups, while ignoring the disparate predictive validity between groups, which could also lead to unjust results. Consider the case where an outlier detector returns a consistent outlier rate for two sensitive subgroups, but the true positive rates for two groups are and , respectively. The detector yields a huge performance penalty on the second subgroup, yet such a performance gap is unrecognizable under the existing evaluative phase. Finally, existing methods mostly perform evaluations on a limited number of benchmarks, including synthetic datasets. An extensive exploration with more real-world datasets is heavily needed.
To solve the above challenges, we propose a novel Deep Clustering based Fair Outlier Detection (DCFOD) method. Inspired by the reciprocal relationship between outlier detection and clustering (Chawla and Gionis, 2013; Liu et al., 2019), we employ a joint deep clustering/outlier detection framework and propose weighted representation learning towards each instance. The degree of outlierness for each individual is associated with the distance to its nearest cluster centroid. The dynamic weight module enhances outlier detection validity by re-emphasizing likely-inliers’ contributions while mitigating outliers’ negative impacts. To simultaneously ensure fairness adaptation, we utilize fairness-adversarial training with a min-max strategy to conceal sensitive information and achieve group fairness, while preserving the feature validity on the embedded representation. In terms of fairness evaluation, we propose two metrics to measure the degree of fairness, based on the diagnostic ability gap among subgroups and the subgroup distribution drift among top-ranked outliers. To sum up, we underline our contributions as follows:
-
•
We address the newly-emerged fair outlier detection problem and propose a novel Deep Clustering based Fair Outlier Detection (DCFOD) framework.
-
•
Our DCFOD adopts representation learning and fairness-adversarial training, with a novel dynamic weight in regulation of negative impacts from outlier points, to obtain a downstream task-favorable representation while simultaneously ensuring improvement in fairness degree.
-
•
We strengthen the fairness measurements in the context of outlier detection by proposing two fairness metrics that test subgroup-wise agnostic ability gap and subgroup distribution drift in detected outliers.
-
•
Extensive experiments on eight real-world public datasets demonstrate evident edge of DFCOD on all metrics in competitions with 17 unsupervised outlier detection methods, including recently-proposed fair outlier detection methods and other conventional outlier detection algorithms.
2. Related Work
In this section, we illustrate the related work in terms of unsupervised outlier detection, deep outlier detection, fair machine learning, and recent advances in fair outlier detection.
Unsupervised Outlier Detection. Typical unsupervised outlier detection algorithms calculate a continuous score for each data point to quantify its outlier degree. Based on diverse assumptions, a number of outlier detection methods have been proposed, including linear models (Shyu et al., 2003; Schölkopf et al., 2001), proximity-based models (Breunig et al., 2000; Tang et al., 2002; He et al., 2003; Goldstein and Dengel, 2012), and probability-based models (Kriegel et al., 2008; Li et al., 2020c). Moreover, some studies purse outlier detection by subspace learning (Kriegel et al., 2009), low-rank (Zhao and Fu, 2015), matrix-completion (Kannan et al., 2017), and random walk (Pang et al., 2016). Since most above-mentioned methods rely heavily on various assumptions, ensemble-based outlier detectors are brought up to alleviate assumption dependence, including iForest (Liu et al., 2008), bi-sampling outlier detection (Liu et al., 2016), feature bagging (Lazarevic and Kumar, 2005), lightweight online detector of anomalies (Pevnỳ, 2016), and clustering with outlier removal (Liu et al., 2019).
Deep Outlier Detection. Recent advances in representation learning (He et al., 2016; Krizhevsky et al., 2017) have demonstrated that deep neural networks are capable of extracting effective features for downstream tasks. The key in deep outlier detection is to seek a self-supervised signal for representation learning. Autoencoder (An and Cho, 2015) and variational autoencoder (Kingma and Welling, 2013) are two widely used frameworks that optimize the self-reconstruction loss. Their variants include robust autoencoder with sparse constraint (Zhou and Paffenroth, 2017), autoencoder ensemble (Chen et al., 2017) and stacked autoencoder (Wan et al., 2019). Other state-of-the-art deep approaches include random mapping (Wang et al., 2020), which predicts proximity information in a randomly projected space; generative adversarial networks (Zenati et al., 2018; Li et al., 2018), which focuses on generating fake outliers by min-max training; predictability models (Liu et al., 2018), which predicts the current data instances using the representations of the previous instances within a temporal window. More details on deep outlier detection can be found in this recent review (Pang et al., 2021).
Fair Machine Learning and Fair Outlier Detection. According to various application scenarios, abundant fairness notions have been proposed, including individual fairness (Dwork et al., 2012), where similar individuals are expected to be treated in a similar fashion; group fairness (Li et al., 2021; Dwork et al., 2012; Kleinberg et al., 2016), where samples in different groups ought to be treated equally; subgroup fairness (Kearns et al., 2018), which extends group fairness by demanding fairness on combinations of groups (i.e. subgroups); causality-based fairness (Kusner et al., 2017; Chiappa, 2019), where causal inference on multiple features is conducted to track the relationship between sensitive attributes and samples while mitigating historical bias. Aside from fairness definitions, debiasing techniques can be categorized into three main approaches: pre-processing (Feldman et al., 2015), in-processing (Zemel et al., 2013; Madras et al., 2018) and post-processing (Lohia et al., 2019). The deep representation learning is a typical in-processing method that incorporates fairness constraints into the model optimization objectives to obtain an ideal model parameterization that maximizes performance and fairness (Caton and Haas, 2020). In particular, representation learning with adversary has become a widely-used method in recent years and has demonstrated effectiveness on multiple tasks, including anonymization (Edwards and Storkey, 2015), clustering (Li et al., 2020b), classification (Madras et al., 2018), transfer learning (Madras et al., 2018), and domain adaptation (Tzeng et al., 2017; Li et al., 2020a).
Existing two algorithms in pursuit of fair outlier detection typically target group fairness and contain a post-processing technique that seeks an outlier ranking that is consistent with the baseline result. FairLOF (Deepak and Abraham, 2020) is the first paper to address the fair outlier detection problem, which incorporates a corrective term on the baseline LOF algorithm, in regards to local sensitive subgroup diversity and global outlier alignment with the baseline. FairOD (Shekhar et al., 2020) is another pioneering work, which has recently been released on arXiv. This method targets an equal outlier rate on the majority and minority sensitive subgroups. Specifically, it employs an autoencoder (An and Cho, 2015) as the base outlier detector and performs subgroup debiasing with statistical parity fairness constraint, while maintaining fidelity to within-group rankings with respect to the baseline.
However, one concern the post-processing approach may have is the baseline restricting the fair model’s detection validity, due to their aligned outlier ranking. Therefore, we set to tackle the fair outlier detection problem with an in-processing deep representation learning methodology, where we ensure detecting validity on the learned task-friendly feature space while conducting fairness-adversarial training to concurrently maintain group fairness.
3. Fair Outlier Detection
Given a set of data instances with categorical sensitive attributes, unsupervised fair outlier detection aims to seek top outlier candidates in a sensitive attribute-invariant fashion. Specifically, we define the unsupervised fair outlier detection problem as follows:
Problem Formulation (Unsupervised fair outlier detection). Given data points in space sampled i.i.d. from an underlying distribution , with sensitive attribute ranging in subgroup classes and inaccessible ground truth outlier label , the problem of unsupervised fair outlier detection aims to seek an outlier score assignment that faithfully distinguishes the underlying outliers from the majority inliers, while maintaining statistical independence to sensitive subgroups,
| (1) |
and holding an accuracy parity between sensitive subgroups,
| (2) |
Eq. (1) and (2) both reflect the targeted group fairness (Dwork et al., 2012; Kleinberg et al., 2016). In Eq. (1), the probability distribution of is invariant to sensitive subgroups; In Eq. (2), where denotes the underlying data distribution for subgroup , the detection discrepancy between the true labels and outlier scores ought to be the same for all subgroups.
Existing methods (Deepak and Abraham, 2020; Shekhar et al., 2020) on fair outlier detection achieve group fairness by balancing out the protected subgroup diversity, which adds difficulty to outlier uncovering as it blurs the underlying data pattern. To alleviate that downside, they preserve a consistent outlier ranking with respect to a pre-obtained baseline result, yet this may also impose restrictions on detection validity. Motivated by the above limitations, we adopt the representation learning with adversarial training framework, which guarantees the detection accuracy on a task-favorable feature space, while achieving the expected group fairness by hiding sensitive subgroup information on the learned representation.
4. Methodology
We elaborate our proposed Deep Clustering based Fair Outlier Detection (DCFOD), using symbols summarized in Table 1.
| Notation | Type | Description |
|---|---|---|
| Input | Number of instances | |
| Input | Number of subgroup classes | |
| Input | Dimension of embedded feature space | |
| Input | Number of clusters | |
| Input | Vector of -th data point | |
| Input | Sensitive subgroup of -th data point | |
| Learnable | Cluster membership of -th data point | |
| Learnable | Outlier score of -th data point | |
| Learnable | Weight of -th data point | |
| Learnable | Vector of -th centroid |
4.1. Framework Overview
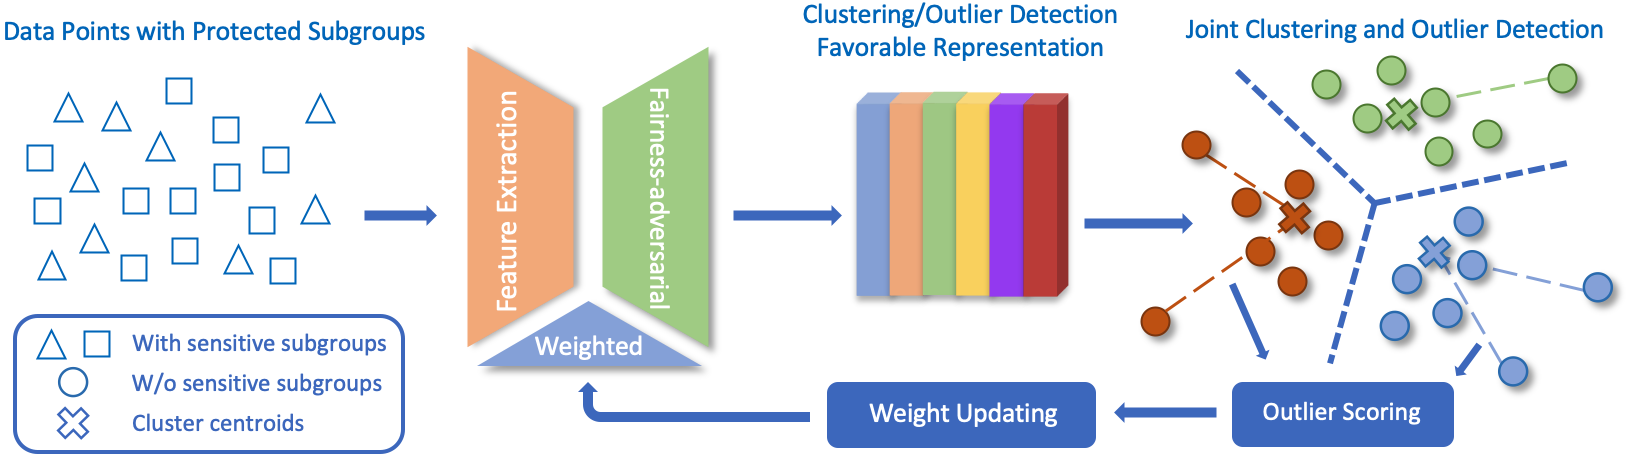
Unsupervised fair outlier detection can be decomposed into unsupervised outlier detection and fair learning. Inspired by the huge progress in deep neural networks, we tackle the above two problems under a same umbrella with representation learning. Figure 1 shows our proposed DCFOD framework. Administered by a dynamic weight, the representation learning of DCFOD consists of a feature extractor and a fairness-adversarial counterpart. For fairness-adaptation, we conduct a min-max training, where a sensitive subgroup discriminator strives to predict instances’ subgroup category, while the feature extractor undermining that prediction. Expected group fairness is achieved when the prediction ceases to improve, due to the neutralization of the subgroup information on the learned feature embedding. The dynamic weight module secures the outlier detection validity amidst fair learning. Specifically, we perform a joint clustering and outlier detection on the embedded space. Given the strong coupling between clustering and outlier detection, the well-discovered cluster structure fosters outlier uncovering, while assisting the weight calculation. Data points close to their associated centroids are assigned higher weights while those far away from centroids, identified as potential outlier candidates, are assigned lower weights. Therefore, inlier points with dominant weights capture the intrinsic cluster structure, which, in turn, brings benefits to outlier detection. By this means, we diminish outliers’ disturbance on representation learning, thus guaranteeing the outlier diagnostic quality on the obtained representation.
4.2. Weighted Representation Learning
We denote the feature extractor and subgroup discriminator as and , where seeks a latent representation for samples and predicts its sensitive subgroup membership, i.e., , . Furthermore, we formulate cluster centroids on the latent space: , and calculate outlier score with dynamic weight for each instance . Based on the above components, we establish the training objective as three loss functions: self-reconstruction loss , fairness-adversarial loss , and clustering regularization . In what follows, we elaborate the formulations of each component and the calculation of and .
Self-reconstruction Loss. We employ a weighted autoencoder as the feature extractor, which contains an encoder that seeks a feature representation and a decoder to reconstruct back to the original space. The weight module , which will be elaborated in detail in Eq. (9), mitigates the negative impact from outliers’ abnormal feature representations on model parameter training. , with a L2 distance, is expressed as:
| (3) |
where denotes the function composition.
Fairness-adversarial Loss. Furthermore, the learned representation is also expected to be sensitive subgroup-invariant. To achieve this, we employ a sensitive attribute subgroup discriminator predicting each data point’s likelihood of subgroup categories in the latent space. records the predicting loss as follows:
| (4) |
where is the cross-entropy loss and is the true subgroup class for . During the fairness min-max training, and are trained in opposite directions. Specifically, aims to accurately predict protected subgroups via minimizing , while , in adversary, maximizes the loss by hiding protected information on the feature embedding. As training progresses, the obtained feature representation becomes subgroup-invariant for fair outlier detection.
Clustering Assignment and Regularization. To perform joint clustering and outlier detection, we first obtain a soft clustering assignment on the feature embedding. Specifically, we calculate the probability of assigning each to each of the clusters based on its distance to the centroids with Student’s t-distribution:
| (5) |
where is the probability of assigning the -th data point to the -th cluster, and denotes the -th cluster centroid. The degree of freedom for the t-distribution is 1.
To strengthen the cluster predictive confidence, we follow Xie et al. (2016) and employ a clustering regularizer, which computes an auxiliary distribution based on the soft clustering assignment as follows:
| (6) |
In this way, the auxiliary distribution enlarges the distinctions between predictions on different clusters. The clustering regularizer then pulls toward by minimizing their KL divergence. Similar to the above losses, is also regulated by the weight module:
| (7) |
Outlier Score. Outliers are conceptually defined by clusters as data points that deviate from the majority cluster structure. Based on that, we define outlierness as the within-cluster distance ratio to the centroid. Specifically, is computed by the Euclidean distance between and its closest centroid, normalized by that of the furthest point belonging to the same centroid:
| (8) |
where is an indicator function, and is the most probable cluster membership for the -th point, based on clustering distribution .
Weight Module. To mitigate negative impacts from outliers, we guide the representation learning with an instance-level weight module , where we deemphasize outliers with lower weights compared to inliers. Specifically, in alleviates the disruption in feature extractor’s parameter updating due to outliers’ abnormal feature representations; in prevents strengthening the predictive confidence for outliers, as conceptually, they do not belong to any cluster; For in , the idea is to increase focus in subgroup debiasing on potential outlier candidates.
Therefore, with the above , we compute the dynamic weight mechanism that governs the designated components in our objective as follows:
| (9) |
which is essentially a Softmax function imposed on the negative values of outlier scores. We design such that it is in negative correlation with , while keeping , a global balance that avoids weights excessively overvalued.
In conclusion, the overall objective function of our framework can be written as the following minimax optimization:
| (10) |
where and are hyperparameters that control the balance in the objective function. In the end, our method returns a set of outlier scores that maintains detection validity and group fairness. The complete process of DCFOD is shown in Algorithm 1.
5. Experiment
In this section, we first introduce the experimental settings, datasets and evaluative metrics for outlier validation and degree of fairness. Then we compete our model with 17 unsupervised outlier detection methods on eight public datasets. Finally, we conduct a factor exploration on our model for an in-depth analysis.
5.1. Experimental Setup
Datasets. We choose eight UCI 222https://archive.ics.uci.edu/ml/datasets.php datasets in diverse fields, including credit rating, personal income, academic performance, drug review, and clinical screening. Table 2 shows detailed characteristics of these datasets. All datasets except german contain either Gender or Race as the sensitive attribute, while that of german is provided as a combination of gender and marital status. The Outlier Definition column shows the benchmark outlier criteria for each dataset, which is used as the ground truth for outlier validation. The numbers of instances in these datasets vary from 704 to nearly 300,000, and the outlier percentage ranges from 6.2% to 30%.
Competitive Methods. We compare our model with the fair outlier detectors FairLOF (Deepak and Abraham, 2020), FairOD (Shekhar et al., 2020), and 15 conventional unsupervised outlier detection methods, including linear models: Principal Component Analysis (PCA) (Shyu et al., 2003), One-class Support Vector Machine (OCSVM) (Schölkopf et al., 2001); proximity-based models: Local Outlier Factor (LOF) (Breunig et al., 2000), Connectivity-Based Outlier Factor (COF) (Tang et al., 2002), Clustering Based Local Outlier Factor (CBLOF) (He et al., 2003); probability-based models: Fast angle-based Outlier Detector (FABOD) (Kriegel et al., 2008), Copula Based Outlier Detector (COPOD) (Li et al., 2020c); ensemble-based models: Feature Bagging (FB) (Lazarevic and Kumar, 2005), iForest (Liu et al., 2008), Lightweight On-line Detector of Anomalies (LODA) (Pevnỳ, 2016), Clustering with Outlier Removal (COR) (Liu et al., 2019); neural networks: AutoEncoder (AE) (An and Cho, 2015), Variational Auto Encoder (VAE) (Kingma and Welling, 2013), Random Distance Prediction (RDP) (Wang et al., 2020).
Implementation. We implement FairLOF, FairOD in PyTorch, build RDP, COR based on their public source code, and other classical outlier detection methods are implemented with PyOD (Zhao et al., 2019). In practice, we use the following default settings. The hyperparameters for FairLOF and FairOD strictly follow their literature. The number of nearest neighbors for LOF, COF, and FABOD are set to 20; the number of clusters for CBLOF and COR are set to 10; the number of bins and random cuts for LODA is 10 and 100, respectively; the number of base estimators and sub-sampling size for iForest are 100 and 256 respectively; the base estimator for feature bagging is LOF, its number of estimators is 10 and its sub-sampling size equals to the sample size. For AE and VAE, the hidden neuron structures are 64-32-32-64 and 128-64-32-32-64-128. In cases when the feature dimension is smaller than 64, we modify their structures into 16-8-8-16 and 16-8-4-4-8-16, accordingly. Both of them run for 100 epochs with a batch size of 32.
| Dataset | #Instances | #Features | Domain | Sensitive Attribute | Outlier Definition | %Outlier |
|---|---|---|---|---|---|---|
| student | 1045 | 33 | Academic | Gender | Final grade 6 | 9.58% |
| asd | 704 | 21 | Clinical | Gender | Should pursue diagnosis | 26.84% |
| obesity | 2111 | 17 | Clinical | Gender | Insufficient weight | 13.60% |
| cc | 30000 | 24 | Credit | Gender | Credit default | 22.12% |
| german | 1000 | 21 | Credit | Marital & Gender | Good credit | 30.00% |
| drug | 1885 | 13 | Drug | Gender | Used within last week | 8.44% |
| adult | 48842 | 14 | Income | Race | Income ¿ 50K | 23.93% |
| kdd | 299285 | 40 | Income | Race | Income ¿ 50K | 6.2% |
| Dataset | Fair Model | Linear Model | Proximity Based | Probability Based | Ensemble Based | Neural Networks | Ours | |||||||||||
| FairLOF | FairOD | PCA | OCSVM | LOF | COF | CBLOF | FABOD | COPOD | FB | iForest | LODA | COR | AE | VAE | RDP | DCOD | DCFOD | |
| student | 0.662 | 0.7170.123 | 0.718 | 0.848 | 0.777 | 0.710 | 0.761 | 0.834 | 0.750 | 0.804 | 0.679 | 0.7940.054 | 0.568 | 0.728 | 0.719 | 0.8340.021 | 0.9120.011 | 0.9210.013 |
| asd | 0.543 | 0.6420.214 | 0.630 | 0.707 | 0.523 | 0.491 | 0.387 | 0.469 | 0.811 | 0.521 | 0.542 | 0.5240.152 | 0.857 | 0.627 | 0.629 | 0.6950.037 | 0.9390.038 | 0.9450.032 |
| obesity | 0.428 | 0.5140.167 | 0.720 | 0.675 | 0.355 | 0.377 | 0.602 | 0.540 | 0.742 | 0.383 | 0.757 | 0.5720.134 | 0.552 | 0.719 | 0.719 | 0.6120.021 | 0.8000.029 | 0.8250.017 |
| cc | 0.465 | 0.5540.016 | 0.604 | 0.621 | 0.451 | 0.465 | 0.579 | 0.531 | 0.557 | 0.451 | 0.594 | 0.6050.001 | 0.546 | 0.604 | 0.604 | 0.5970.011 | 0.5710.018 | 0.5660.024 |
| german | 0.569 | 0.5700.021 | 0.546 | 0.584 | 0.589 | 0.568 | 0.581 | 0.589 | 0.547 | 0.582 | 0.546 | 0.5060.034 | 0.475 | 0.546 | 0.546 | 0.5810.030 | 0.5580.016 | 0.5590.013 |
| drug | 0.543 | 0.5510.035 | 0.562 | 0.562 | 0.546 | 0.534 | 0.555 | 0.562 | 0.556 | 0.544 | 0.570 | 0.5210.055 | 0.522 | 0.560 | 0.562 | 0.5670.013 | 0.5880.031 | 0.5860.021 |
| adult | 0.486 | 0.6050.022 | 0.473 | 0.525 | 0.488 | 0.479 | 0.474 | 0.471 | 0.488 | 0.438 | 0.426 | 0.5040.095 | 0.442 | 0.473 | 0.473 | 0.5410.014 | 0.4870.072 | 0.5920.051 |
| kdd | N/A∗ | 0.7060.003 | 0.661 | 0.630 | 0.549 | N/A | 0.687 | 0.519 | 0.686 | 0.566 | 0.589 | 0.4720.114 | 0.424 | 0.661 | 0.661 | 0.6750.000 | 0.7520.007 | 0.7470.011 |
| 0.751 | 0.852 | 0.854 | 0.892 | 0.752 | 0.737 | 0.816 | 0.792 | 0.882 | 0.751 | 0.786 | 0.751 | 0.821 | 0.855 | 0.854 | 0.886 | 0.953 | 0.979 | |
| ∗N/A means out-of-memory error. For this method, the according dataset is not included in the measurement calculation. | ||||||||||||||||||
| Dataset | Fair Model | Linear Model | Proximity Based | Probability Based | Ensemble Based | Neural Networks | Ours | |||||||||||
|---|---|---|---|---|---|---|---|---|---|---|---|---|---|---|---|---|---|---|
| FairLOF | FairOD | PCA | OCSVM | LOF | COF | CBLOF | FABOD | COPOD | FB | iForest | LODA | COR | AE | VAE | RDP | DCOD | DCFOD | |
| student | 0.008 | 0.0430.027 | 0.053 | 0.042 | 0.001 | 0.069 | 0.100 | 0.011 | 0.049 | 0.009 | 0.073 | 0.0600.040 | 0.003 | 0.049 | 0.053 | 0.0280.006 | 0.0200.013 | 0.0120.011 |
| asd | 0.013 | 0.0240.019 | 0.034 | 0.040 | 0.032 | 0.016 | 0.068 | 0.004 | 0.016 | 0.004 | 0.013 | 0.0550.036 | 0.030 | 0.034 | 0.034 | 0.0190.010 | 0.0340.013 | 0.0310.011 |
| obesity | 0.024 | 0.0130.009 | 0.184 | 0.064 | 0.069 | 0.094 | 0.114 | 0.136 | 0.239 | 0.035 | 0.163 | 0.1500.125 | 0.362 | 0.181 | 0.184 | 0.0470.008 | 0.0070.006 | 0.0040.004 |
| cc | 0.001 | 0.0040.003 | 0.005 | 0.012 | 0.010 | 0.016 | 0.006 | 0.007 | 0.005 | 0.004 | 0.001 | 0.0050.000 | 0.003 | 0.005 | 0.005 | 0.0010.001 | 0.0060.003 | 0.0050.004 |
| german | 0.076 | 0.0980.041 | 0.126 | 0.157 | 0.118 | 0.151 | 0.109 | 0.134 | 0.103 | 0.098 | 0.071 | 0.2550.081 | 0.186 | 0.123 | 0.126 | 0.0690.021 | 0.0680.029 | 0.0670.030 |
| drug | 0.051 | 0.0490.027 | 0.036 | 0.059 | 0.059 | 0.030 | 0.211 | 0.114 | 0.076 | 0.101 | 0.078 | 0.0460.042 | 0.110 | 0.034 | 0.036 | 0.0250.011 | 0.0140.010 | 0.0090.008 |
| adult | 0.151 | 0.0590.003 | 0.103 | 0.040 | 0.214 | 0.203 | 0.071 | 0.081 | 0.058 | 0.212 | 0.061 | 0.1260.050 | 0.167 | 0.103 | 0.103 | 0.0510.012 | 0.0480.020 | 0.0490.015 |
| kdd | N/A | 0.0420.004 | 0.152 | 0.078 | 0.136 | N/A | 0.052 | 0.243 | 0.047 | 0.146 | 0.152 | 0.1020.061 | 0.087 | 0.152 | 0.152 | 0.0150.003 | 0.0540.005 | 0.0320.009 |
| 0.328 | 0.180 | 0.123 | 0.100 | 0.227 | 0.116 | 0.099 | 0.210 | 0.140 | 0.251 | 0.092 | 0.251 | 0.254 | 0.126 | 0.123 | 0.300 | 0.277 | 0.402 | |
We implement our DCFOD in PyTorch333Source code: https://github.com/brandeis-machine-learning/FairOutlierDetection. In order to showcase the fairness adaptation effect from the adversarial training, we also compare DCFOD with its independent derivative, DCOD. Other than the absence of subgroup discriminator on DCOD, the two versions share the same implementation. Specifically, we set the number of clusters to 10 and dimension of embedded space to 64. For datasets with sample size greater than 10,000, we set the epoch to 40 and minibatch size to 256 to accelerate training process, otherwise to 90 and 64 respectively. Following Xie et al. (2016), we set the network structure as drop--500-500-2000-64 and 64-2000-500-500- for encoder and decoder, where drop is a dropout layer with rate 0.1. We set the structure for the discriminator to be 64-500-500-2000-, and the cluster centroid layer to be of size (10 * 64). We perform weight initialization on all linear layers with Xavier uniform initialization (Glorot and Bengio, 2010). Hyperparameter and are set to 8 and 100 for all datasets. The starting learning rate for encoder, decoder and discriminating layer is set to , that of the centroid layer is set to . Learning rates are multiplied by a factor of 0.1 for every 30 epochs. In the embedded space, we initialize the cluster centroids with MiniBatchKmeans (Sculley, 2010) implemented in sklearn.
During evaluation process, we report the mean and standard deviation for non-deterministic methods by repeating their experiments on 20 random seeds. AE and VAE are not reported as such, since their fluctuations are small enough to be neglected.
Metrics. Since all the outlier detectors return one continuous set of score and all associated datasets provide the ground truth outlier criteria, we use Area Under Receiver Operating Characteristic Curve (AUC) to evaluate the outlier diagnostic ability. To measure degree of group fairness, we propose and , based on the subgroup-wise diagnostic ability gap and the subgroup distribution drift among top-ranked outliers, respectively. Moreover, to thoroughly compare the performance of different methods across datasets, we also propose and functions that aggregate the score and fairness measurements on all datasets.
In specific, AUC evaluates the degree of alignment between the outlier score and the ground truth label under varying thresholds:
| (11) |
where , and represent the total sample, true inliers and outliers, respectively, is an indicator function and is the outlier score of data point given by one outlier detector. In practice, we use in sklearn.metrics444https://scikit-learn.org to calculate AUC.
For degree of fairness, evaluates the diagnostic validity gap between different protected subgroups, where a smaller gap indicates less group bias. Specifically, we calculate the score for each subgroup, and derive with the difference between the highest and the lowest:
| (12) |
where is the sensitive subgroup set, and represents the sample in subgroup . denotes the score of group .
Beyond the performance-related fairness, it is crucial to measure whether sensitive subgroups are distributed fairly among detected outliers. achieves that goal by calculating the KL-divergence between the subgroup distribution in top outlier candidates in the output and that of the dataset, which is a reference distribution:
| (13) |
where we rank all output scores from the highest to lowest, with representing the subgroup distribution among the top outlier candidates derived by the outlier detector, and being the fixed reference distribution of the dataset. Specifically, records the most significant distribution drift in a range of top to outliers. Both and are negative measurements, where the smaller value indicates better fairness degree.
To better compare model performance under the variability on different datasets, we propose two scoring functions to produce one score for each algorithm on each metric, indicating its aggregated performance across all datasets. We denote the collection of algorithms and datasets with , and represent the -th algorithm and -th dataset, respectively. For the diagnostic validity metric , we propose as the following:
| (14) |
where is the of algorithm on dataset , and is the total number of datasets. We then propose for the two fairness metrics and , both denoted as :
| (15) |
where . In essence, functions rescale numerical results by normalizing each evaluative value using the best result among all algorithms on the same dataset, then average over the scaled value on all datasets. In the end, higher values of and indicate better diagnostic validity and more fairness.
| Dataset | Fair Model | Linear Model | Proximity Based | Probability Based | Ensemble Based | Neural Networks | Ours | |||||||||||
|---|---|---|---|---|---|---|---|---|---|---|---|---|---|---|---|---|---|---|
| FairLOF | FairOD | PCA | OCSVM | LOF | COF | CBLOF | FABOD | COPOD | FB | iForest | LODA | COR | AE | VAE | RDP | DCOD | DCFOD | |
| student | 0.003 | 0.0160.010 | 0.009 | 0.067 | 0.004 | 0.030 | 0.007 | 0.008 | 0.057 | 0.008 | 0.006 | 0.0660.070 | 0.206 | 0.007 | 0.009 | 0.0100.005 | 0.0110.011 | 0.0070.003 |
| asd | 0.012 | 0.0300.026 | 0.023 | 0.013 | 0.013 | 0.005 | 0.023 | 0.019 | 0.030 | 0.007 | 0.006 | 0.0870.236 | 0.030 | 0.023 | 0.023 | 0.0160.011 | 0.0130.012 | 0.0110.010 |
| obesity | 0.031 | 0.0080.007 | 0.013 | 0.030 | 0.015 | 0.018 | 0.073 | 0.009 | 0.067 | 0.009 | 0.011 | 0.0570.187 | 0.669 | 0.012 | 0.013 | 0.0030.001 | 0.0080.007 | 0.0050.003 |
| cc | 0.001 | 0.0010.000 | 0.010 | 0.010 | 0.004 | 0.003 | 0.014 | 0.012 | 0.026 | 0.002 | 0.024 | 0.0490.001 | 0.112 | 0.010 | 0.010 | 0.0020.000 | 0.0010.000 | 0.0010.000 |
| german | 0.101 | 0.0380.017 | 0.014 | 0.105 | 0.102 | 0.046 | 0.061 | 0.054 | 0.024 | 0.148 | 0.042 | 0.0290.560 | 0.255 | 0.014 | 0.015 | 0.0160.002 | 0.0480.018 | 0.0440.022 |
| drug | 0.003 | 0.0070.006 | 0.003 | 0.009 | 0.010 | 0.001 | 0.002 | 0.005 | 0.009 | 0.004 | 0.009 | 0.0930.324 | 0.091 | 0.003 | 0.003 | 0.0050.002 | 0.0080.006 | 0.0080.008 |
| adult | 0.131 | 0.0010.000 | 0.483 | 0.009 | 0.154 | 0.153 | 0.071 | 0.244 | 0.662 | 0.045 | 0.562 | 0.0730.344 | 0.014 | 0.483 | 0.483 | 0.0010.000 | 0.0010.000 | 0.0010.000 |
| kdd | N/A | 0.0010.000 | 0.185 | 0.022 | 0.023 | N/A | 0.016 | 0.003 | 0.235 | 0.057 | 0.140 | 0.0950.112 | 0.047 | 0.185 | 0.185 | 0.0000.000 | 0.0000.000 | 0.0000.000 |
| 0.370 | 0.236 | 0.279 | 0.107 | 0.215 | 0.391 | 0.179 | 0.191 | 0.126 | 0.246 | 0.084 | 0.246 | 0.276 | 0.292 | 0.279 | 0.325 | 0.346 | 0.442 | |
Environment. Experiments were run on a 12 core processor Linux server with Intel Core i7-6850K@3.60 Ghz and 64GB RAM.
5.2. Performance
Table 3, 4 and 5 show the performance comparison of 18 algorithms on 8 benchmarks in terms of , and , where the best and second best results are highlighted in red bold and blue italic.
For outlier validation validity, different algorithms achieve the best results on different datasets. OCSVM gets 0.621 on cc, LOF and FABOD achieve 0.589 on german. Although these algorithms are hardly considered state-of-the-art, they are still effective in some scenarios. FairOD gets a 0.605 on adult, which shows its fairness adaptation can also bring high detection accuracy in certain cases. Our baseline method DCOD delivers two best results out of eight datasets, while our proposed DCFOD provides three best results and excels other competitive methods by a large margin on the comprehensive measurement . The demonstrated superior performance on DCFOD comes from two main aspects: (1) our model adopts a well-generalized clustering based framework, which holds a strong coupling with the unsupervised outlier detection task. (2) The weighted representation learning is capable of generating a feature embedding that captures the unique intrinsic cluster structure for each dataset. In particular, the dynamic weight module mitigates the influences from outliers’ abnormal representations and fosters a task-favorable feature space.
For fairness measurements, DCFOD has the highest values on both and . Specifically, our model delivers the best results on obesity, german, drug and kdd by , where the adversarial training shrinks the detection validity gap between subgroups by an average of 30 compared to DCOD. Other competitive methods, including FairLOF, OCVSM, LOF, FB, iForest, and RDP, share some best results on other datasets. Similar phenomena occurs on , as shown in Table 5, where DCFOD achieves the most fair performance on cc, adult, and kdd. On the rest datasets, the adversarial training also generates a fairer subgroup distribution compared to DCOD and improves by an average of .
We then discuss FairLOF and FairOD, two recently proposed fair outlier detectors. They set out to sacrifice certain degrees of detection validity in exchange for more fairness compared to their base methods LOF and autoencoder, which has been demonstrated in our experiment. Compared to LOF, FairLOF has a lower AUC with improved degrees of fairness on both and , while FairOD has a slightly lower AUC score compared to that of AE, with a similar and improved . The above models both apply a post-processing technique that seeks a consistent outlier ranking with a baseline detector, whose capacity might restrict the fair model from pursuing a higher detection accuracy. In contrast, DCFOD adopts a baseline-free, in-processing procedure to learn a fair feature representation where the detection accuracy is simultaneously optimizable. As shown in Table 3, the fairness-adapted DCFOD surpasses DCOD on , which demonstrates that the goals of accurate diagnosis and fairness adaptation may be beneficial to each other in a proper feature space. Based on the above illustrations, with the representation learning framework and fairness-adversarial training, the legitimacy of DCFOD’s superior performance on both the detection validity and group fairness is well demonstrated.
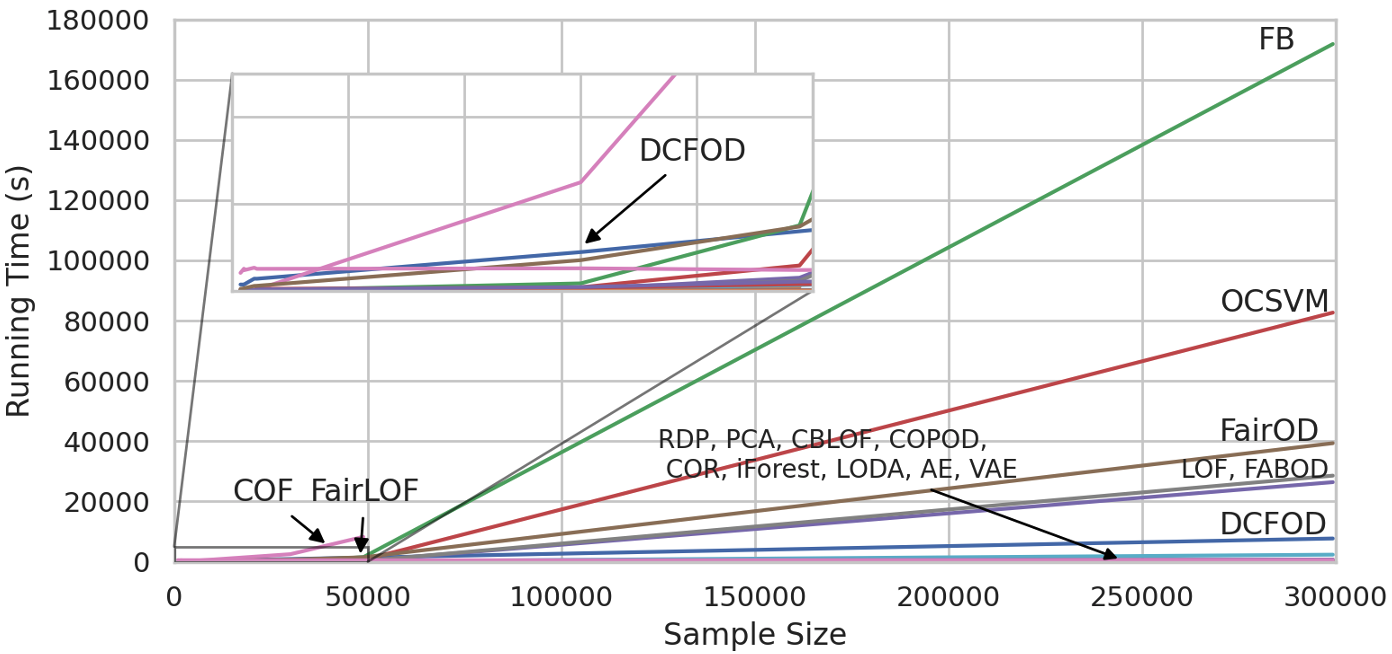
We compare the execution time of all methods in Figure 2. On datasets with less than 50,000 instances, all algorithms except COF have fast performances. Several maintain a low running time across all datasets, shown at the bottom lines in the figure. As sample size increases, FairLOF and COF encounter an out-of-memory error, and several other methods dramatically increase their running time. Meanwhile, DCFOD remains stable and keeps a flat increase rate due to its linear time complexity to the sample size and parameters .
5.3. Factor Exploration
We hereby explore the impact of critical factors in DCFOD. We look into the weight module for its quantitative effects on model training and performance, then test model volatility on hyperparameters. We use and performance for visualization due to the space limitation.
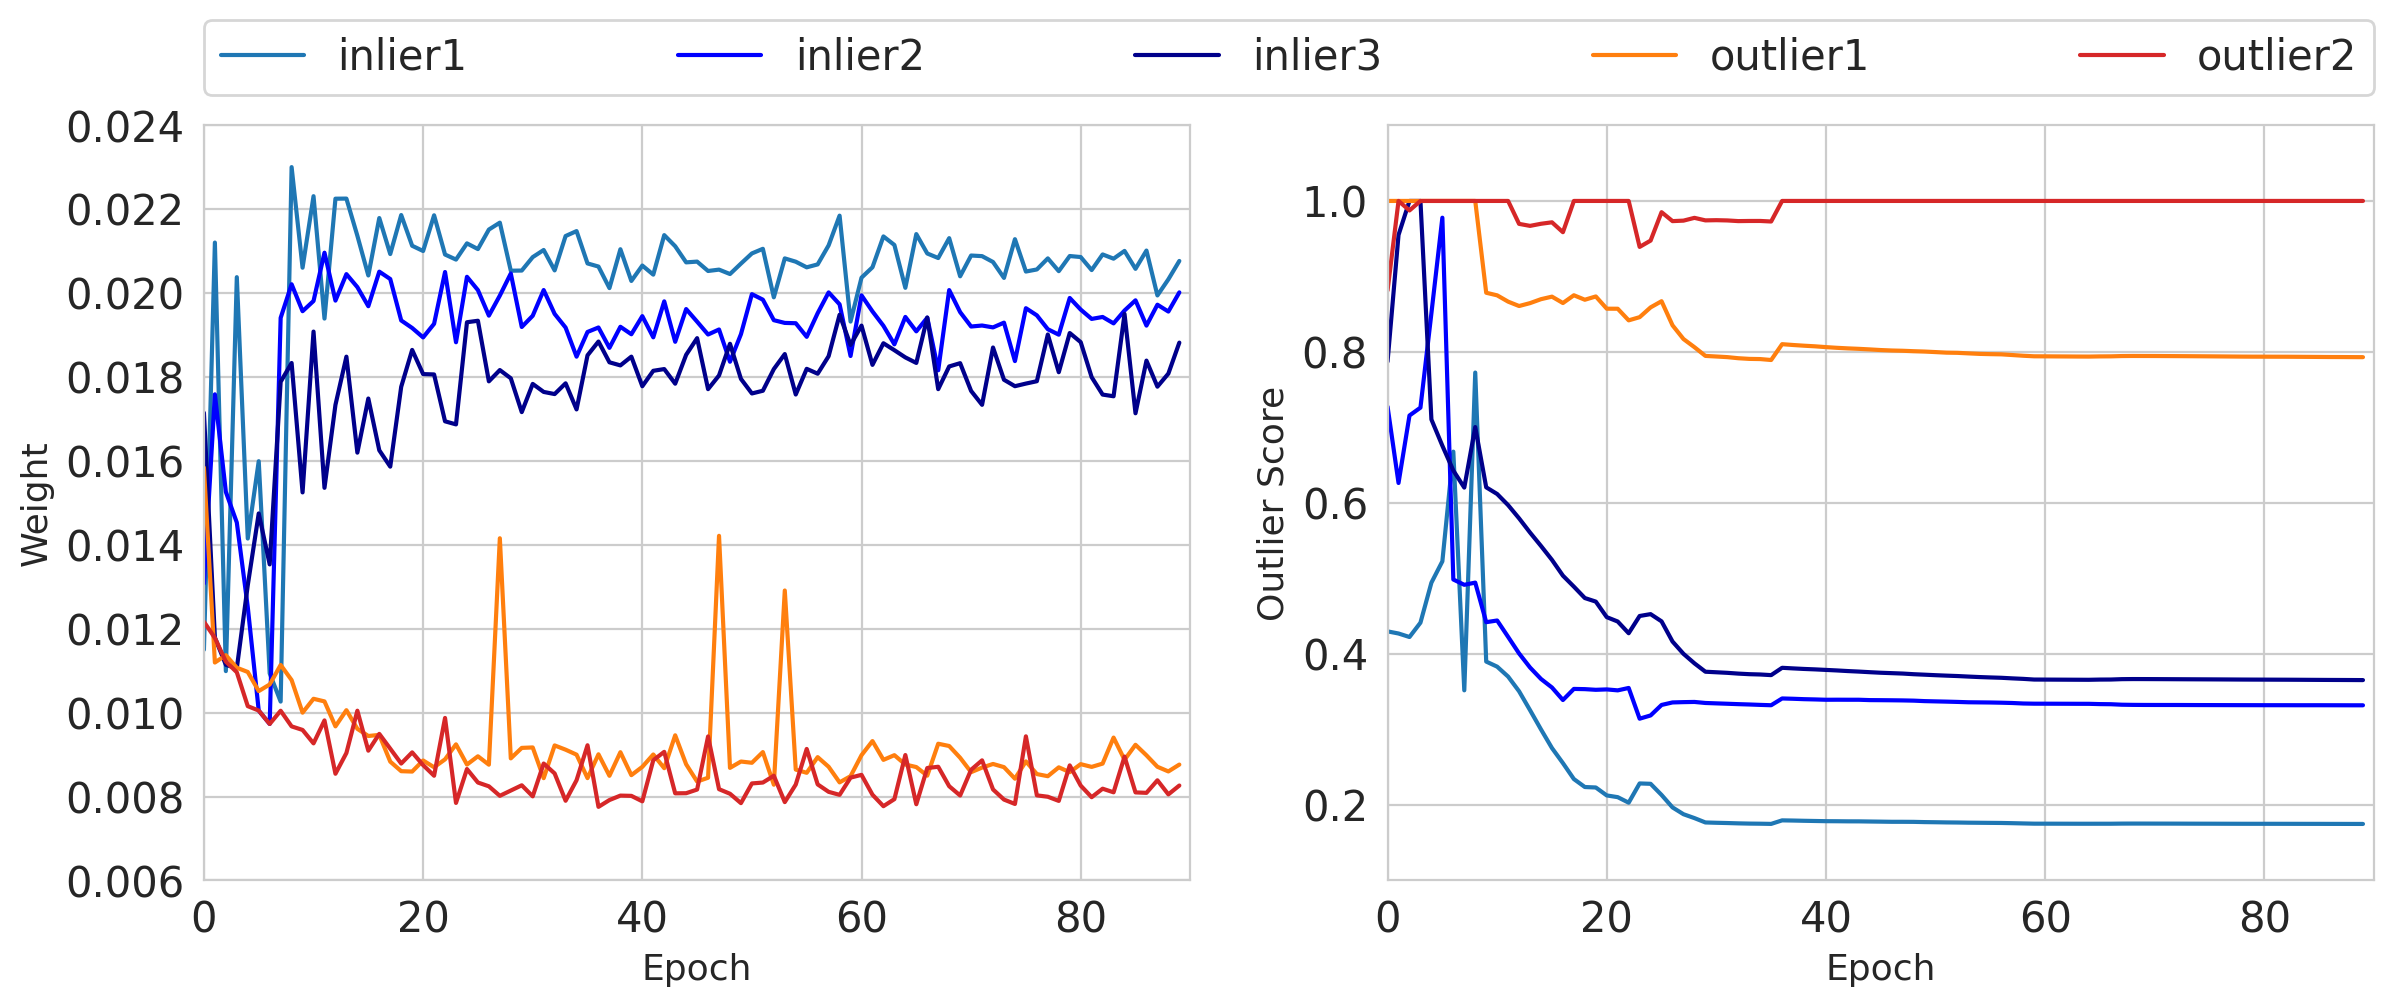
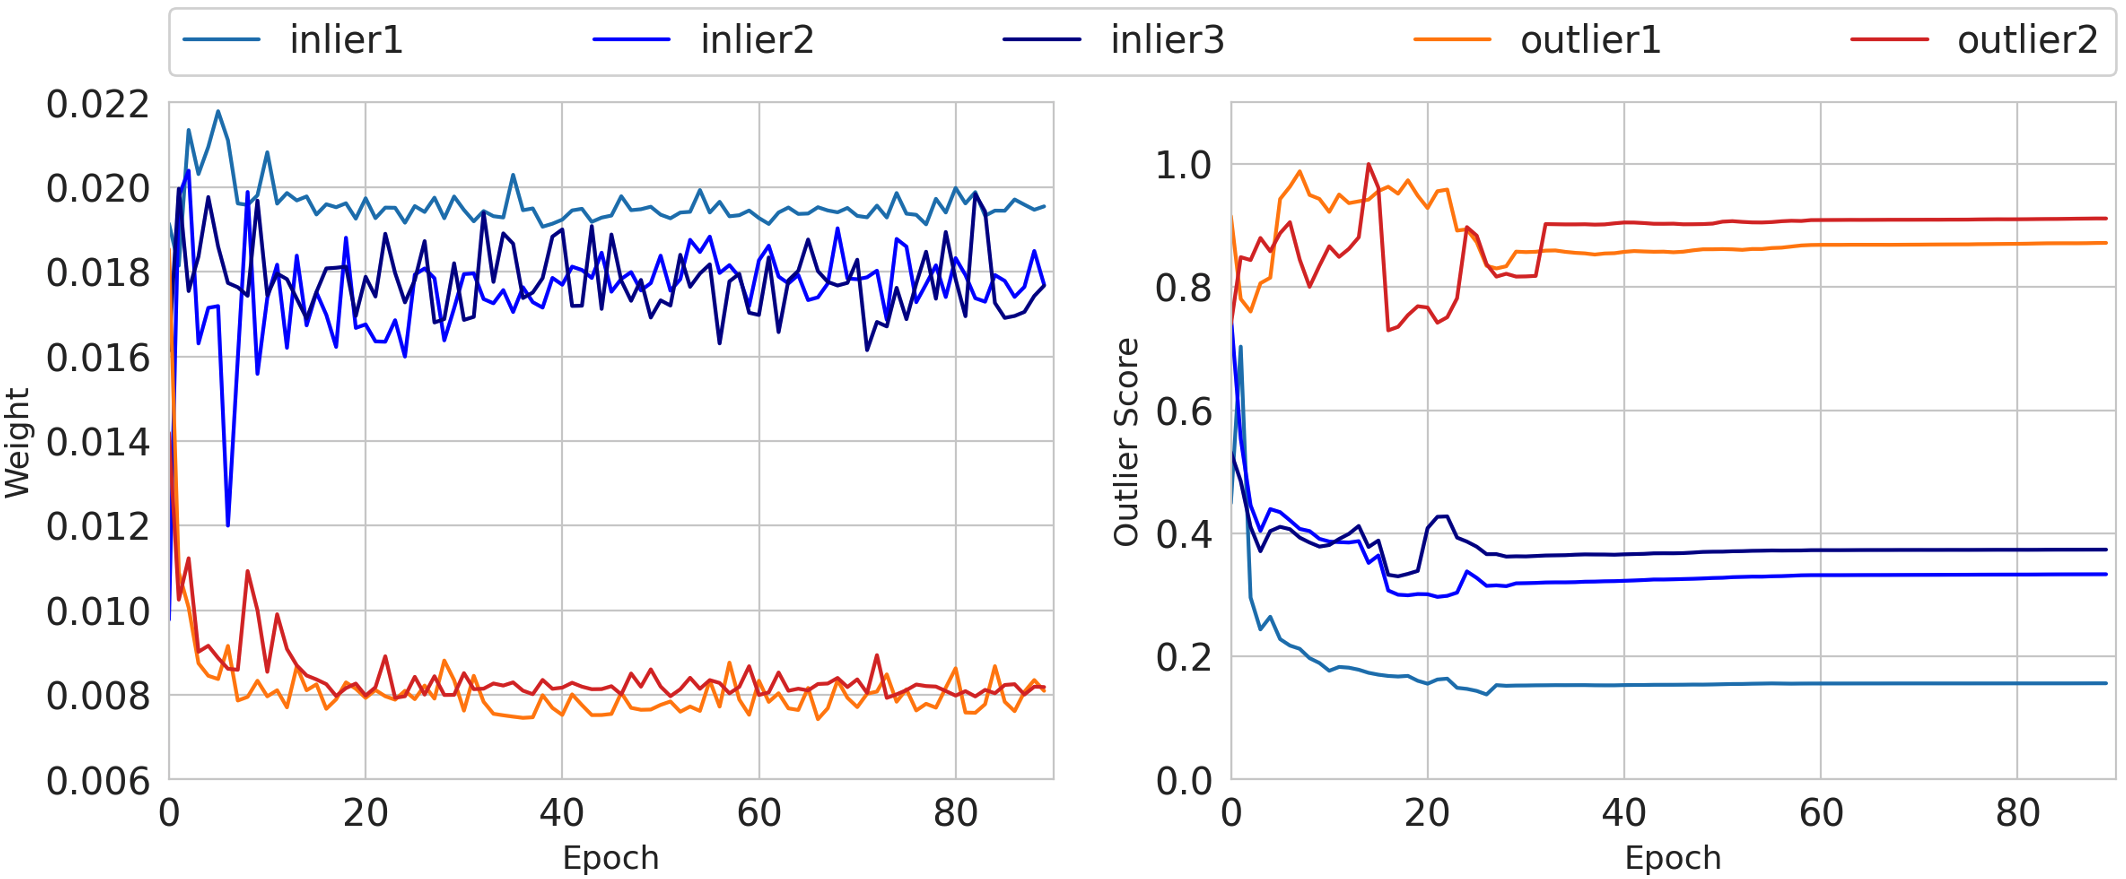
Weight and Outlier Score. The proposed DCFOD model assigns a dynamic weight for each instance during training. The likely-outlier candidates that are far away from the cluster centroids have higher outlier scores while assigned with lower weights. With this approach, we alleviate outliers’ disturbance toward the overall cluster structure and improve the model performance. Figure 3 shows the dynamic relationship between outlier scores and weight adjustments on asd and german. For each dataset, we choose three inliers and two outliers for demonstration, where consistent trends are exhibited. After several iterations, the weights and scores stabilize into two distinct groups. For outliers, scores converge to high values, and weights go to the lowest value of 0.008, while inliers have more dominant weights at around 0.02 and low outlier scores. The demonstration uses a minibatch of size 64, where one data point’s original contribution is . Our adaptive weight module reinforces inliers’ contributions by approximately and decreases that of outliers by , respectively.
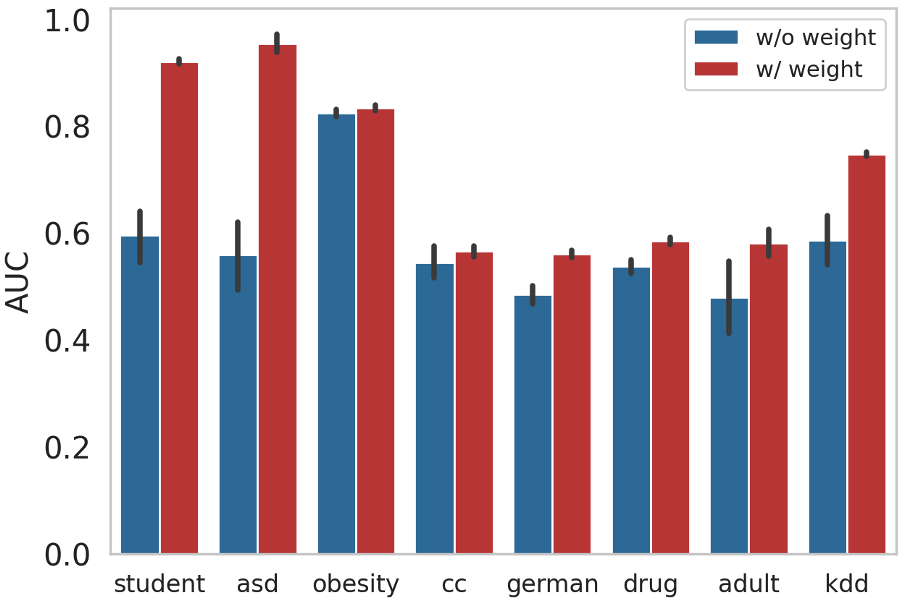
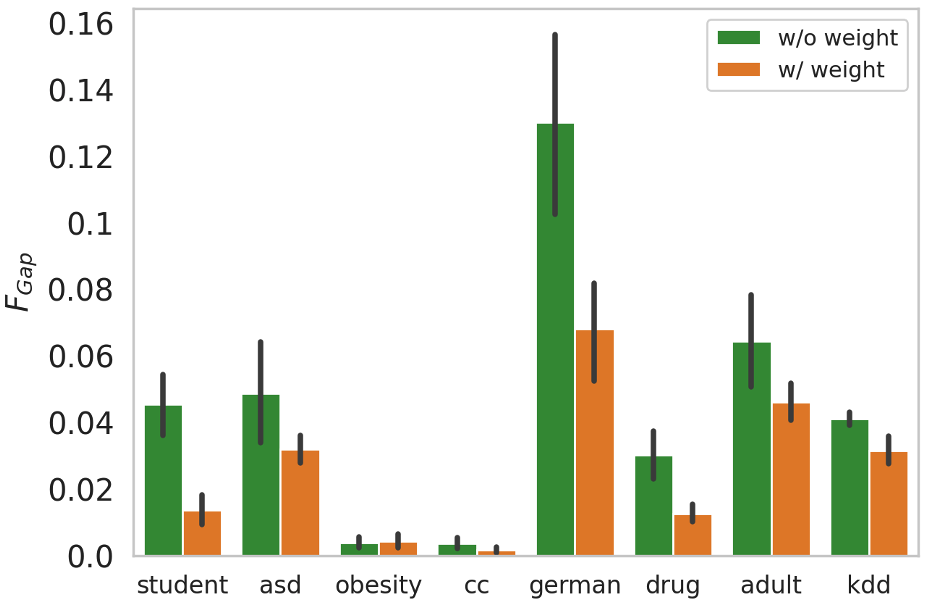
Figure 4 compares AUC and on all datasets with respect to the weight module’s presence, whose beneficial effects towards both the detection validity and fairness degree are clearly exhibited. Particularly, the weight module brings an average of increase in AUC on student, asd, and kdd datasets, while decreasing the detection validity gap between subgroups by an average of on student, german, and drug. The weight module’s enhancement in outlier validation invariably applies to all subgroups, thus closing their validity gaps and making the model fairer.
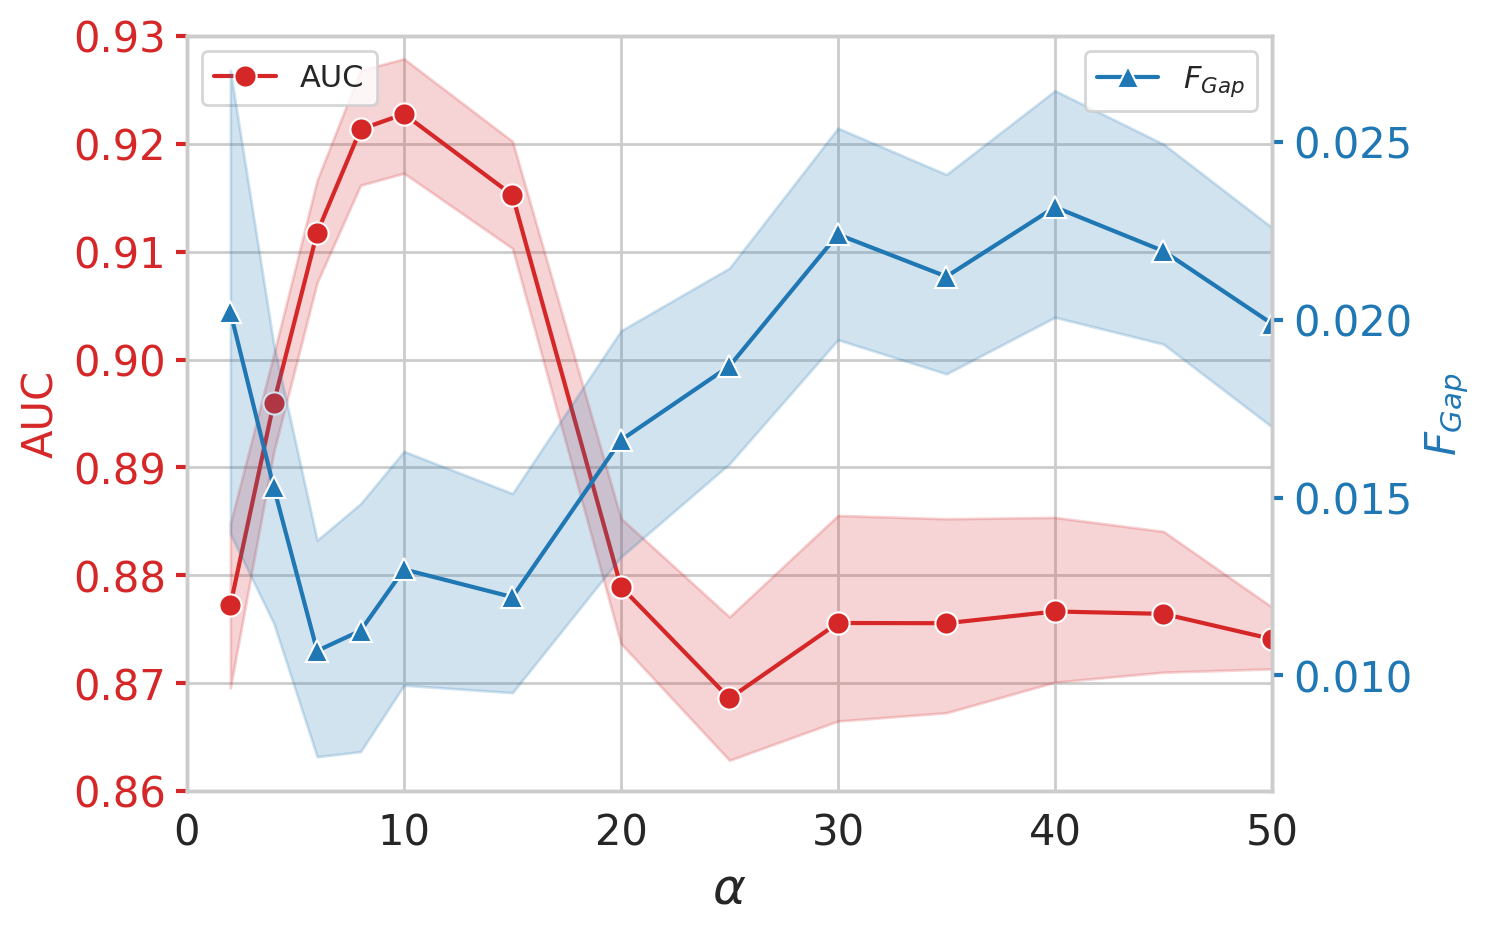
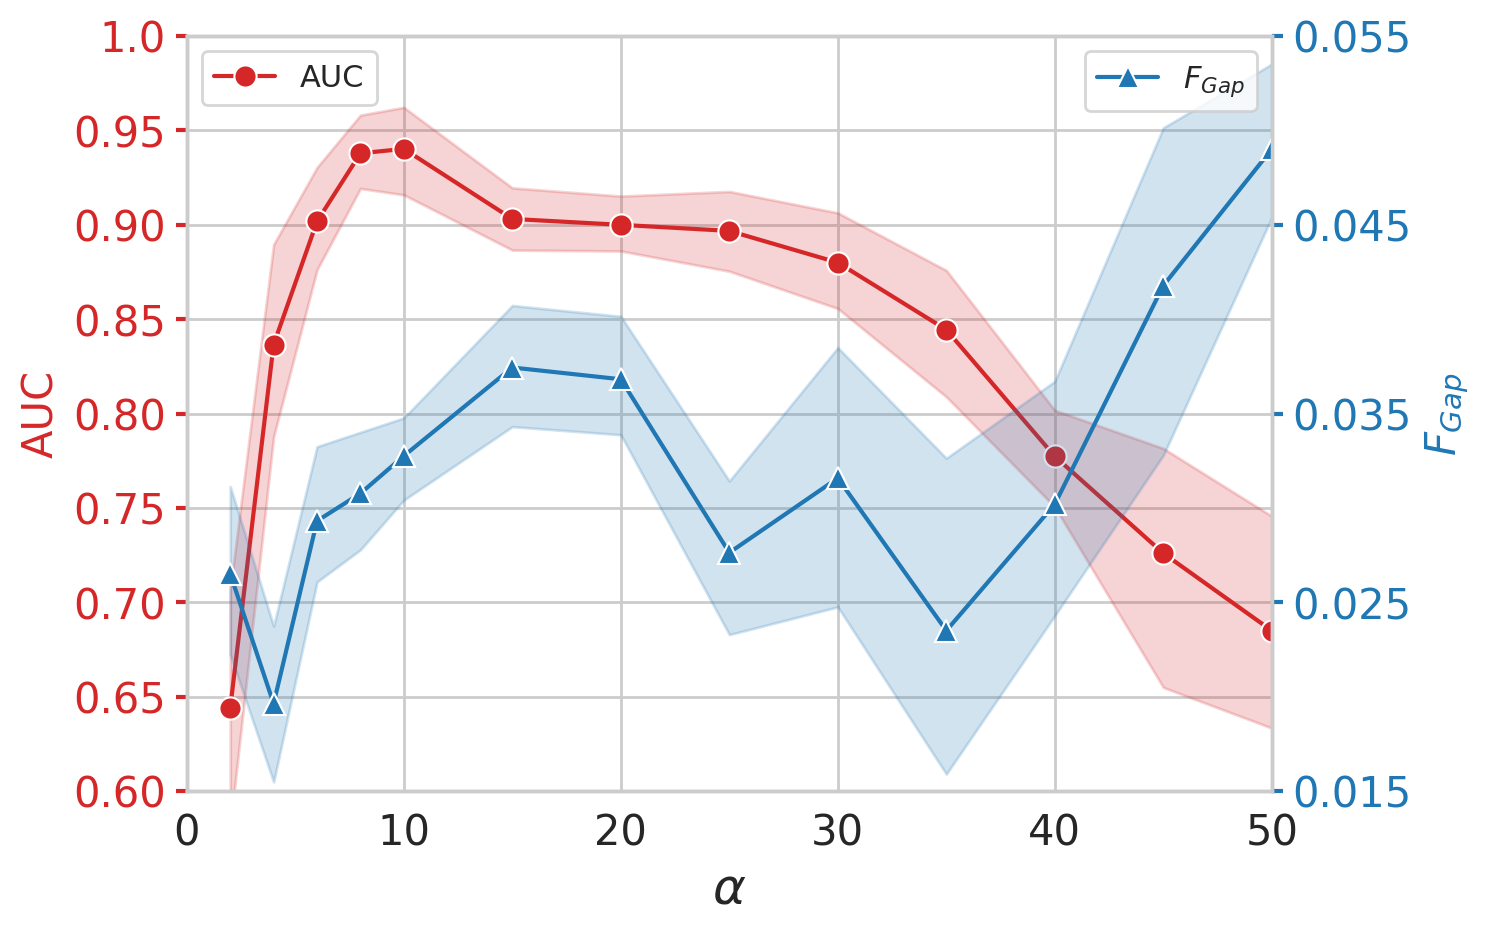
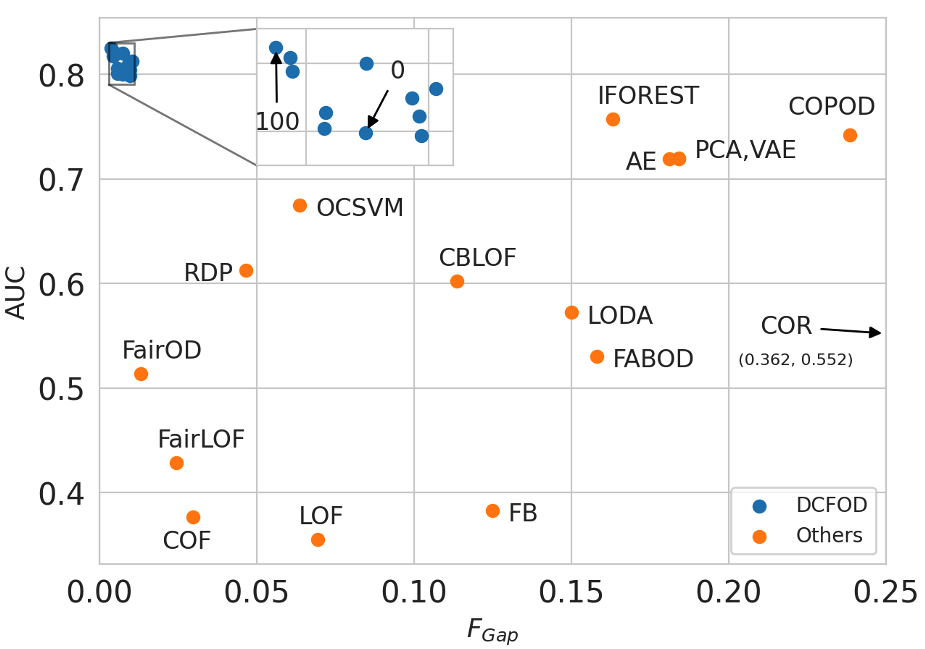
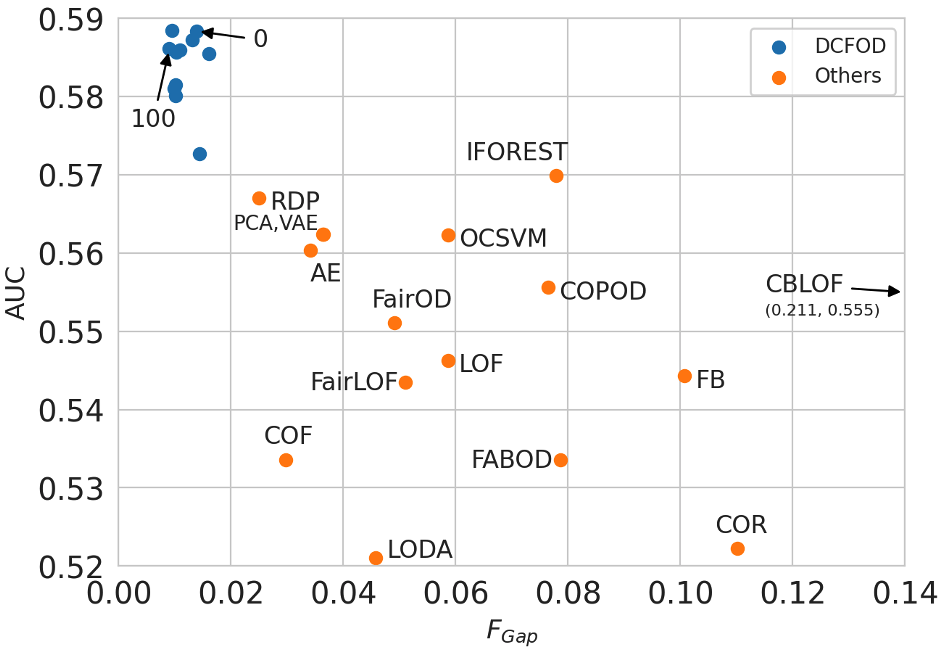
Hyperparameter Analysis. In our objective function, and govern the balance between the self-reconstruction loss and fairness-adversarial loss. We hereby explore the volatility of the model with respect to changes on hyperparameters and verify the legitimacy of the default values (i.e., ). As shown in Figure 5(a) and 5(b), the model reaches the best combination between and when . As further increases, detection validity decreases and the subgroup validity gap subsequently enlarges. Figure 5(c) and 5(d) are the pareto diagrams of and on dataset obesity and drug. DCFOD is observed to consistently yield results that are both fair and of high detection validity under varying , compared to all other competitive methods. takes the pareto front on both datasets, with clear improvements on fairness degree compared to (w/o adversarial training).
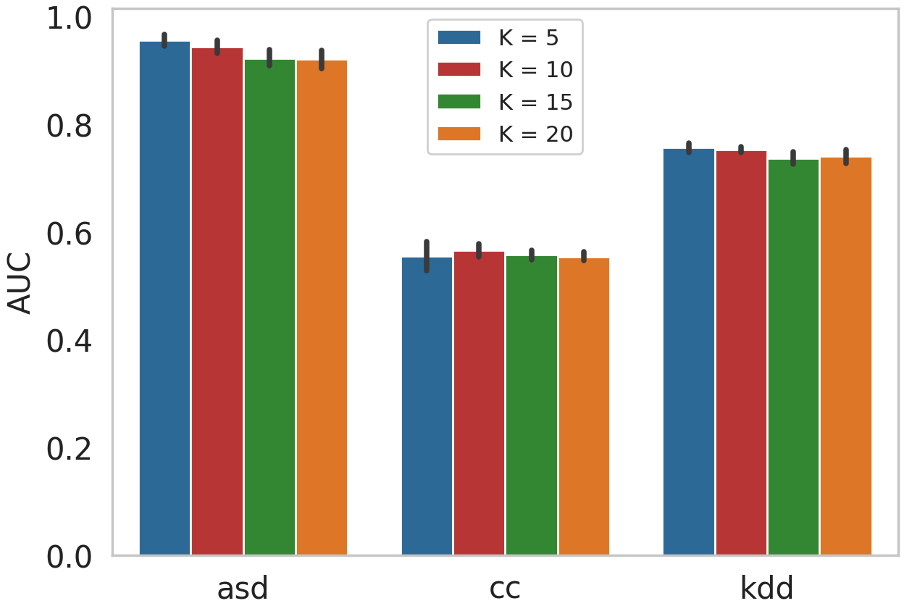
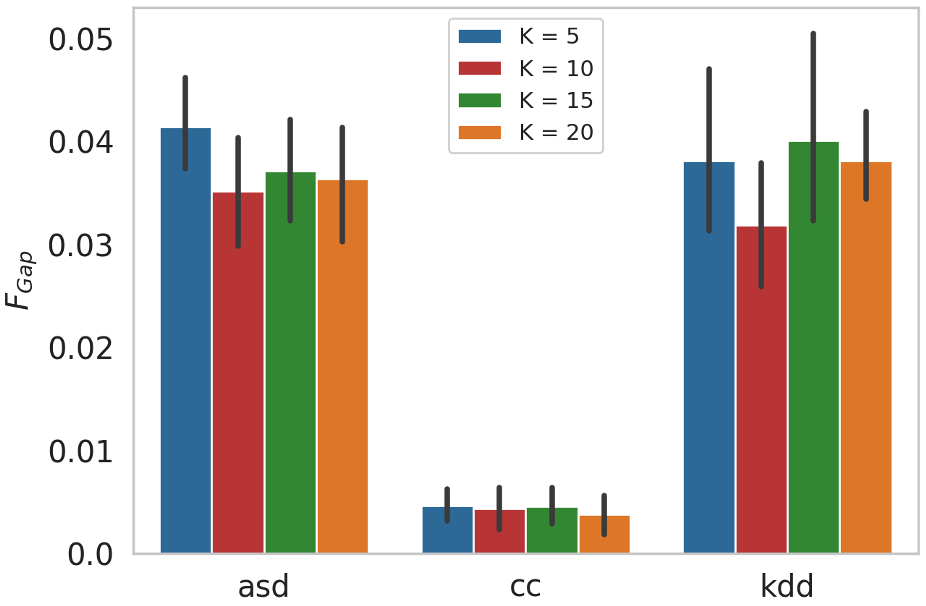
Another hyperparameter in our model is the number of clusters . In a typical Clustering based algorithm, it is set as the number of classes. However, in real-world unsupervised outlier detection tasks, we are often not provided with the actual number of classes. In our experiment, we uniformly set the number of clusters for all datasets. Figure 6 shows the and on cc, kdd, and asd with different cluster numbers. The consistent performance shows that our DCFOD is not sensitive to the cluster number.
6. Conclusion
We studied the fairness issues in the task of unsupervised outlier detection. We proposed a Deep Clustering based Fair Outlier Detection framework that conducts downstream task-favorable representation learning with adversarial training to optimize the detection validity concurrently with group fairness. Specifically, we designed an adaptive weight module to administer model training by reinforcing the likely-inliers’ contributions while alleviating the outliers’ negative effects. We extended the existing fairness evaluative criteria in the context of outlier detection and proposed two metrics regarding group-wise diagnostic accuracy gap and subgroup distribution among likely-outliers. Experiments showcased our model’s superiority over the recent fair models and conventional outlier detection methods in both outlier validation and degree of fairness.
7. Acknowledgment
This work was supported in part by NSF OAC 1920147.
References
- (1)
- An and Cho (2015) Jinwon An and Sungzoon Cho. 2015. Variational autoencoder based anomaly detection using reconstruction probability. Special Lecture on IE 2 (2015), 1–18.
- Breunig et al. (2000) Markus M Breunig, Hans-Peter Kriegel, Raymond T Ng, and Jörg Sander. 2000. LOF: identifying density-based local outliers. In Proceedings of the 2000 ACM SIGMOD international conference on Management of data. 93–104.
- Caton and Haas (2020) Simon Caton and Christian Haas. 2020. Fairness in Machine Learning: A Survey. arXiv preprint arXiv:2010.04053 (2020).
- Chawla and Gionis (2013) Sanjay Chawla and Aristides Gionis. 2013. k-means–: A unified approach to clustering and outlier detection. In Proceedings of the 2013 SIAM International Conference on Data Mining. SIAM, 189–197.
- Chen et al. (2017) Jinghui Chen, Saket Sathe, Charu Aggarwal, and Deepak Turaga. 2017. Outlier detection with autoencoder ensembles. In Proceedings of the 2017 SIAM international conference on data mining. SIAM, 90–98.
- Chiappa (2019) Silvia Chiappa. 2019. Path-specific counterfactual fairness. In Proceedings of the AAAI Conference on Artificial Intelligence, Vol. 33. 7801–7808.
- Chouldechova and Roth (2018) Alexandra Chouldechova and Aaron Roth. 2018. The frontiers of fairness in machine learning. arXiv preprint arXiv:1810.08810 (2018).
- Davidson and Ravi (2020) Ian Davidson and Selvan Suntiha Ravi. 2020. A framework for determining the fairness of outlier detection. In Proceedings of the 24th European Conference on Artificial Intelligence (ECAI2020), Vol. 2029.
- Deepak and Abraham (2020) P Deepak and Savitha Sam Abraham. 2020. Fair Outlier Detection. In International Conference on Web Information Systems Engineering. Springer, 447–462.
- Dwork et al. (2012) Cynthia Dwork, Moritz Hardt, Toniann Pitassi, Omer Reingold, and Richard Zemel. 2012. Fairness through awareness. In Proceedings of the 3rd innovations in theoretical computer science conference. 214–226.
- Edwards and Storkey (2015) Harrison Edwards and Amos Storkey. 2015. Censoring representations with an adversary. arXiv preprint arXiv:1511.05897 (2015).
- Evelina Nedlund (2019) CNN Business Evelina Nedlund. 2019. Apple Card is accused of gender bias. Here’s how that can happen. https://www.cnn.com/2019/11/12/business/apple-card-gender-bias/index.html
- Feldman et al. (2015) Michael Feldman, Sorelle A Friedler, John Moeller, Carlos Scheidegger, and Suresh Venkatasubramanian. 2015. Certifying and removing disparate impact. In proceedings of the 21th ACM SIGKDD international conference on knowledge discovery and data mining. 259–268.
- Glorot and Bengio (2010) Xavier Glorot and Yoshua Bengio. 2010. Understanding the difficulty of training deep feedforward neural networks. Journal of Machine Learning Research 9 (2010), 249–256.
- Goldstein and Dengel (2012) Markus Goldstein and Andreas Dengel. 2012. Histogram-based outlier score (hbos): A fast unsupervised anomaly detection algorithm. KI-2012: Poster and Demo Track (2012), 59–63.
- Hashimoto et al. (2018) Tatsunori B Hashimoto, Megha Srivastava, Hongseok Namkoong, and Percy Liang. 2018. Fairness without demographics in repeated loss minimization. arXiv preprint arXiv:1806.08010 (2018).
- He et al. (2016) Kaiming He, Xiangyu Zhang, Shaoqing Ren, and Jian Sun. 2016. Deep residual learning for image recognition. In Proceedings of the IEEE conference on computer vision and pattern recognition. 770–778.
- He et al. (2003) Zengyou He, Xiaofei Xu, and Shengchun Deng. 2003. Discovering Cluster Based Local Outliers. Pattern Recognition Letters 24 (2003), 1641–1650.
- Kannan et al. (2017) Ramakrishnan Kannan, Hyenkyun Woo, Charu C Aggarwal, and Haesun Park. 2017. Outlier detection for text data. In Proceedings of the 2017 siam international conference on data mining. SIAM, 489–497.
- Kearns et al. (2018) Michael Kearns, Seth Neel, Aaron Roth, and Zhiwei Steven Wu. 2018. Preventing fairness gerrymandering: Auditing and learning for subgroup fairness. In International Conference on Machine Learning. PMLR, 2564–2572.
- Kearns et al. (2019) Michael Kearns, Seth Neel, Aaron Roth, and Zhiwei Steven Wu. 2019. An empirical study of rich subgroup fairness for machine learning. In Proceedings of the Conference on Fairness, Accountability, and Transparency. 100–109.
- Kingma and Welling (2013) Diederik P Kingma and Max Welling. 2013. Auto-encoding variational bayes. arXiv preprint arXiv:1312.6114 (2013).
- Kleinberg et al. (2016) Jon Kleinberg, Sendhil Mullainathan, and Manish Raghavan. 2016. Inherent trade-offs in the fair determination of risk scores. arXiv preprint arXiv:1609.05807 (2016).
- Kriegel et al. (2009) Hans-Peter Kriegel, Peer Kröger, Erich Schubert, and Arthur Zimek. 2009. Outlier detection in axis-parallel subspaces of high dimensional data. In Pacific-asia conference on knowledge discovery and data mining. Springer, 831–838.
- Kriegel et al. (2008) Hans-Peter Kriegel, Matthias Schubert, and Arthur Zimek. 2008. Angle-based outlier detection in high-dimensional data. In Proceedings of the 14th ACM SIGKDD international conference on Knowledge discovery and data mining. 444–452.
- Krizhevsky et al. (2017) Alex Krizhevsky, Ilya Sutskever, and Geoffrey Hinton. 2017. Imagenet classification with deep convolutional neural networks. Commun. ACM 60 (2017), 84–90.
- Kusner et al. (2017) Matt J Kusner, Joshua R Loftus, Chris Russell, and Ricardo Silva. 2017. Counterfactual fairness. arXiv preprint arXiv:1703.06856 (2017).
- Lazarevic and Kumar (2005) Aleksandar Lazarevic and Vipin Kumar. 2005. Feature bagging for outlier detection. In Proceedings of the eleventh ACM SIGKDD international conference on Knowledge discovery in data mining. 157–166.
- Li et al. (2018) Dan Li, Dacheng Chen, Jonathan Goh, and See-Kiong Ng. 2018. Anomaly detection with generative adversarial networks for multivariate time series. arXiv preprint arXiv:1809.04758 (2018).
- Li et al. (2020a) Peizhao Li, Zhengming Ding, and Hongfu Liu. 2020a. Mining Label Distribution Drift in Unsupervised Domain Adaptation. arXiv preprint arXiv:2006.09565 (2020).
- Li et al. (2021) Peizhao Li, Yifei Wang, Han Zhao, Pengyu Hong, and Hongfu Liu. 2021. On dyadic fairness: Exploring and mitigating bias in graph connections. In Proceedings of International Conference on Learning Representations.
- Li et al. (2020b) Peizhao Li, Han Zhao, and Hongfu Liu. 2020b. Deep fair clustering for visual learning. In Proceedings of the IEEE/CVF Conference on Computer Vision and Pattern Recognition. 9070–9079.
- Li et al. (2020c) Zheng Li, Yue Zhao, Nicola Botta, Cezar Ionescu, and Xiyang Hu. 2020c. COPOD: copula-based outlier detection. arXiv preprint arXiv:2009.09463 (2020).
- Liu et al. (2008) Fei Tony Liu, Kai Ming Ting, and Zhi-Hua Zhou. 2008. Isolation forest. In 2008 eighth ieee international conference on data mining. IEEE, 413–422.
- Liu et al. (2019) Hongfu Liu, Jun Li, Yue Wu, and Yun Fu. 2019. Clustering with outlier removal. IEEE transactions on knowledge and data engineering (2019).
- Liu et al. (2016) Hongfu Liu, Yuchao Zhang, Bo Deng, and Yun Fu. 2016. Outlier detection via sampling ensemble. In 2016 IEEE International Conference on Big Data (Big Data). IEEE, 726–735.
- Liu et al. (2018) Wen Liu, Weixin Luo, Dongze Lian, and Shenghua Gao. 2018. Future frame prediction for anomaly detection–a new baseline. In Proceedings of the IEEE Conference on Computer Vision and Pattern Recognition. 6536–6545.
- Lohia et al. (2019) Pranay K Lohia, Karthikeyan Natesan Ramamurthy, Manish Bhide, Diptikalyan Saha, Kush R Varshney, and Ruchir Puri. 2019. Bias mitigation post-processing for individual and group fairness. In Icassp 2019-2019 ieee international conference on acoustics, speech and signal processing (icassp). IEEE, 2847–2851.
- Madras et al. (2018) David Madras, Elliot Creager, Toniann Pitassi, and Richard Zemel. 2018. Learning adversarially fair and transferable representations. In International Conference on Machine Learning. PMLR, 3384–3393.
- NEWS (2020) BBC NEWS. 2020. Facial recognition to ’predict criminals’ sparks row over AI bias. https://www.bbc.com/news/technology-53165286
- Pang et al. (2016) Guansong Pang, Longbing Cao, and Ling Chen. 2016. Outlier detection in complex categorical data by modelling the feature value couplings. In International Joint Conference on Artificial Intelligence.
- Pang et al. (2021) Guansong Pang, Chunhua Shen, Longbing Cao, and Anton Van Den Hengel. 2021. Deep learning for anomaly detection: A review. Comput. Surveys 54 (2021), 1–38.
- Pevnỳ (2016) Tomáš Pevnỳ. 2016. Loda: Lightweight on-line detector of anomalies. Machine Learning 102, 2 (2016), 275–304.
- Schölkopf et al. (2001) Bernhard Schölkopf, John Platt, John Shawe-Taylor, Alexander Smola, and Robert Williamson. 2001. Estimating Support of a High-Dimensional Distribution. Neural Computation 13 (2001), 1443–1471.
- Sculley (2010) David Sculley. 2010. Web-scale k-means clustering. In Proceedings of the 19th international conference on World wide web. 1177–1178.
- Shekhar et al. (2020) Shubhranshu Shekhar, Neil Shah, and Leman Akoglu. 2020. FairOD: Fairness-aware Outlier Detection. arXiv preprint arXiv:2012.03063 (2020).
- Shyu et al. (2003) Mei-Ling Shyu, Shu-Ching Chen, Kanoksri Sarinnapakorn, and LiWu Chang. 2003. A novel anomaly detection scheme based on principal component classifier. Technical Report. Miami Univ Coral Gables Fl Dept of Electrical and Computer Engineering.
- Tang et al. (2002) Jian Tang, Zhixiang Chen, Ada Wai-Chee Fu, and David W Cheung. 2002. Enhancing effectiveness of outlier detections for low density patterns. In Pacific-Asia Conference on Knowledge Discovery and Data Mining. Springer, 535–548.
- Tzeng et al. (2017) Eric Tzeng, Judy Hoffman, Kate Saenko, and Trevor Darrell. 2017. Adversarial discriminative domain adaptation. In Proceedings of the IEEE conference on computer vision and pattern recognition. 7167–7176.
- Wan et al. (2019) Fangyi Wan, Gaodeng Guo, Chunlin Zhang, Qing Guo, and Jie Liu. 2019. Outlier Detection for Monitoring Data Using Stacked Autoencoder. IEEE Access 7 (2019), 173827–173837.
- Wang et al. (2020) Hu Wang, Guansong Pang, Chunhua Shen, and Congbo Ma. 2020. Unsupervised Representation Learning by Predicting Random Distances. In International Joint Conference on Artificial Intelligence.
- Xie et al. (2016) Junyuan Xie, Ross Girshick, and Ali Farhadi. 2016. Unsupervised deep embedding for clustering analysis. In International conference on machine learning. PMLR, 478–487.
- Zemel et al. (2013) Rich Zemel, Yu Wu, Kevin Swersky, Toni Pitassi, and Cynthia Dwork. 2013. Learning fair representations. In International conference on machine learning. PMLR, 325–333.
- Zenati et al. (2018) Houssam Zenati, Chuan Sheng Foo, Bruno Lecouat, Gaurav Manek, and Vijay Ramaseshan Chandrasekhar. 2018. Efficient gan-based anomaly detection. arXiv preprint arXiv:1802.06222 (2018).
- Zhao and Fu (2015) Handong Zhao and Yun Fu. 2015. Dual-regularized multi-view outlier detection. In 24th International Joint Conference on Artificial Intelligence.
- Zhao et al. (2019) Yue Zhao, Zain Nasrullah, and Zheng Li. 2019. PyOD: A Python Toolbox for Scalable Outlier Detection. Journal of Machine Learning Research 20 (2019), 1–7.
- Zhou and Paffenroth (2017) Chong Zhou and Randy C Paffenroth. 2017. Anomaly detection with robust deep autoencoders. In Proceedings of the 23rd ACM SIGKDD international conference on knowledge discovery and data mining. 665–674.