Investigating New Physics Models with
Signature of Same-Sign Diboson
Cheng-Wei Chiang1,2*** E-mail: chengwei@phys.ntu.edu.tw , Sudip Jana3††† E-mail: sudip.jana@mpi-hd.mpg.de, Dibyashree Sengupta1‡‡‡ E-mail: dsengupta@phys.ntu.edu.tw
1Department of Physics, National Taiwan University, Taipei, Taiwan 10617, R.O.C.
2Physics Division, National Center for Theoretical Sciences, Taipei, Taiwan 10617, R.O.C.
3Max-Planck-Institut für Kernphysik, Saupfercheckweg 1, 69117 Heidelberg, Germany
Abstract
We investigate the prospect of searching for new physics via the novel signature of same-sign diboson + at current and future LHC. We study three new physics models: (i) natural SUSY models, (ii) type-III seesaw model and (iii) type-II seesaw/Georgi-Machacek model. In the first two class of models, this signature arises due to the presence of a singly-charged particle which has lifetime long enough to escape detection, while in the third model this signature originates resonantly from a doubly-charged particle produced along with two forward jets that, most likely, would escape detection. We analyze in great detail the discovery prospects of the signal in these three classes of models in the current as well as the upcoming runs of the LHC (such as HL-LHC, HE-LHC and FCC-hh) by showing a distinction among these scenarios.
1 Introduction
In the past few decades, there have been several major discoveries in particle physics, culminating in the observation of the Higgs boson in 2012 [1, 2]. Despite this tremendous success of the Standard Model (SM), it is incomplete in its current form. There is strong theoretical as well as experimental evidence (such as the hierarchical pattern seen in the fermion masses and mixings, the origin of neutrino masses, an understanding of dark matter, and the origin of the matter-antimatter asymmetry in the Universe) which calls for new physics beyond the Standard Model (BSM).
At the LHC, several searches have been performed to look for clues of these BSM models. However, we have not seen any clear new physics signals so far. In this work, we investigate the novel signal of same-sign diboson (SSdB) + which has been less studied and deserves more attention. This signal is of interest because it has negligibly small background in the SM. Hence, an observation of this signal will give a clear sign of BSM physics. After a careful study, we find that it is possible to observe such a unique signature in three well-motivated BSM scenarios, namely: (i) natural supersymmetry models [3, 4, 5, 6, 7, 8], (ii) type-III seesaw model [9], and (iii) type-II seesaw [10, 11, 12, 13]/Georgi-Machacek model [14] , while still being consistent with the existing theoretical and experimental limits.
Being a well-motivated BSM framework, supersymmetry (SUSY) provides an elegant solution to the Higgs mass hierarchy problem, accommodates a valid cold dark matter candidate, explains electroweak symmetry breaking, and features gauge coupling unification [15]. Although LHC searches for SUSY particles have pushed the masses of squarks and gluino high enough to expose weak scale SUSY to the risk of being unnatural/highly fine-tuned, there exist a class of SUSY models which can be natural as well as accommodate such highly massive sparticles well beyond the reach of the current LHC [16]. Since experiments do not put such high mass bounds on the masses of wino, bino, higgsino (and also the singlino which appears in some extended SUSY models [17, 18, 19, 20, 21, 22, 23]), these natural SUSY models can have a wino-like or a bino-like lightest supersymmetric particle (LSP), provided gaugino mass unification is not considered [24]. However, natural SUSY models can have a higgsino-like LSP irrespective of whether it assumes gaugino mass unification or not [24]. Ref. [25] and Ref. [26] study SUSY models with bino-like and singlino-like LSP, respectively, the latter being an extension of the minimal supersymmetric standard model (MSSM). Here, we consider a specific class of natural SUSY models that have a higgsino-like LSPs which, under R-parity conservation, cannot decay to lighter SM particles, and hence can give rise to the novel SSdB + signature via the generic process shown in Fig. 1. Earlier analyses have been done in this regard in Refs. [27, 28]. Our current SUSY analysis differs from these earlier analyses in several aspects to be discussed in detail in Sec. 2.1.
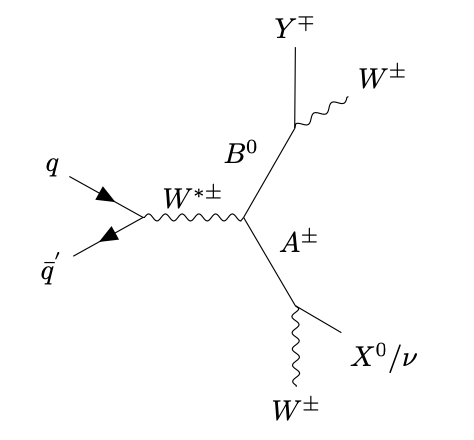
We consider another interesting theoretical framework, type-III seesaw model, which has been proposed [9] to explain the tiny neutrino masses and mixings. In the type-III seesaw model, the SM particle spectrum is extended by three generations of triplet fermions with hypercharge , the lightest of which has a lifetime long enough to escape detection [29], provided they have mass around a few hundred GeV. Hence, this model can also give rise to the novel signature of SSdB + via the generic process shown in Fig. 1.
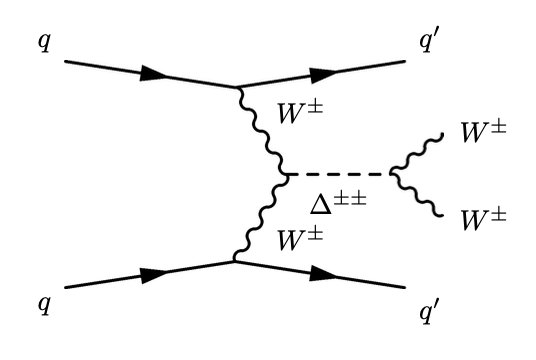
Another framework that can generate Majorana neutrino mass at tree level is type-II seesaw model [10, 11, 12, 13]. In addition to the SM particles, the model is extended by at least one triplet scalar with hypercharge . Another model, called Georgi-Machacek (GM) model [14], further has a real triplet scalar. The doubly-charged scalar from the complex triplet scalar can be produced via vector boson fusion (VBF) process and decays into two bosons with same electric charge along with two forward jets coming from the initial state. The forward jets may not be caught by the detector and hence the resultant final state will mimic our signature of interest. However, later in Sec. 2.3, we will show that due to a stringent -parameter constraint, the type-II seesaw model cannot give a sizeable cross section for this signature, whereas the GM model can.
There are several other channels that have potential to lead to the discovery of the three BSM scenarios considered here. Note that this work does not intend to make a comparative study between the SSdB+ channel of interest here and the other more promising discovery channels. The gist of this paper is to point out possible BSM models that can be a potential source of such a novel signature, if seen in experiments, since it is very unlikely for this signature process to appear within the SM. Since more than one BSM scenario qualify, thus a need to distinguish among them is called for and such a distinction can be accomplished by the use of different sets of cuts.
In this article, we analyze the prospects of discriminating the above-mentioned BSM models through the SSdB + signature at the LHC. We find that the HL-LHC ( TeV and an integrated luminosity of 3 ab-1) is insufficient to probe any of these three models through the signature process. The natural SUSY models can be probed at the HE-LHC ( TeV) with an integrated luminosity of 3 ab-1 while the type-II seesaw/GM model and the type-III seesaw model can be probed at the HE-LHC with an integrated luminosity of 15 ab-1. For completeness, we also extend our analysis to the Future Circular Collider of hadrons (FCC-hh with TeV) with an integrated luminosity of 3 ab-1 and 15 ab-1. The rest of the paper is organized as follows. In Sec. 2, we review the three BSM models and how they give rise to the SSdB + signature. In Sec. 3, the signals from all the three BSM models are optimized against the SM background. We show how each BSM model stands out for a particular set of cuts and discuss the discovery prospect for each scenario. Finally, we conclude in Sec. 4.
2 SSdB + Signature from BSM Models
In this section, we briefly review the three classes of new physics models considered in this work, and how each of them leads to the SSdB + signature at the LHC.
2.1 Supersymmetry
Although weak scale SUSY is a well-motivated BSM framework, experimental searches for sparticles have pushed the masses for squarks and gluino above 1 TeV. For example, current LHC data indicate that > 2.2 TeV [30, 31] and > 1.2 TeV [31, 32, 33]. Such large lower bounds on the masses of sparticles question the naturalness of weak scale SUSY [34]. According to older notions of naturalness, SUSY models with such heavy sparticles are highly fine-tuned or unnatural [35, 36, 37]. However, these earlier notions of naturalness can be updated to a more conservative electroweak naturalness measure, denoted by [38, 39, 40]. A numerical expression for is obtained from minimizing the MSSM scalar potential that equates the boson mass to weak scale SUSY parameters as
| (2.1) |
where is the superpotential higgsino mass parameter, and are the soft SUSY breaking up-type and down-type Higgs mass parameters, respectively, is the ratio of up-type Higgs vacuum expectation value (VEV) to the down-type Higgs VEV, and and denote radiative corrections as given in the Appendix of Ref. [41]).
The electroweak naturalness measure, denoted by , is defined as
| (2.2) |
It is suggested that a conservative choice for natural SUSY models is . Therefore, every point in the parameter space of a SUSY model that yields < 30 is considered to be natural. As can be derived from Eq. (2.1) and Eq. (2.2), < 30 demands:
-
•
. 111The space of ¡ 100 GeV has been ruled out by LEP2 experiment [42].
-
•
should acquire a small negative value at the weak scale. This occurs when is driven radiatively from high-energy scales to the weak scale augmented by a combination of statistical and anthropic pull such that electroweak symmetry is only barely broken [43].
-
•
should also be below . This is attainable with > 1.2 TeV and > 2.2 TeV.
Ref. [16] shows several natural SUSY models that satisfy all the above criteria, with huge parameter space still left to be probed experimentally. As seen from the above conditions, natural SUSY models, assuming gaugino mass unification, have a unique property that where , and refer to the masses of bino, wino and gluino, respectively, at the weak scale. Thus, in these natural SUSY models, the LSP is almost purely higgsino-like. Under assumed R-parity conservation, the LSP becomes a good dark matter candidate in the model and manifests as in collider experiments. However, such a higgsino-like LSP of mass GeV are thermally under-produced. Hence, such an LSP only partially contributes to the total dark matter content of the Universe. In order to account for the entire dark matter content of the Universe, either other particles suitable to form dark matter must be present in the model or the rest of the dark matter must be non-thermally produced. It has been shown in Ref. [44] that the latter case is excluded by experiments. Therefore, the rest of the dark matter must be formed by some other particles. Axion, which arises in a completely different context of solving the strong CP problem via the Peccei-Quinn solution [45, 46, 47, 48, 49, 50, 51, 52], turns out to be an excellent candidate for serving this purpose. Out of various natural SUSY models listed in Ref. [16], we choose the two extra parameter non-universal Higgs (NUHM2) model [3, 4] with which can give rise to a clean SSdB + signature via wino-pair production, as pointed out in Ref. [27, 28]. The corresponding Feynman diagram is shown in Fig. 2.
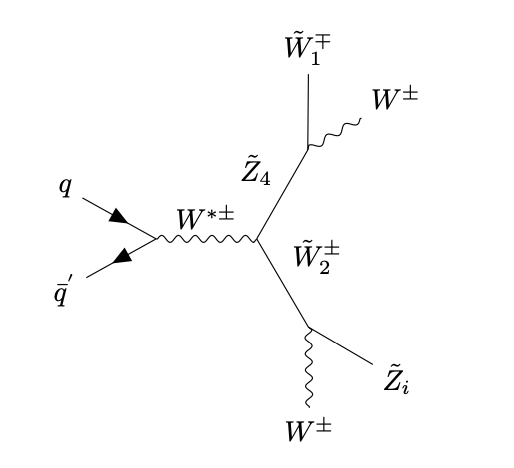
In this work, we have analyzed this signal in detail using the most up-to-date constraints on and obtained from the LHC data with an integrated luminosity () of 139 fb-1 [30, 31] and the XENON1T experiment [53], respectively. The relevant benchmark point is given in Table I.
| parameter | NUHM2 |
|---|---|
| 5000 GeV | |
| GeV | |
| 12 | |
| 1250 GeV | |
| 895 GeV | |
| 1250 GeV | |
| 150 GeV | |
| 2500 GeV | |
| 2938.2 GeV | |
| 5458.3 GeV | |
| 5591.1 GeV | |
| 4840.1 GeV | |
| 1820.5 GeV | |
| 3925.7 GeV | |
| 3959.9 GeV | |
| 5301.7 GeV |
| parameter | NUHM2 |
|---|---|
| 4728.9 GeV | |
| 5061.8 GeV | |
| 5067.2 GeV | |
| 156.6 GeV | |
| 762.9 GeV | |
| 146.0 GeV | |
| 157.9 GeV | |
| 559.8 GeV | |
| 775.4 GeV | |
| 125.1 GeV | |
| 0.007 | |
| (pb) | |
| (pb) | |
| (cm3/sec) | |
| 29.6 |
Here we have assumed a more general scenario without gaugino mass unification [24]. This also has the advantage of having the wino mass GeV while satisfying the LHC constraints on gluino mass [30, 31]. Note that the above choice of wino mass is for a comparison of this signal with a similar one obtained from the type-III seesaw model, as discussed in the next subsection. Also note that even though gaugino mass unification is not assumed, the benchmark point given in Table I satisfies which is an essential criteria for obtaining the signal of our interest via the process shown in Fig. 2.
2.2 The type-III Seesaw Model
In the type-III seesaw model, the SM particle spectrum is extended by multiple triplet fermions (s) which have hypercharge . In order to generate tiny neutrino mass and proper flavor structure in the neutrino sector, one needs to introduce at least two generations of triplet fermions. The tiny neutrino masses are generated at the tree level and can be expressed as , where is the Yukawa coupling, is the SM Higgs VEV, and is the triplet fermion mass [9]. In general, the type-III seesaw scenario with TeV is technically natural and opens up a plethora of implications in collider experiments [55, 56, 29, 57, 58, 59, 60, 61, 62, 63].
In our analysis, we consider three generations of triplet fermions, (), with a non-degenerate mass spectrum. The relevant Lagrangian is given by
| (2.3) |
where is the covariant derivative for , denotes the triplet fermions mass matrix, and is the Yukawa coupling matrix. For the rest of our paper, we refer to the lightest generation of heavy fermions as and their masses as . Depending on a normal or inverted hierarchy, the lightest fermion triplet will be or , respectively. For simplicity, we set the other two generations of heavy fermions to be almost degenerate.
| parameter | Type III Seesaw |
|---|---|
| 770.39 GeV | |
| 770.57 GeV | |
| 670.39 GeV | |
| 670.57 GeV | |
| cm | |
| cm | |
| cm | |
| 44.37 cm |
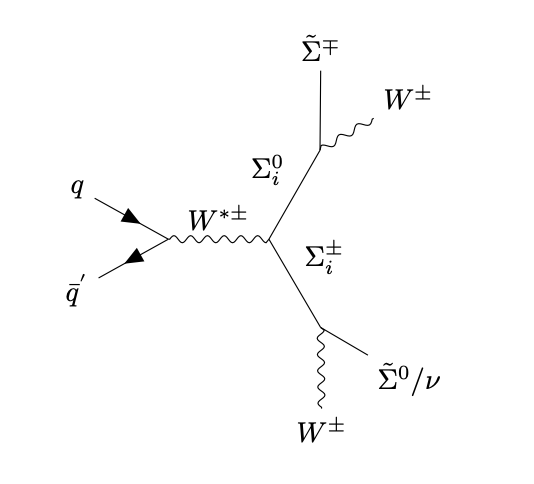
As can be inferred from a detailed calculation of partial decay widths of these triplet fermions in Ref. [29], depending on the neutrino parameters, the electically neutral member of the lightest generation of fermionic triplets of mass around a few hundred GeV can have lifetime long enough to escape detection and hence shows up as large in collider experiments. , being only a few MeV heavier than its neutral partner , travels a short distance before primarily decaying into and a charged pion of momentum low enough to be reconstructed as a track. This results in a disappearing track signature from as can also be seen in Ref. [29]. There are several dedicated searches for the disappearing track signature at the LHC [64]. We recast a recent LHC limit in Ref. [64] to derive a bound on the charged heavy fermion in the type-III seesaw model. We find the lower bound on mass of to be around 670 GeV in order to be consistent with the collider data. In our analysis, we set the other two pairs of heavy fermions to have mass at 770 GeV, so that they primarily decay to a boson and a particle through a tiny mixing. This leads to a clean SSdB + signature from pair production of at the LHC via the Feynman diagram shown in Fig. 3. This particular benchmark point is shown in Table. II.
2.3 Type-II seesaw/Georgi-Machacek model
In this subsection, we focus on the scenario where the SSdB signature originates from the decay of a doubly-charged scalar. Generally, these doubly-charged scalars appear in several BSM frameworks [10, 11, 13, 65, 66, 67, 68, 69, 70, 71, 72, 73, 74, 75, 76, 14, 77, 78, 79, 80, 81]. One such framework is the simplest type-II seesaw model [10, 11, 12, 13] which introduces an triplet scalar with hypercharge . Tiny neutrino masses are generated while the neutral component of the triplet, , acquires a small VEV, . This type of triplet scalar which contains a doubly-charged scalar also appears in Minimal Left-Right Symmetric Model [66, 67, 68] as well as GM model [14].
At the LHC, these doubly-charged scalars () can be pair-produced via the Drell-Yan process (s-channel exchanges). There are several extensive phenomenological studies as well as experimental studies on pair-production of doubly-charged scalars which also look at the final state signatures (for a review, see Ref. [82]). However, we are focusing on the resonant production of the doubly-charged scalar through the VBF process here, as shown in Fig. 4. This production rate is proportional to and becomes more dominant than the Drell-Yan process for GeV and GeV [83, 84]. Note that in the simplest type-II seesaw model [10, 11, 12, 13] is tightly bounded by the electroweak parameter, giving GeV [85]. In the GM model that also contains scalar triplet fields, with hypercharge and with hypercharge , to preserve the custodial symmetry at tree level, can be as high as GeV [86, 87]. As a consequence, the resonant production rate could be much larger than in the simplest type-II seesaw scenario.
| parameter | Type II Seesaw |
|---|---|
| 300.0 GeV | |
| 302.0 GeV | |
| GeV | |
| 1 GeV |
In general the doubly-charged scalar can be either lightest or heaviest depending on the sign of the quartic coupling in the potential. In the rest of our analysis, we consider the scenario where is the lightest among all members in the triplet fields. In this scenario, dominantly decays into same-sign dilepton (SSdL) () or SSdB (), depending on the value of [88, 89, 90]. In Fig. 5, we show a complete decay phase diagram of the doubly-charged scalar of mass 300 GeV. As shown in the plot, dominantly decays to two same-sign bosons for 1 MeV, provided the mass splitting 5 GeV. For our analysis, we set the mass splitting = 2 GeV and 1 GeV so that this benchmark point (shown in Table III) lies in the blue shaded region of Fig. 5 that is of our interest. Thus, after being produced at the LHC along with two forward jets, decays primarily to two same-sign bosons. These jets may escape detection, especially in the forward region with lower detector efficiency. Assuming leptonic decay of the bosons, we obtain SSdL + in the final state. In this case, the final state mimics the signature of our interest.

Being proportional to , the cross section obtained for this signature in the type-II seesaw models, even before any cuts, is negligibly small even for = 1 GeV. As stated above, the GM model can accommodate as high as 50 GeV. Hence, from now on, we will be considering the GM model, instead of the simplest type-II seesaw model, assuming = 10 GeV, which is an arbitrary choice. The cross section for the stated signal is now sufficiently large to be detectable at the LHC and can scale easily with .
3 Signal and Background Evaluations
Here in this section we systematically investigate the signal and the background for the aforementioned models. Considering leptonic decays of the bosons, the signal of interest here has a final state of SSdL + , where the leptons include the electron and muon. As stated in Sec. 2, we can obtain such a signal from wino pair production in NUHM2 model in SUSY, pair production of heavy triplet in type-III seesaw model, and the resonant production of the doubly-charged scalar in the GM model when the forward jets go undetected. Note that, a final state of SSdL + can also be obtained from gluino/squark pair production in SUSY models [91, 92, 93, 94]. However, this signature can be distinguished from the signal studied here because the SSdL + from gluino/squark pair production appears along with large number of hard central jets. We evaluate the signal from all the three models and the background from the SM, and optimize cuts to efficiently reduce the background. As compared to an earlier analysis in Ref. [28], three new backgrounds, namely, , and have been included here. Therefore, the relevant SM background processes are: , , , , , , , , and .
As discussed in Sec. 2.2, for our analysis the mass of is taken to be around 670 GeV so as to satisfy the mass constraint in Ref. [64] and we take of mass 770 GeV to ensure that primarily decay to and . Hence, we take a suitable benchmark point in the NUHM2 model as well, with the wino-like particles ( and ) also attaining a mass of around 770 GeV, so that the signals from the type-III seesaw model and the NUHM2 model are at par with each other, as stated earlier in Sec. 2.1. However, for the GM model, we have considered = since the limit is less stringent on the mass of ( [83]) while looking for the bosonic final state signatures at the LHC. Using the same argument, we could have taken lower mass for the wino-like particles ( and ) in the NUHM2 model but then the NUHM2 benchmark point would not satisfy various constraints such as the mass limit on gluino from the LHC, dark matter constraints from direct detection experiments, etc.
For simulations, we have used MadGraph5aMC@NLO [95, 96] for event generation, interfaced with Pythia 8.2 [97] for parton showering and hadronization, followed by Delphes 3.4.2 [98] for detector simulation where the default Delphes card is employed. Therefore, in the detector level simulation:
-
•
The anti- jet algorithm [99] has been used with and GeV.
-
•
The default jet flavor association module has been used that identifies a jet containing a -hadron as a potential -jet if the -hadron lies within of the jet axis. Such -jets are tagged with efficiency with a mistagging probability of for other lighter jets following CMS -tagging algorithm [100].222The -tagging and misidentification rates considered here are from those used for TeV collisions. We have also used the -tagging and misidentification rates from those used for TeV collisions, where -jets are tagged with an efficiency of and a mistagging probability of for other lighter jets following a more recent CMS -tagging algorithm [101] for the process and found similar results after the same cuts.
- •
-
•
The and leptons are isolated following the criterion that the ratio of the sum of transverse momenta higher than 0.5 GeV of all particles that lie within a cone of around the lepton to the transverse momentum of that lepton is less than 0.25.
We have used Isajet 7.88 [54] to generate the Les Houches Accord (LHA) file for the NUHM2 signal and pass it through the above-mentioned simulation chain.
We have used Prospino [104] to calculate the leading-order (LO) and next-to-leading-order (NLO) cross sections for the NUHM2 signal process and type-III seesaw signal process for 14 TeV LHC. Since Prospino is designed specifically for calculating NLO cross sections of SUSY processes, using it to calculate the same for the type-III seesaw model is made possible by utilizing the analogy between the type-III seesaw model and the minimal anomaly-mediated SUSY breaking (mAMSB) model [6, 105, 106]. The mAMSB model has a wino-like LSP () and a wino-like next-to-LSP (NLSP) (), analogous to the type-III seesaw model with its lightest and next-to-lightest particles being and , respectively. Thus, a suitable mAMSB parameter space point has been used to calculate the LO and NLO cross sections for the type-III seesaw model.
We have used the K-factor for the type-II seesaw models (and hence the GM model), as done in Ref. [107]. The K-factors for the SM background processes are used as in Ref. [28]. We obtain the K-factor for the process from Ref. [108]. The K-factor for the process has been used as in Ref. [109, 110, 111]. For the process, we use the same K-factor as for , as suggested in Ref. [112]. We generate events for the process and events for all the other background and signal processes for TeV. While for TeV, we generate events for the and processes and events for all the other background and signal processes.
Motivated by the earlier analyses [27, 28], we put a set of basic cuts, dubbed the S1-cuts, to reduce the SM backgrounds. Explicitly, the S1-cuts include:
-
•
Require exactly two same-sign isolated leptons, where the isolated leptons are defined as those with GeV and .
-
•
Veto events with any identified -jet.
-
•
Require GeV, where denotes the leading lepton.
In the following subsections, we show how each BSM model stands out by further imposing a particular set of additional cuts.
3.1 Supersymmetry Analysis
In the NUHM2 signal, the LSP , due to R-parity conservation, is stable and shows up as at the LHC. The particles and , being not much heavier than the LSP, promptly decay into very soft leptons and the LSP. These leptons are so soft that they pass the detector undetected. Hence, and also show up as at the LHC. Hence the NUHM2 signal has large missing transverse energy (). Similarly, the NUHM2 signal also has large minimum transverse mass () which is defined as:
| (3.4) |
It turns out that we cannot gain a sufficient cross section for TeV. Therefore, we extend the analysis to TeV. Although TeV is sufficient to render a significance above 5, we also show an analysis for TeV. Inspired by the earlier analyses done in this context [27, 28], we further impose the following set of cuts:
-
•
Require GeV.
-
•
Require GeV.
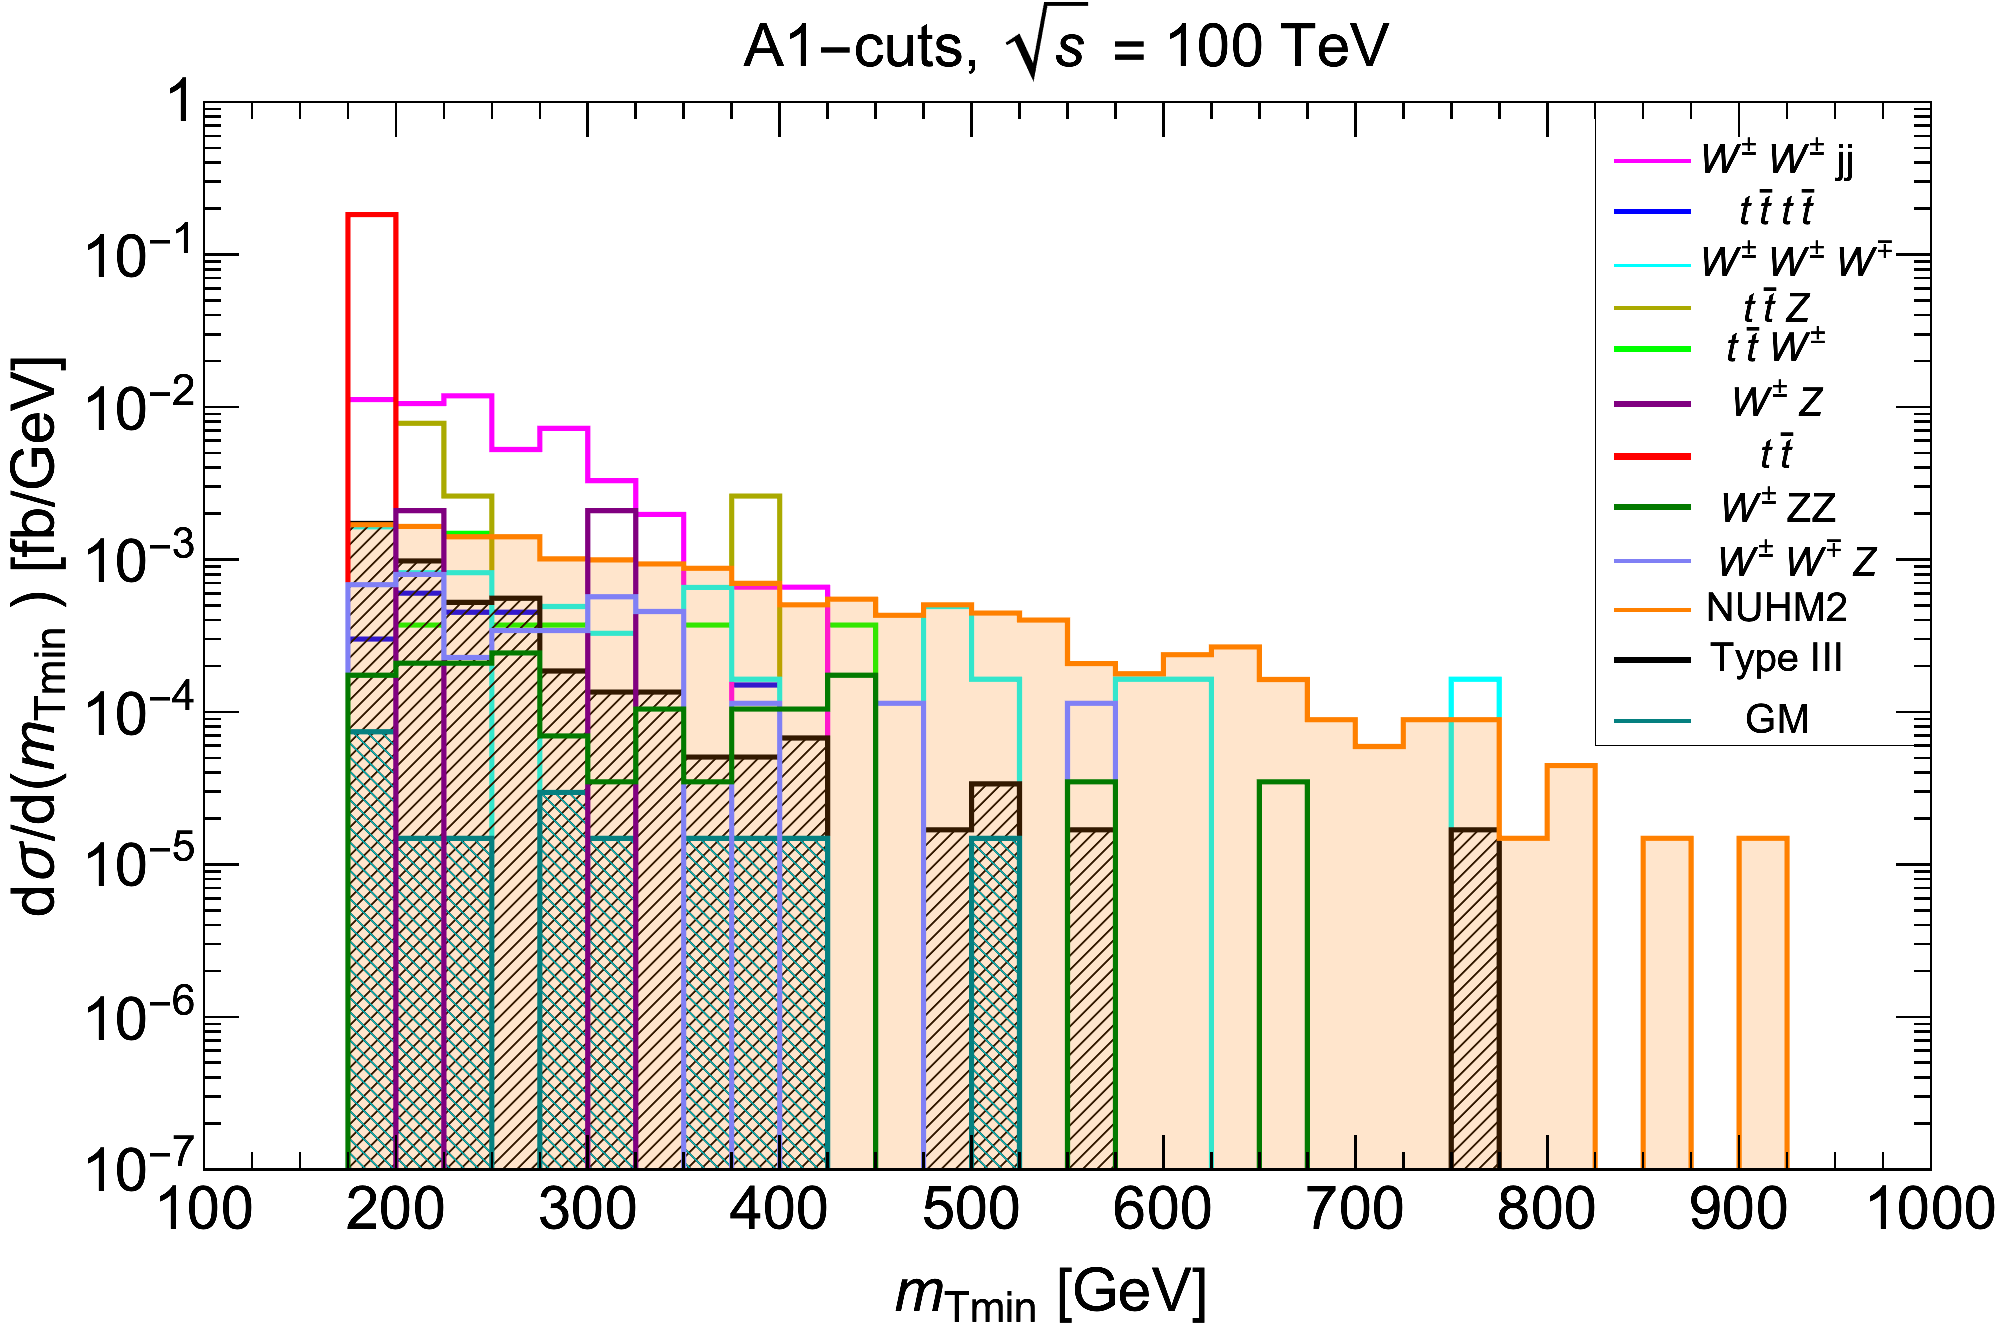
Together with the S1-cuts, we call the entire set of cuts as the A1-cuts. After the A1-cuts, we plot the distribution in Fig. 6(a) for TeV and in Fig. 6(b) for TeV.
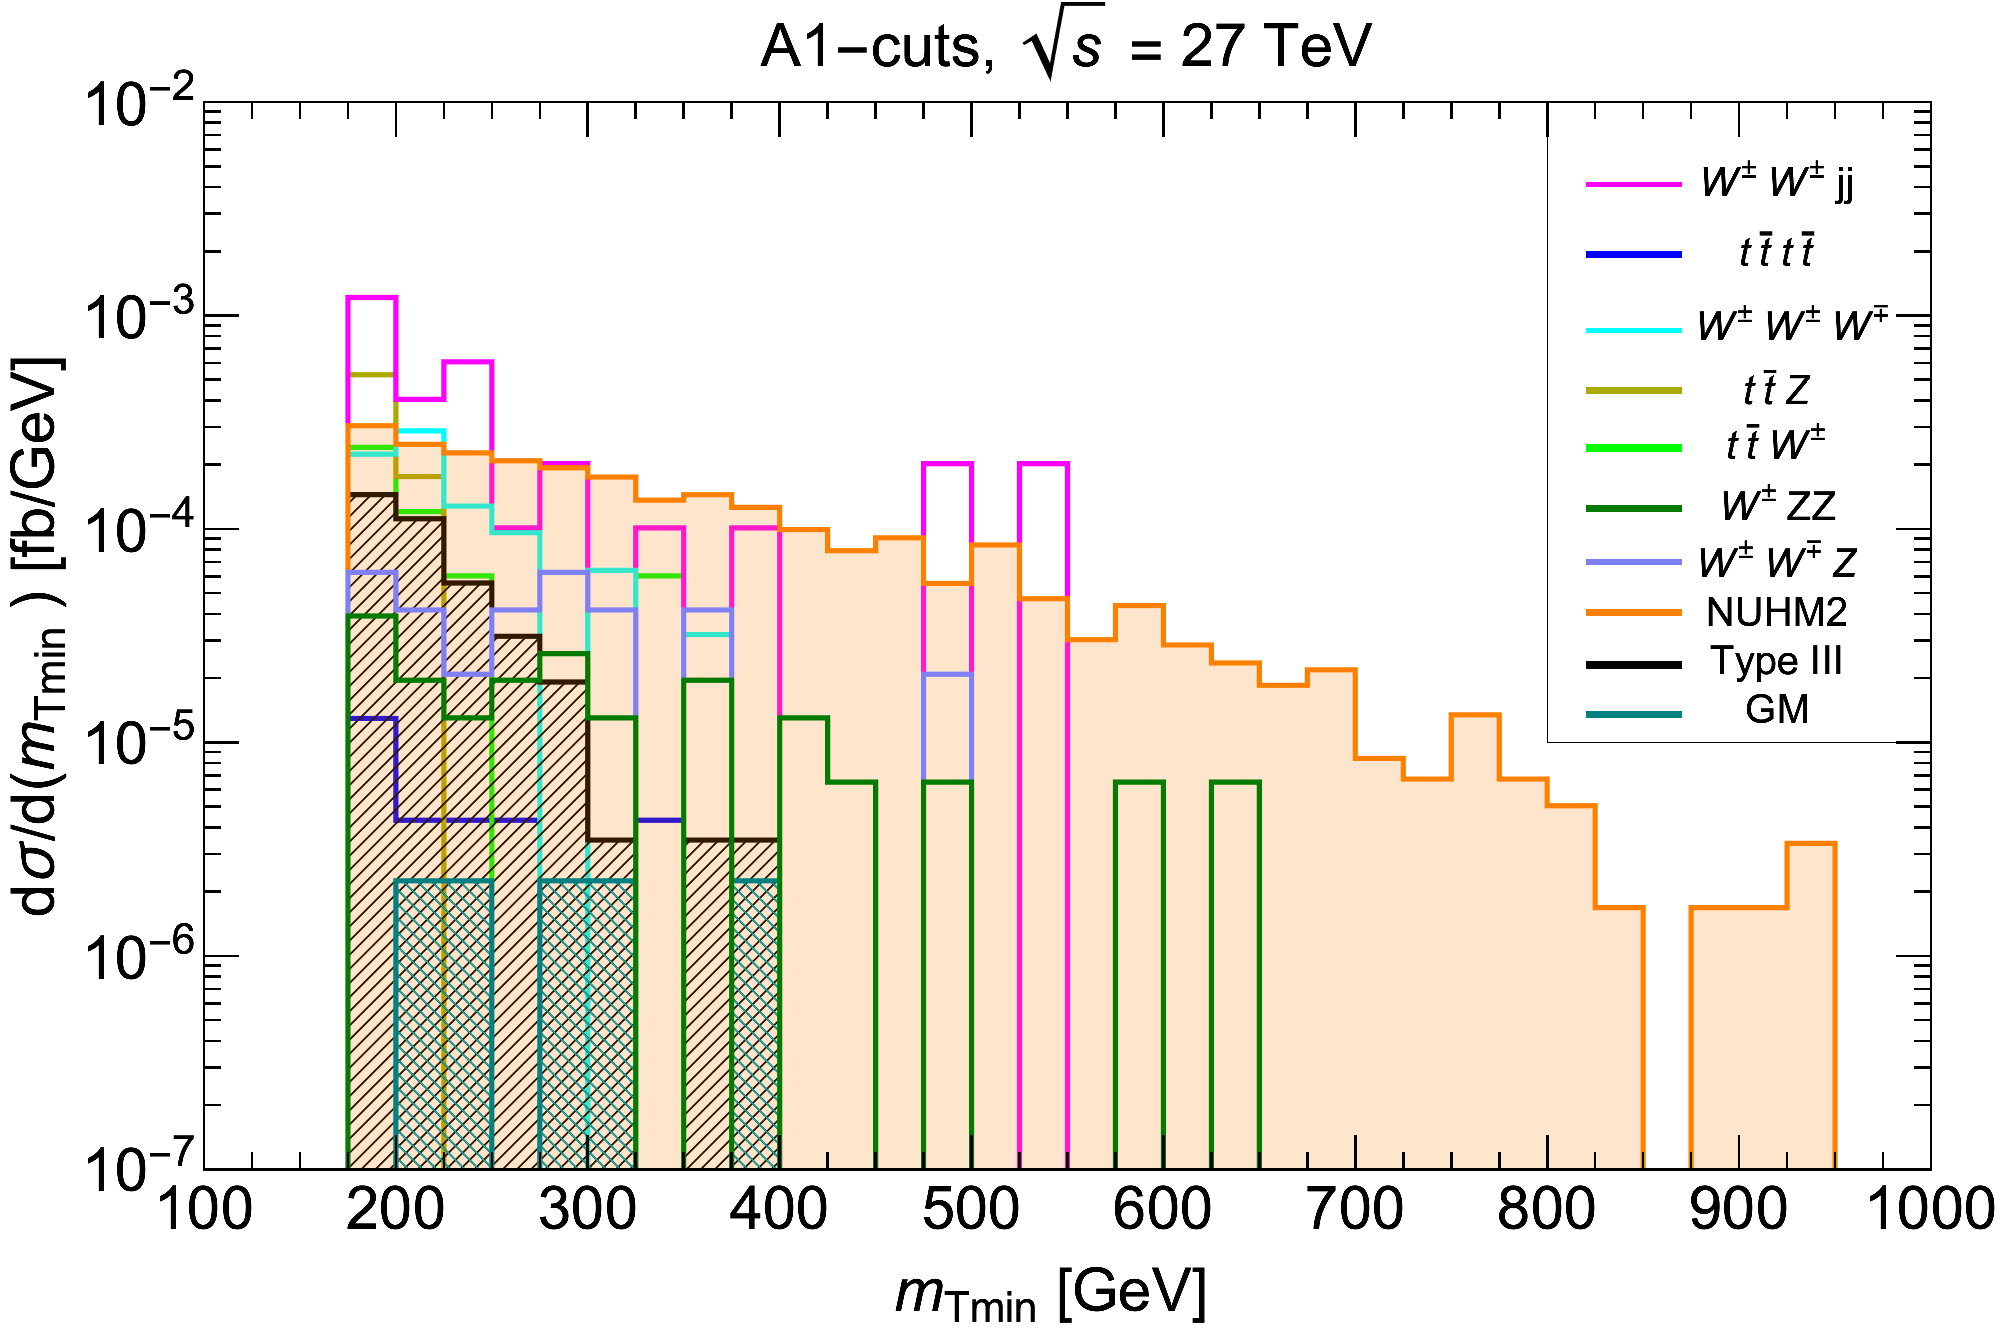
As suggested by Fig. 6(a), a cut of GeV, if employed after the A1-cuts, would reduce the SM background to some extent. Therefore, we have the A2-cuts:
-
•
A1-cuts + GeV.
Similarly, Fig. 6(b) suggests that a cut of GeV would be highly beneficial in significantly reducing the SM background at TeV. Therefore, we have the A2′-cuts:
-
•
A1-cuts + GeV.
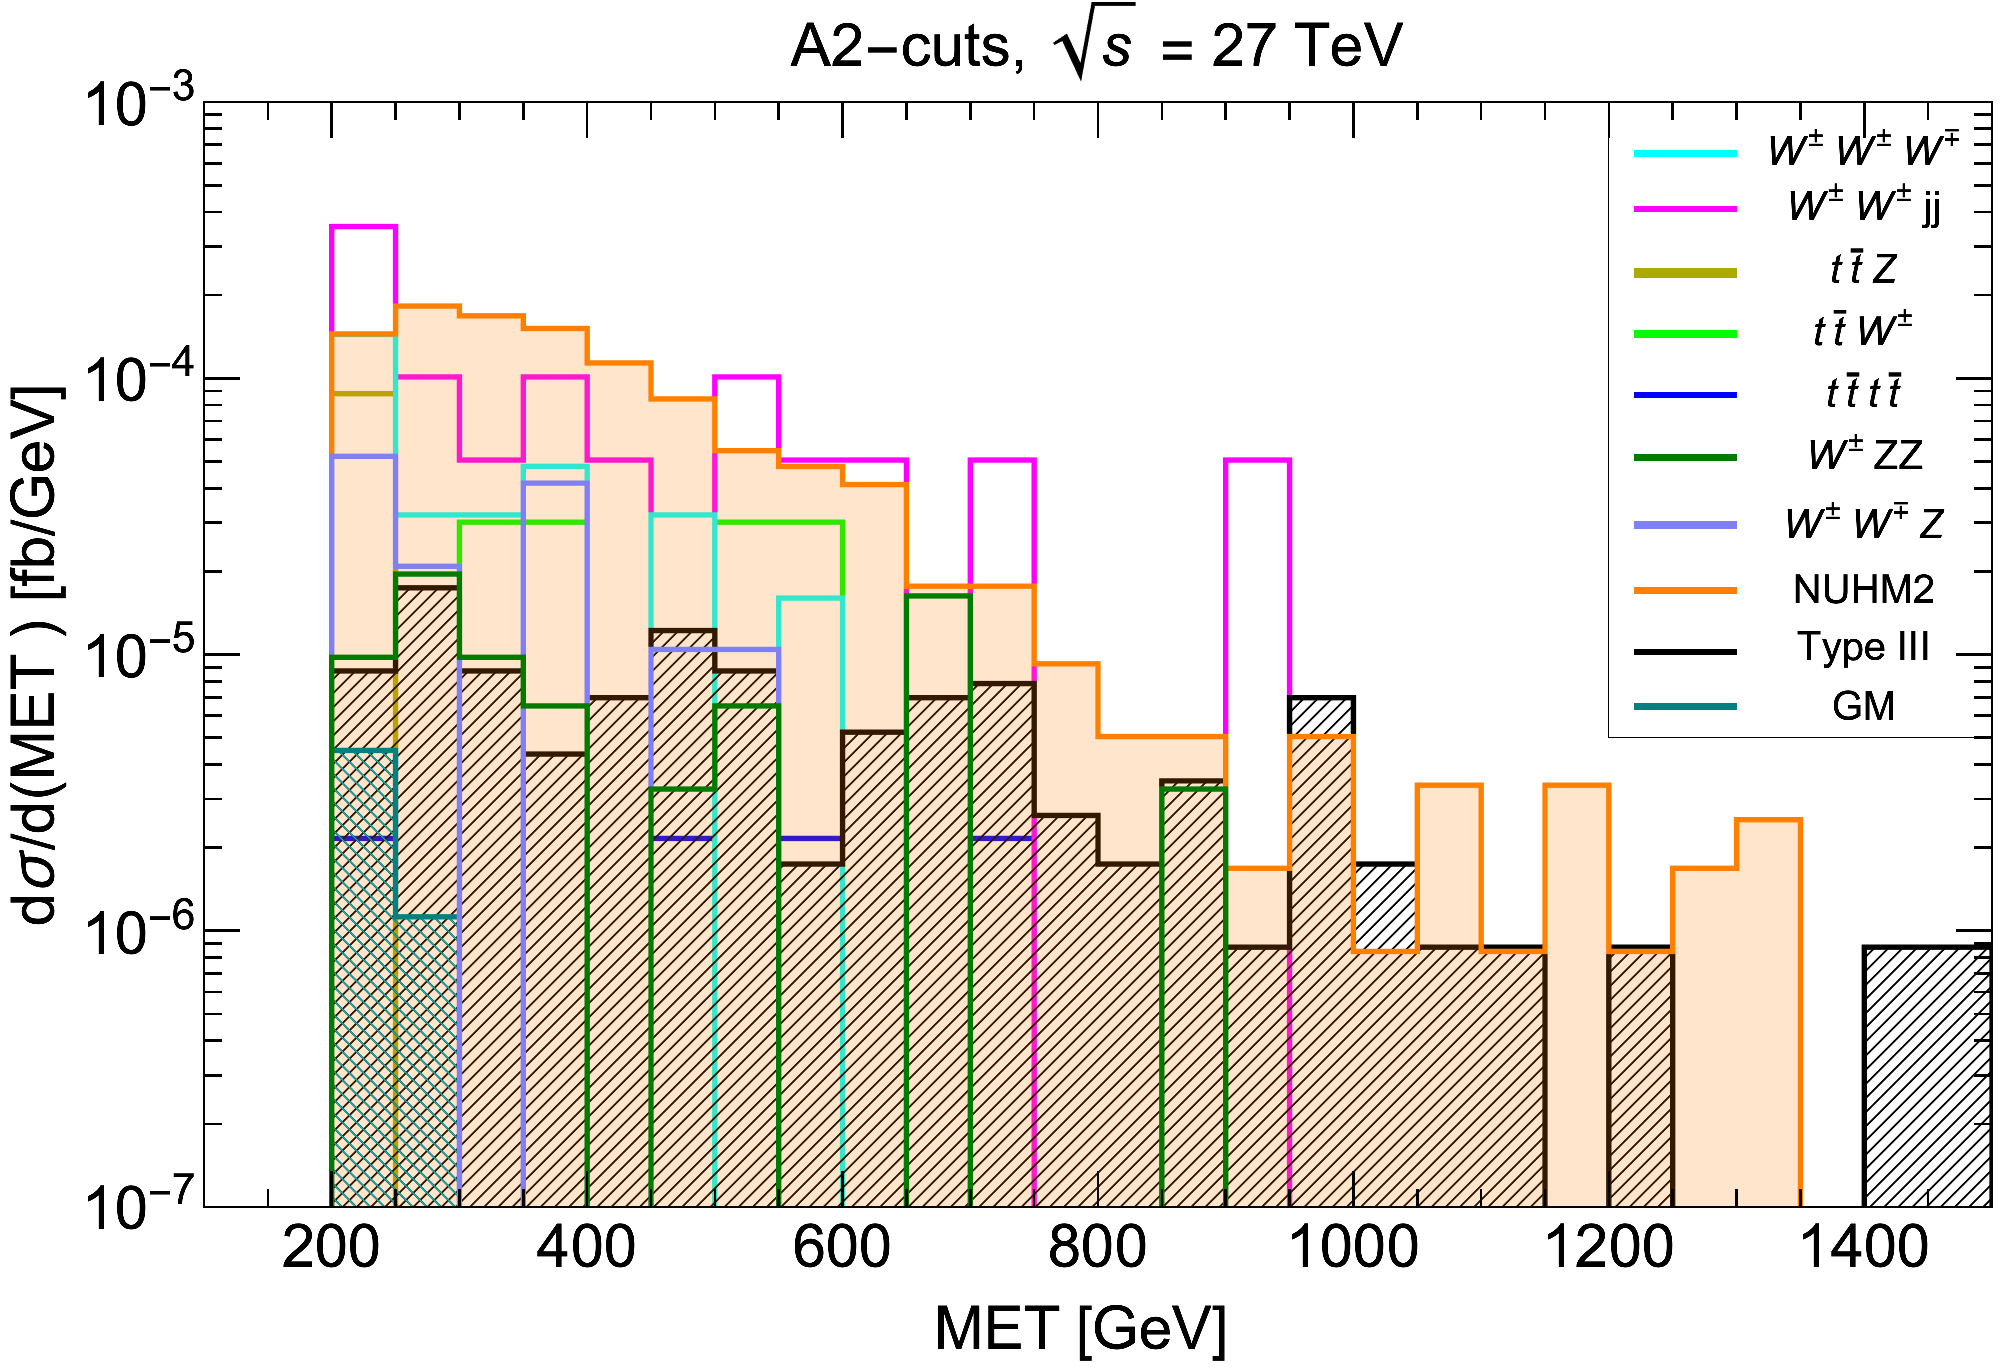
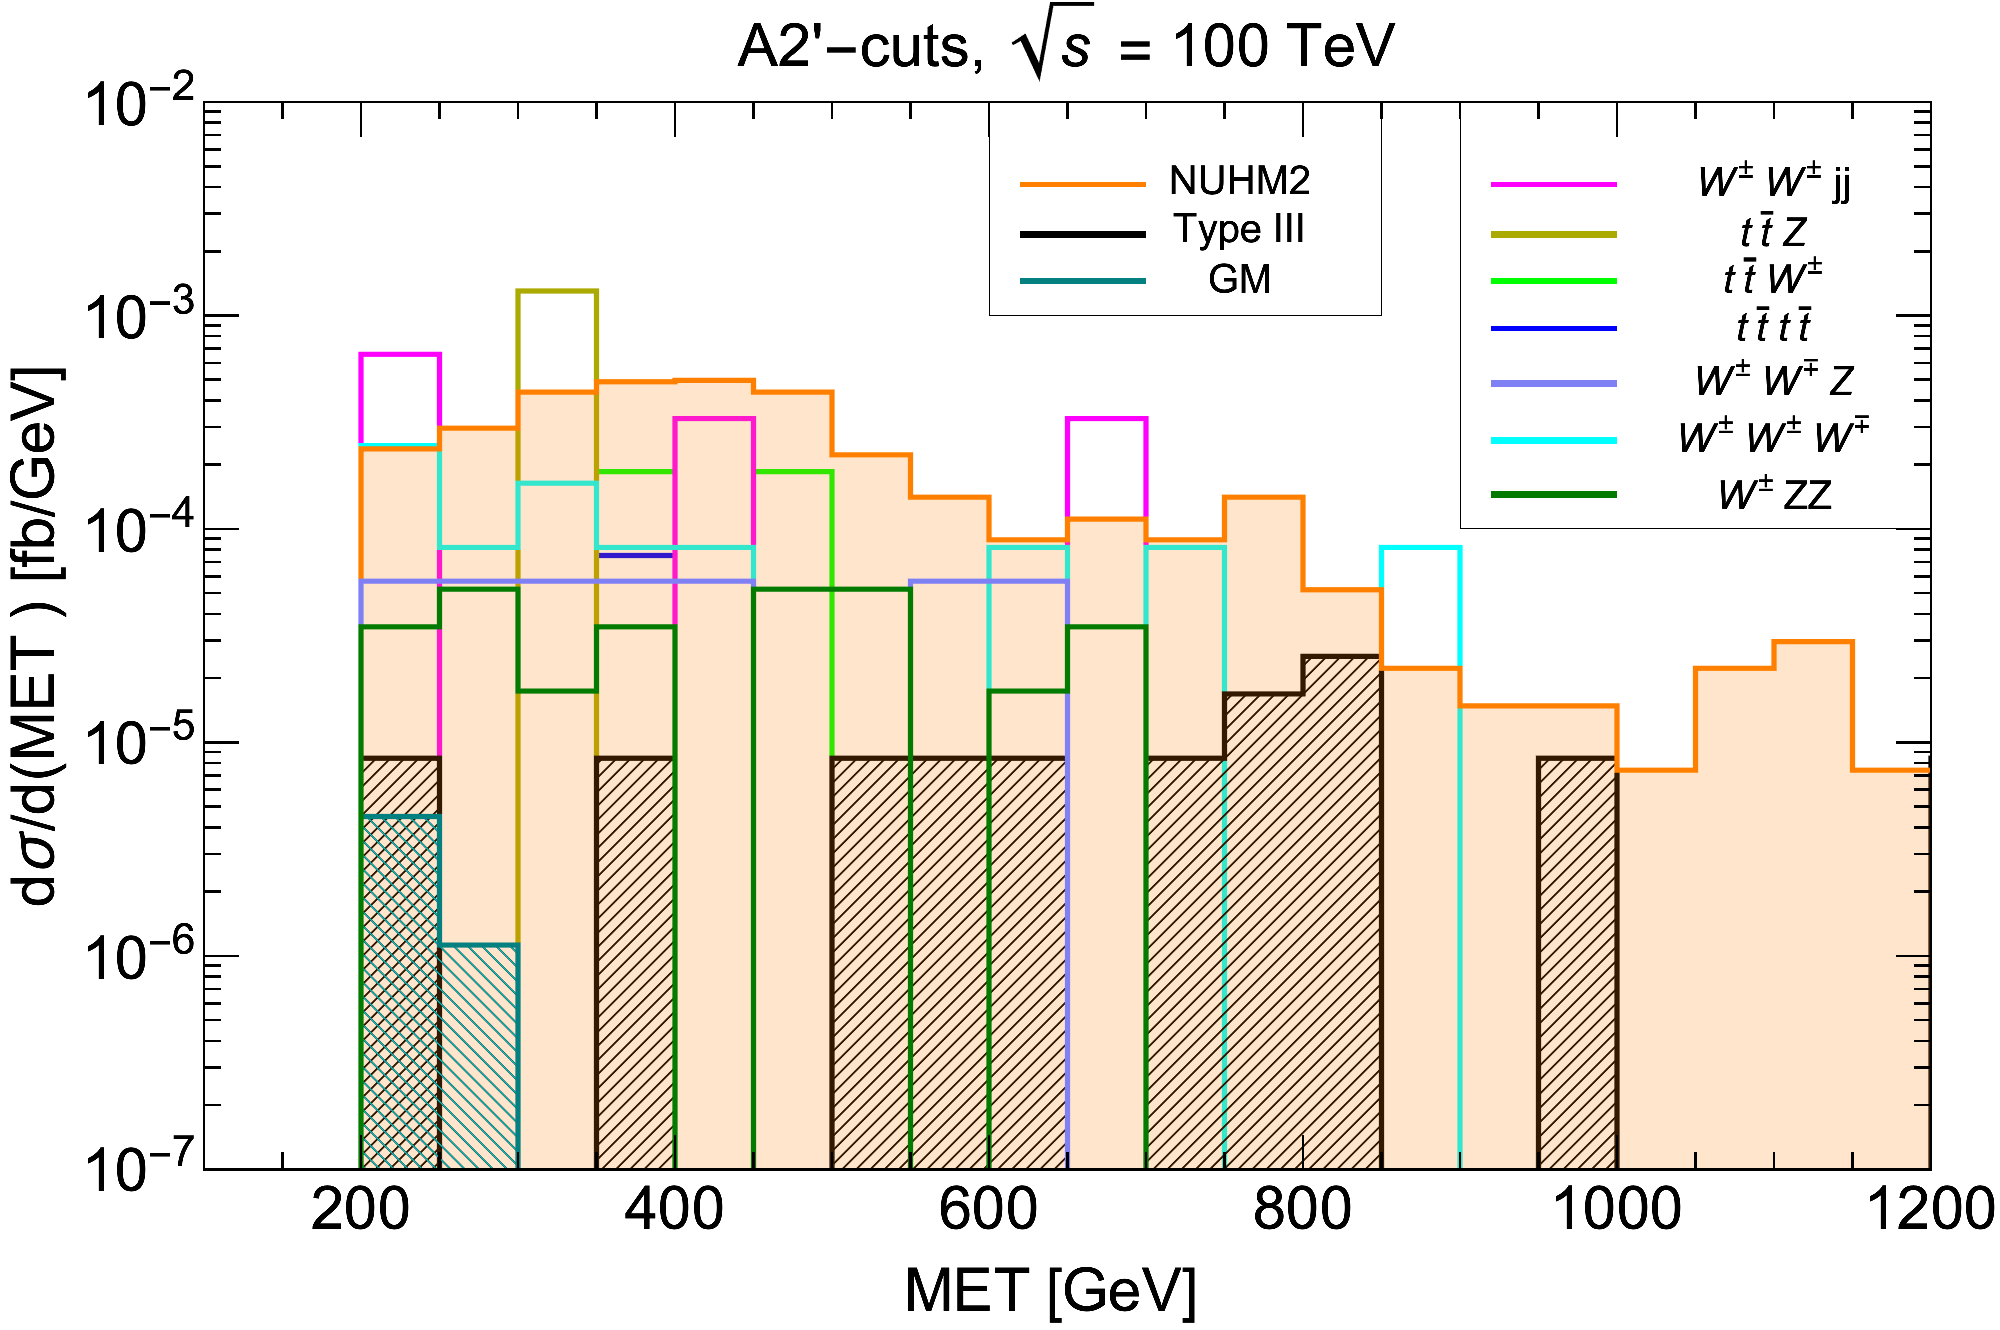
After the A2-cuts and A2′-cuts, we plot the distribution for TeV and TeV in Fig. 7(a) and Fig. 7(b), respectively.
As shown in Fig. 7(a) (7(b)), a cut of GeV ( GeV), applied after the A2 (A2′)-cuts, would result in a cleaner NUHM2 signal with efficiently reduced SM background as well as heavily reduced signal cross sections for the other two BSM models at TeV ( TeV). Therefore, we finally have the A3-cuts:
-
•
A2-cuts + GeV.
and the A3′-cuts:
-
•
A2′-cuts + GeV.
The cut flow is summarized in Table IV.
| TeV | |||||||
| Process | K-factor | (NLO) [ab] | A1 [ab] | A2 [ab] | A3 [ab] | Significance | |
| 3 ab-1 | 15 ab-1 | ||||||
| NUHM2 | 1.17 | 60.9 | 53.3 | 46.1 | () | () | |
| type-III | 1.16 | 9.33 | 5.7 | 5.3 | () | () | |
| GM | 1.26 | 0.28 | 0.28 | 0.0562 | () | () | |
| 1.72 | 0 | 0 | 0 | - | - | ||
| 1.27 | 0.8 | 0.4 | 0.3 | - | - | ||
| 1.24 | 12.1 | 6.03 | 6.03 | - | - | ||
| 1.39 | 17.6 | 4.4 | 0 | - | - | ||
| 1.04 | 78.4 | 48.04 | 30.3 | - | - | ||
| 2.45 | 20.8 | 15.2 | 8.0 | - | - | ||
| 1.88 | 0 | 0 | 0 | - | - | ||
| 1.7 | 0 | 0 | 0 | - | - | ||
| 2.0 | 8 | 7 | 4.2 | - | - | ||
| 2.0 | 4.7 | 3.7 | 3.2 | - | - | ||
| Total BG | 142.4 | 84.77 | 52.1 | - | - | ||
| TeV | |||||||
| Process | K-factor | (NLO) [ab] | A1 [ab] | A2′ [ab] | A3′ [ab] | Significance | |
| 3 ab-1 | 15 ab-1 | ||||||
| NUHM2 | 1.17 | 374.4 | 170.5 | 121.9 | () | () | |
| type-III | 1.16 | 112.55 | 10.1 | 9.7 | () | () | |
| GM | 1.26 | 5.2 | 1.5 | 0.4 | () | () | |
| 1.72 | 4570.0 | 0 | 0 | - | - | ||
| 1.27 | 48.8 | 4.0 | 4.0 | - | - | ||
| 1.24 | 83.5 | 18.5 | 18.5 | - | - | ||
| 1.39 | 325.5 | 65.1 | 0 | - | - | ||
| 1.04 | 1315.2 | 82.0 | 49.3 | - | - | ||
| 2.45 | 151.5 | 49.0 | 24.6 | - | - | ||
| 1.88 | 104.5 | 0 | 0 | - | - | ||
| 1.7 | 0 | 0 | 0 | - | - | ||
| 2.0 | 94 | 20 | 11.4 | - | - | ||
| 2.0 | 38.3 | 14.8 | 9.6 | - | - | ||
| Total BG | 6731.3 | 253.4 | 117.4 | - | - | ||
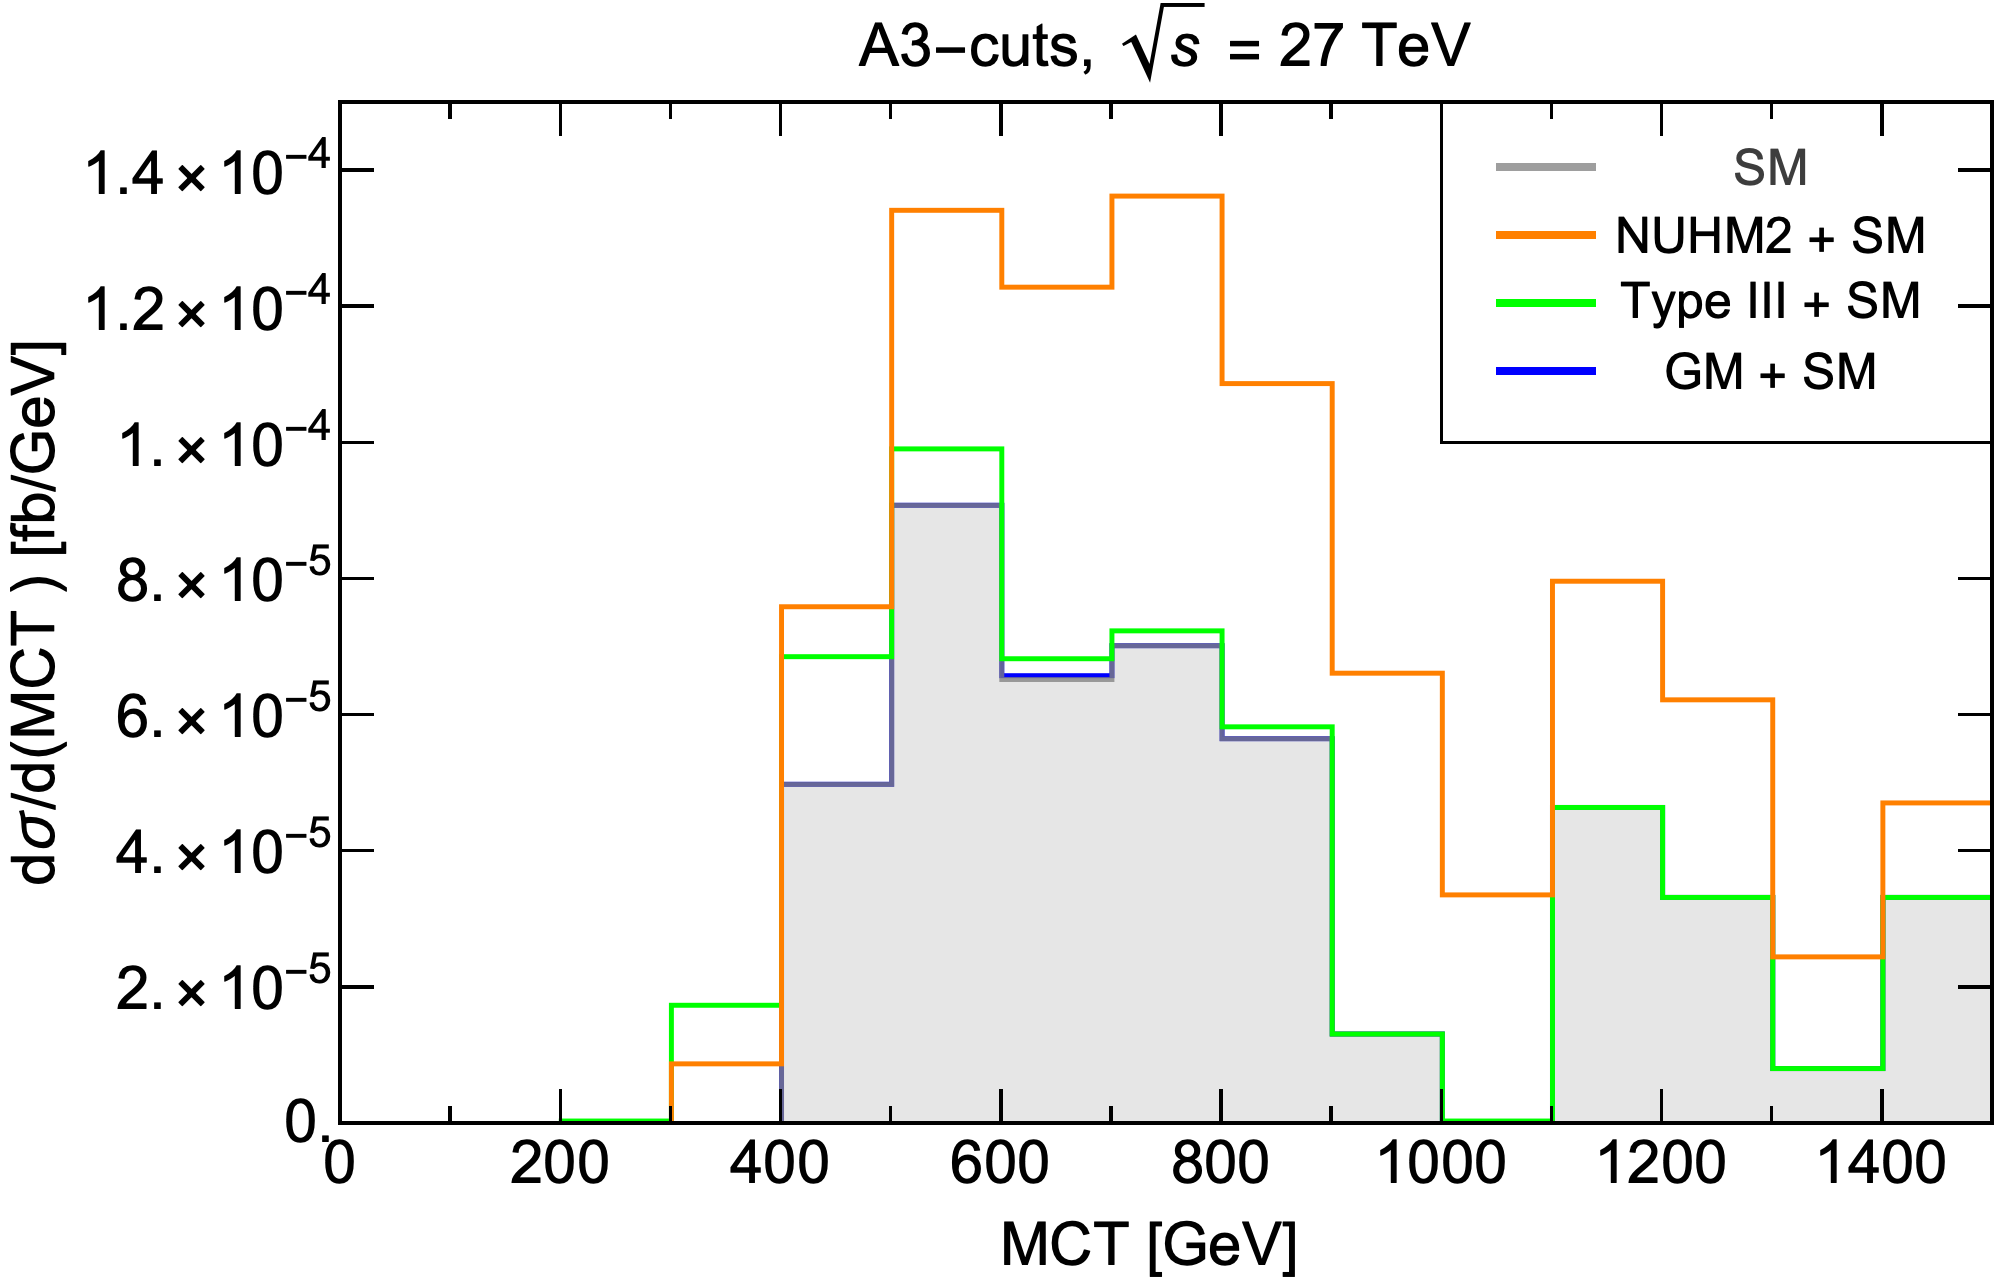
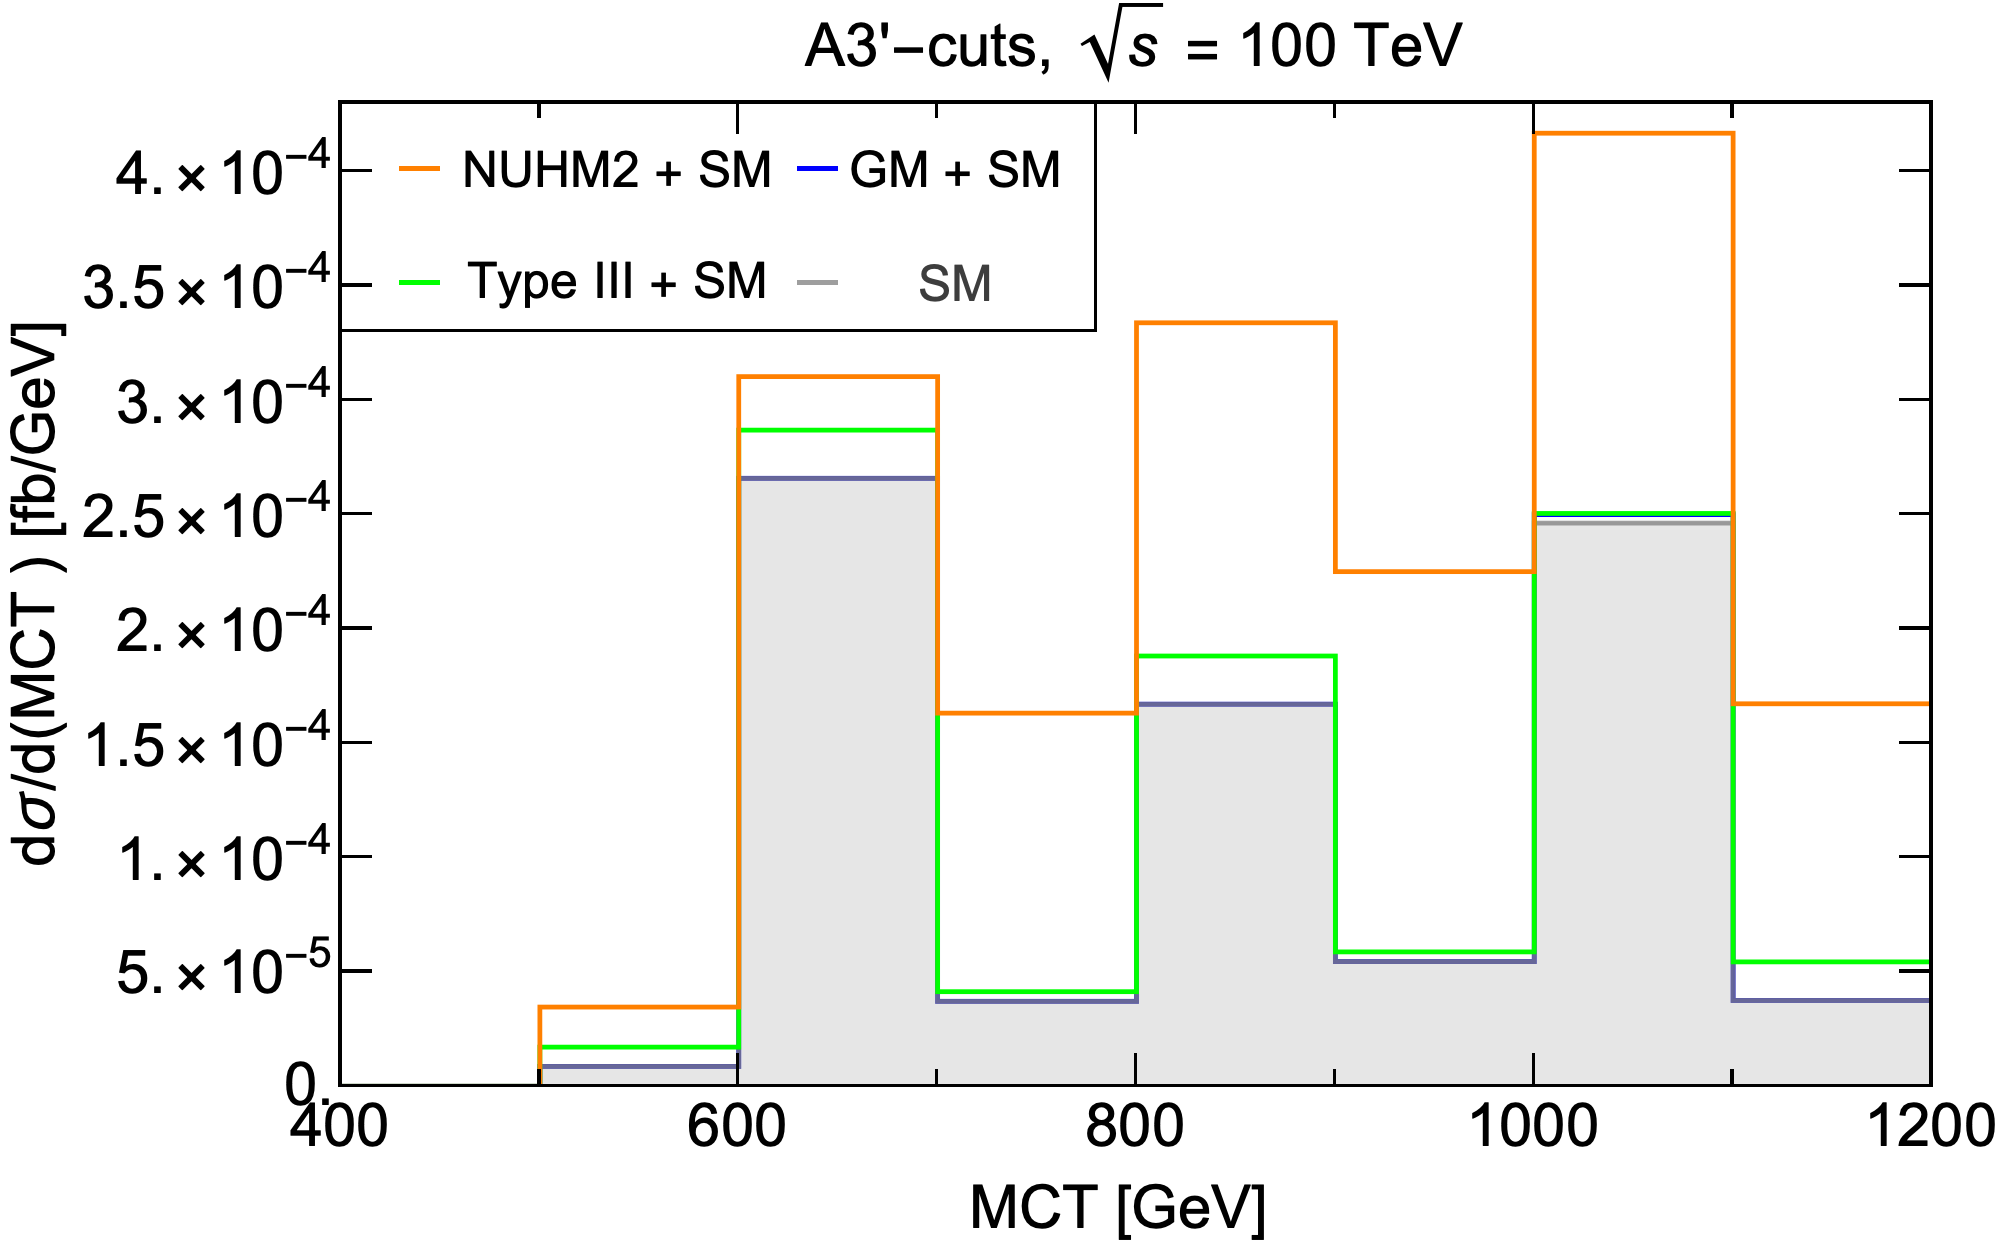
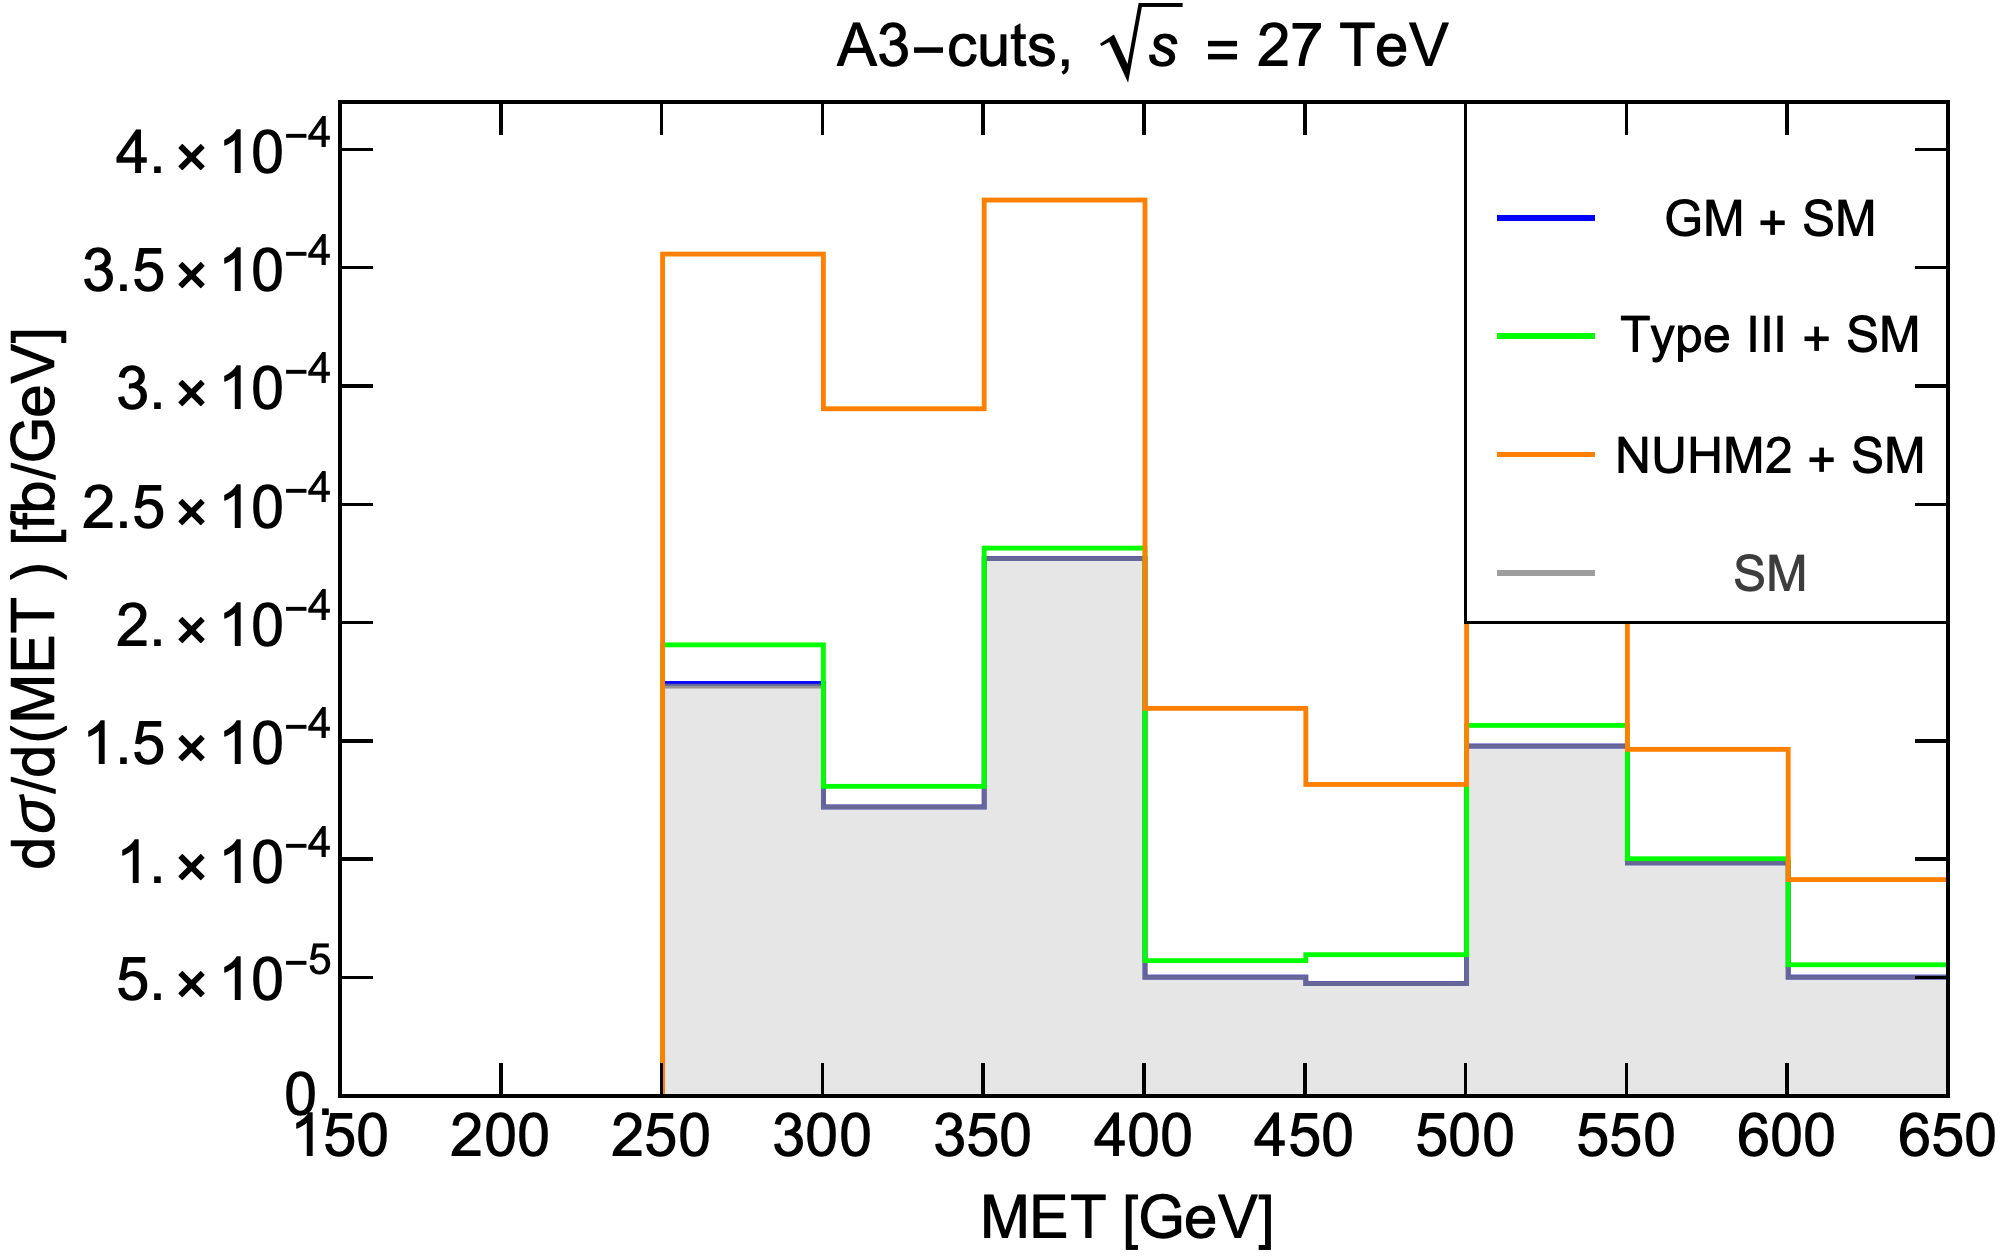
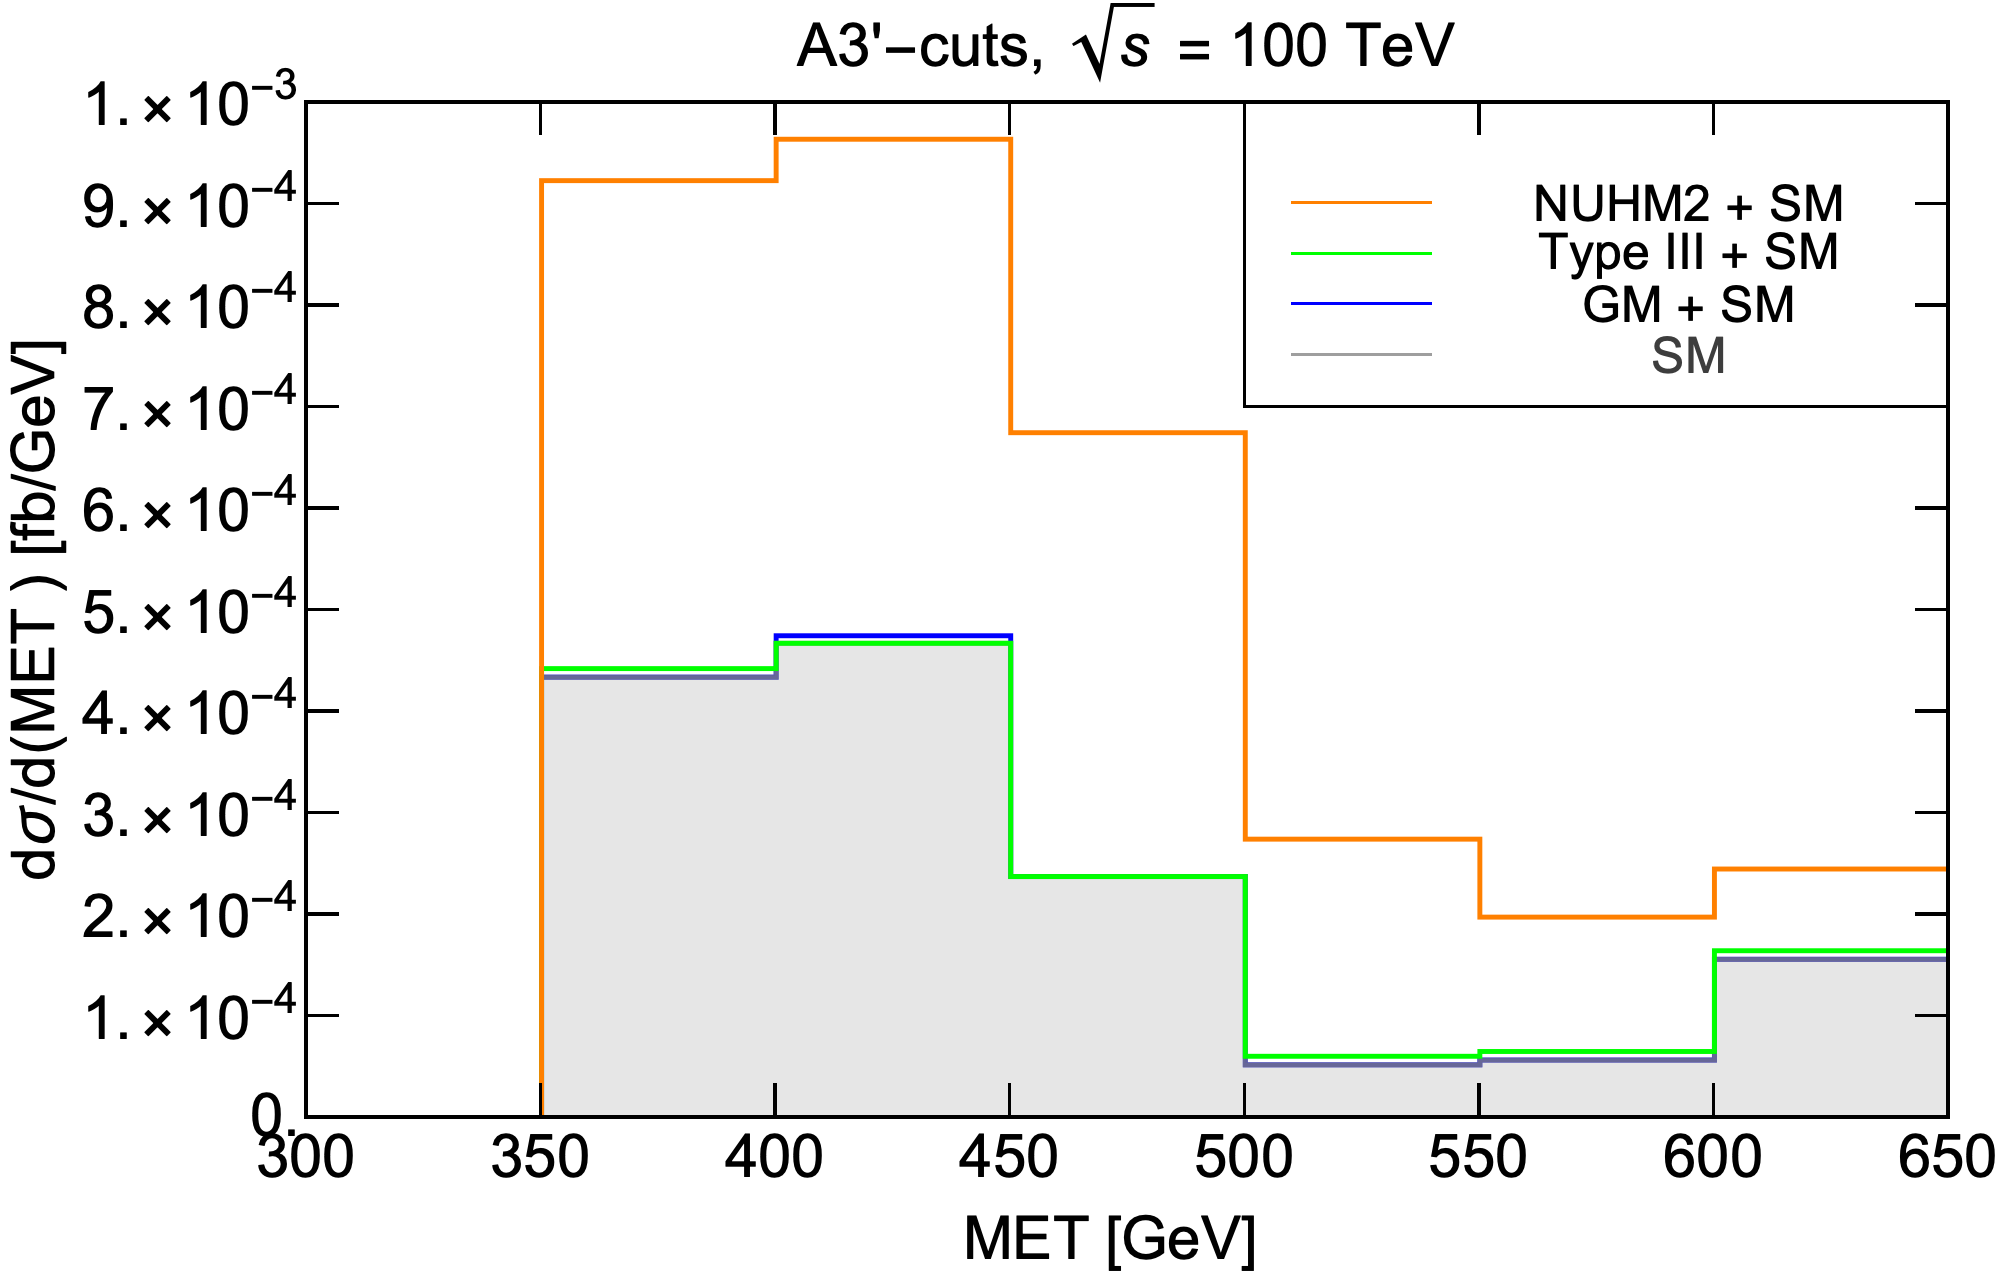
After the A3 and A3′-cuts for TeV and TeV, respectively, a sufficient NUHM2 signal cross section is retained, while the SM background and signals from the other two BSM models are greatly reduced.
The statistical significance of the signal has been computed using the relation . We have shown the significance for center of mass energy () at TeV and TeV with an integrated luminosity = 3 ab-1 and 15 ab-1 in Table IV. Note that, on calculating the significance at TeV and = 3 ab-1, the NUHM2 BM point chosen here yields . This result is different from that obtained in an earlier analysis in Ref. [28] mainly due to differences in the detector-level simulations in these two cases. Moreover, in order to show the impact of systematic uncertainties, we compute the significance considering 3 systematic uncertainties using the relation with . We find that the significance drops down while we consider systematic uncertainties, as shown in parenthesis in Table IV. From Table IV, we can see that after the A3 and A3′-cuts for TeV and TeV, respectively, the NUHM2 signal yields a significance above 5 while the type-III and GM models don’t, with or without considering the 3 systematic uncertainties.
We have plotted the cluster transverse mass (MCT) distribution and the distribution after A3 and A3′-cuts at the respective energies for the total SM background and various signals on top of it in Fig. 8.
3.2 Type-III Seesaw Analysis
We cannot gain a sufficient cross section for TeV for the type-III seesaw signal either, and therefore consider TeV and TeV. We start with S1-cuts as defined earlier.
It is expected that after the S1-cuts all the SM backgrounds, considered here, should have numerous jets while the type-III seesaw signal can have jets only from initial state QCD radiation. Therefore, requiring only those events that have less than two jets would significantly reduce the SM background while retaining enough type-III seesaw signal.
Similar to the NUHM2 signal, the type-III signal will also show high . However, since in type-III signal, the mass difference between the intermediate state and the final state is not as high as that in the NUHM2 signal, hence the distribution does not tail out as high as the NUHM2 signal. Therefore, for TeV ( TeV), we apply a cut of GeV ( GeV), a less stringent cut on as compared to that applied in case of NUHM2 signal.
For the same reason as mentioned above, we employ a less stringent cut on as well: a cut of 105 GeV GeV.
A cut on the upper limit of has been applied in order to reduce the NUHM2 signal and yet retain most of the type-III signal as for NUHM2 signal the distribution tails out to a much higher value than that in the type-III signal. The cut on the upper limit of is thus necessary to differentiate between the NUHM2 and the type-III signal. Therefore after S1-cuts we apply three additional cuts, namely, njet , GeV and 105 GeV GeV and name this entire set of cut as B1-cuts:
-
•
S1-cuts + njet + GeV + 105 GeV GeV.
At TeV, we use a slightly tougher cut on and apply B1′-cuts, which include:
-
•
S1-cuts + njet + GeV + 105 GeV GeV.
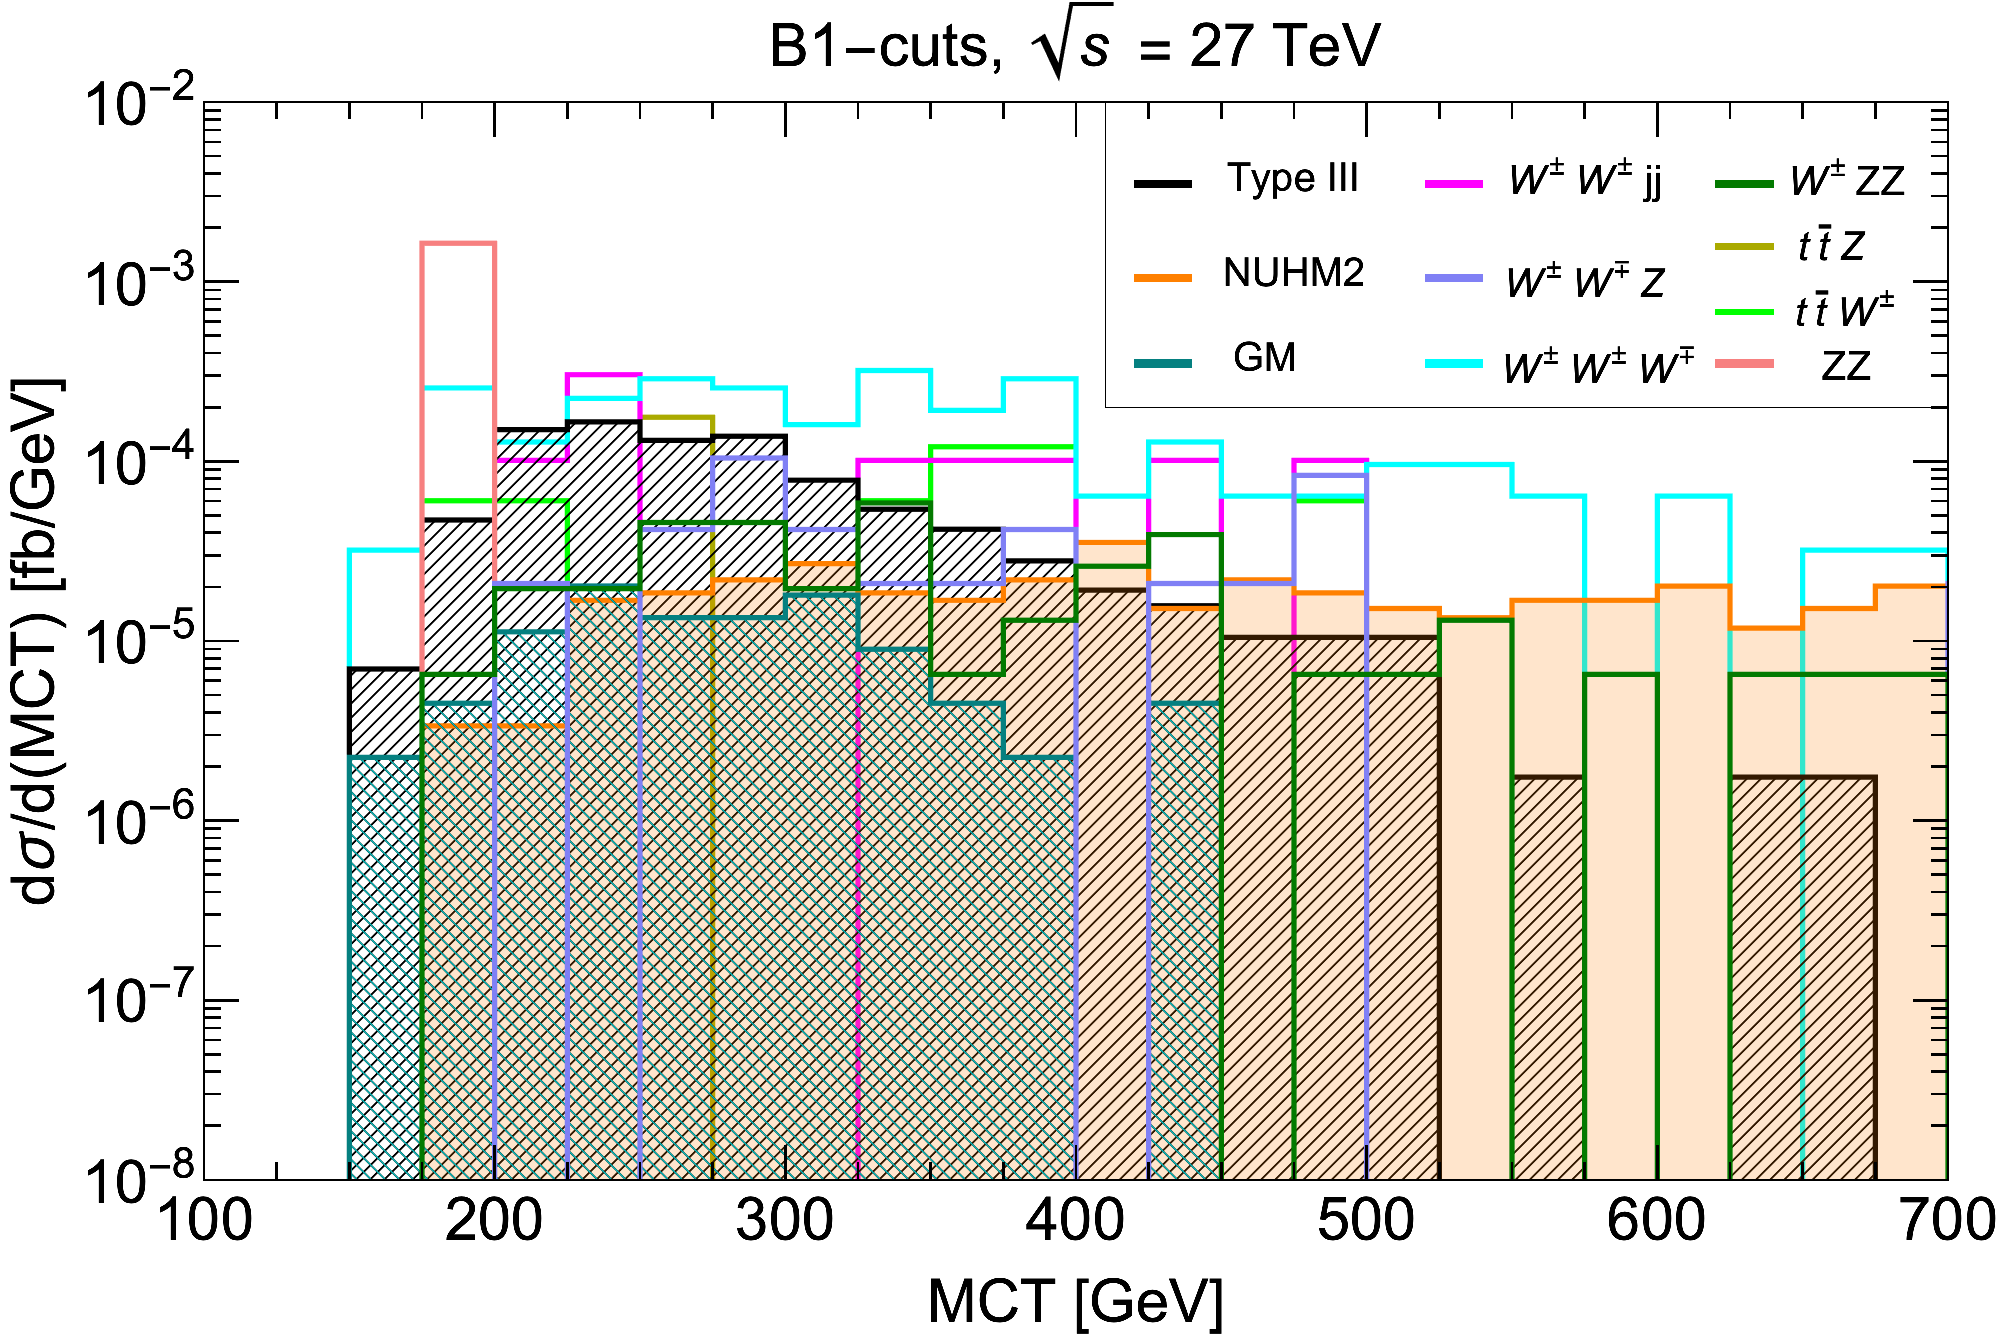
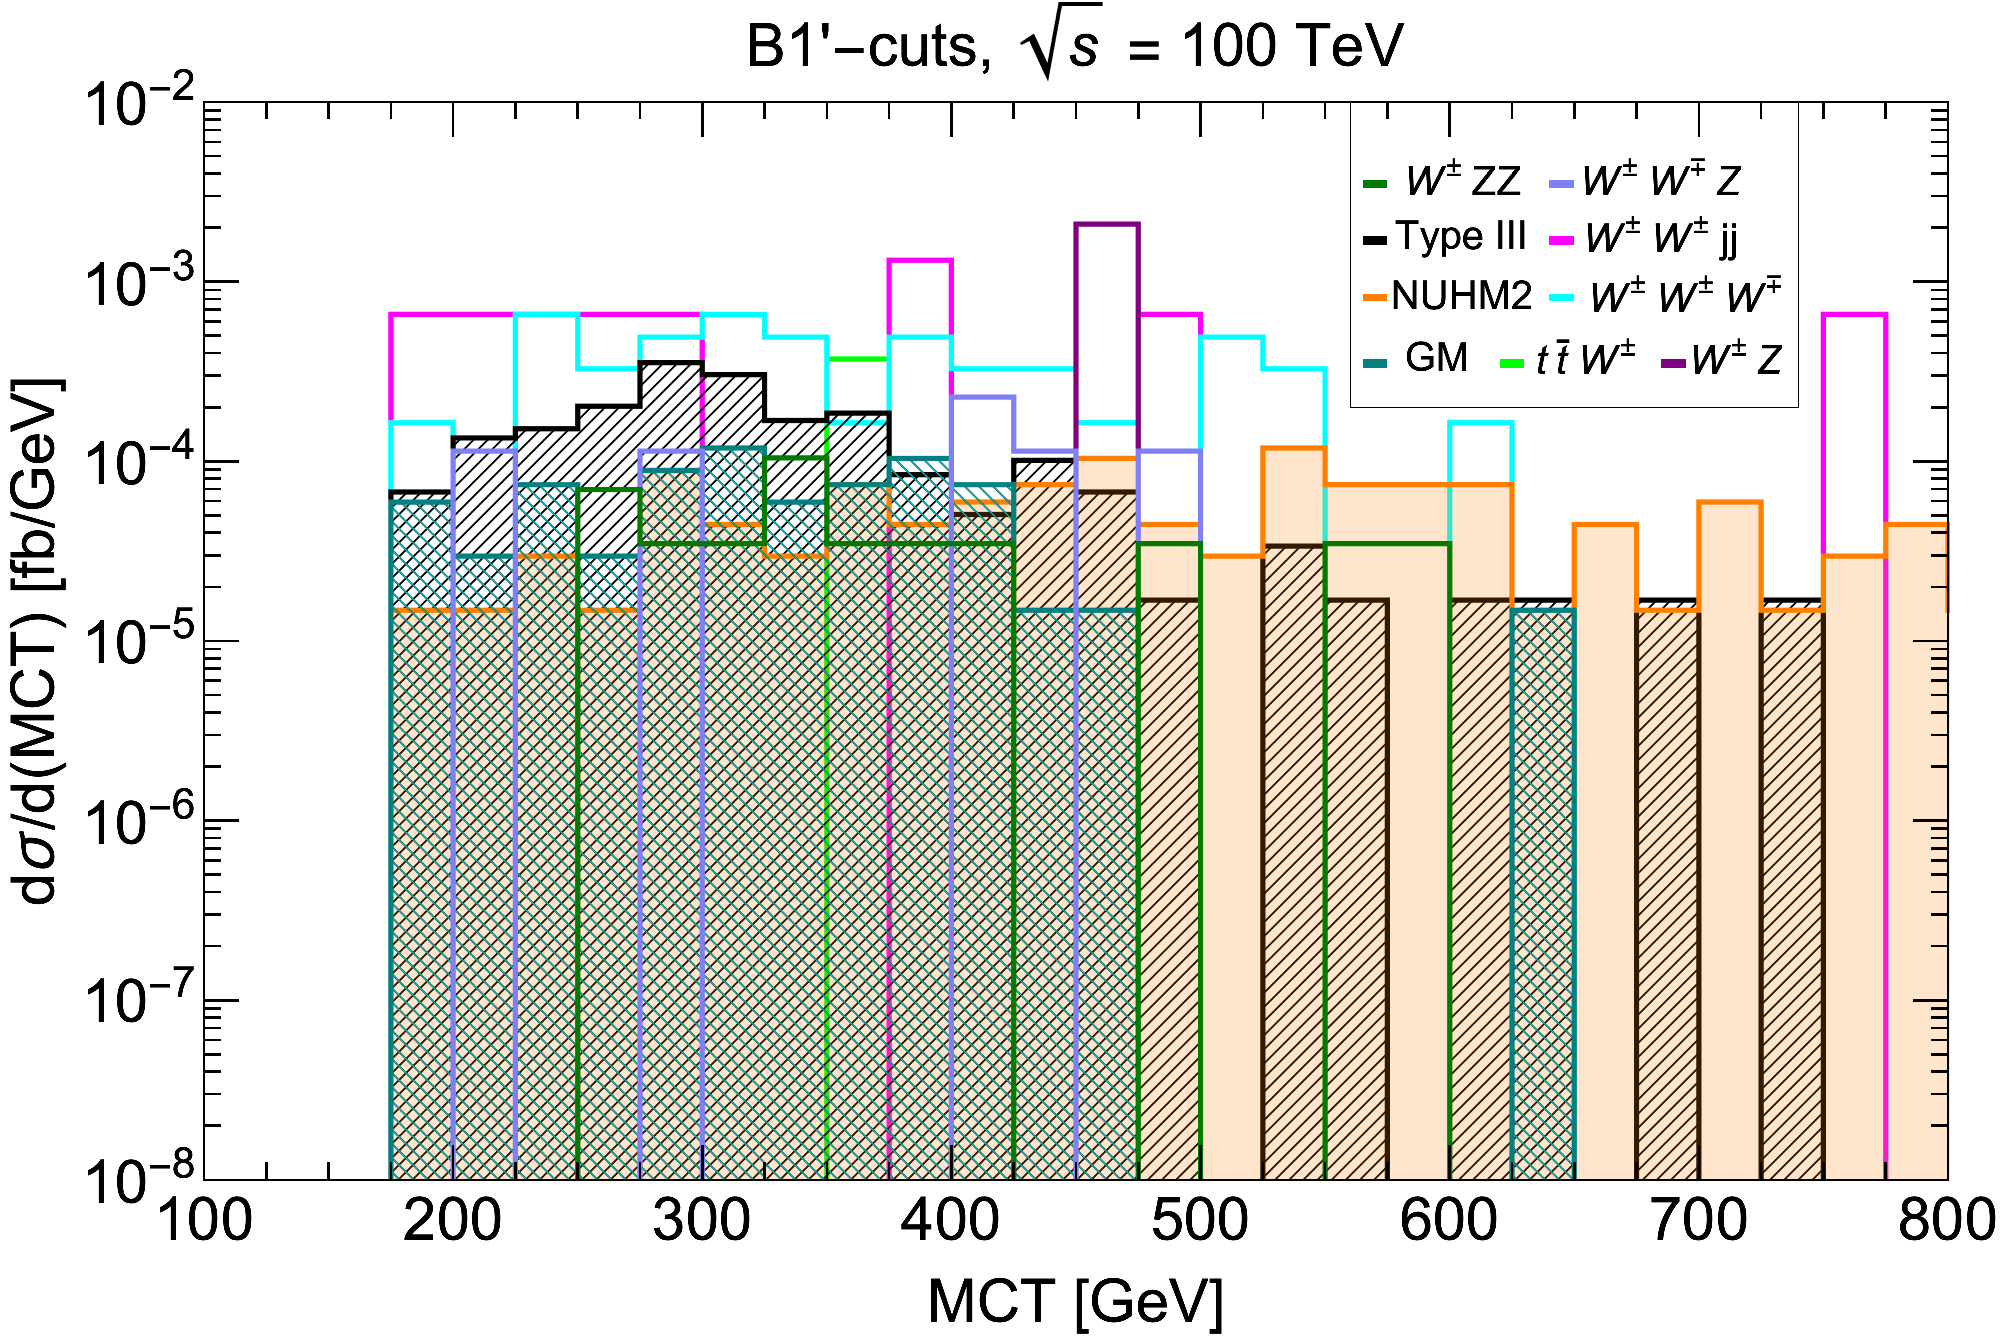
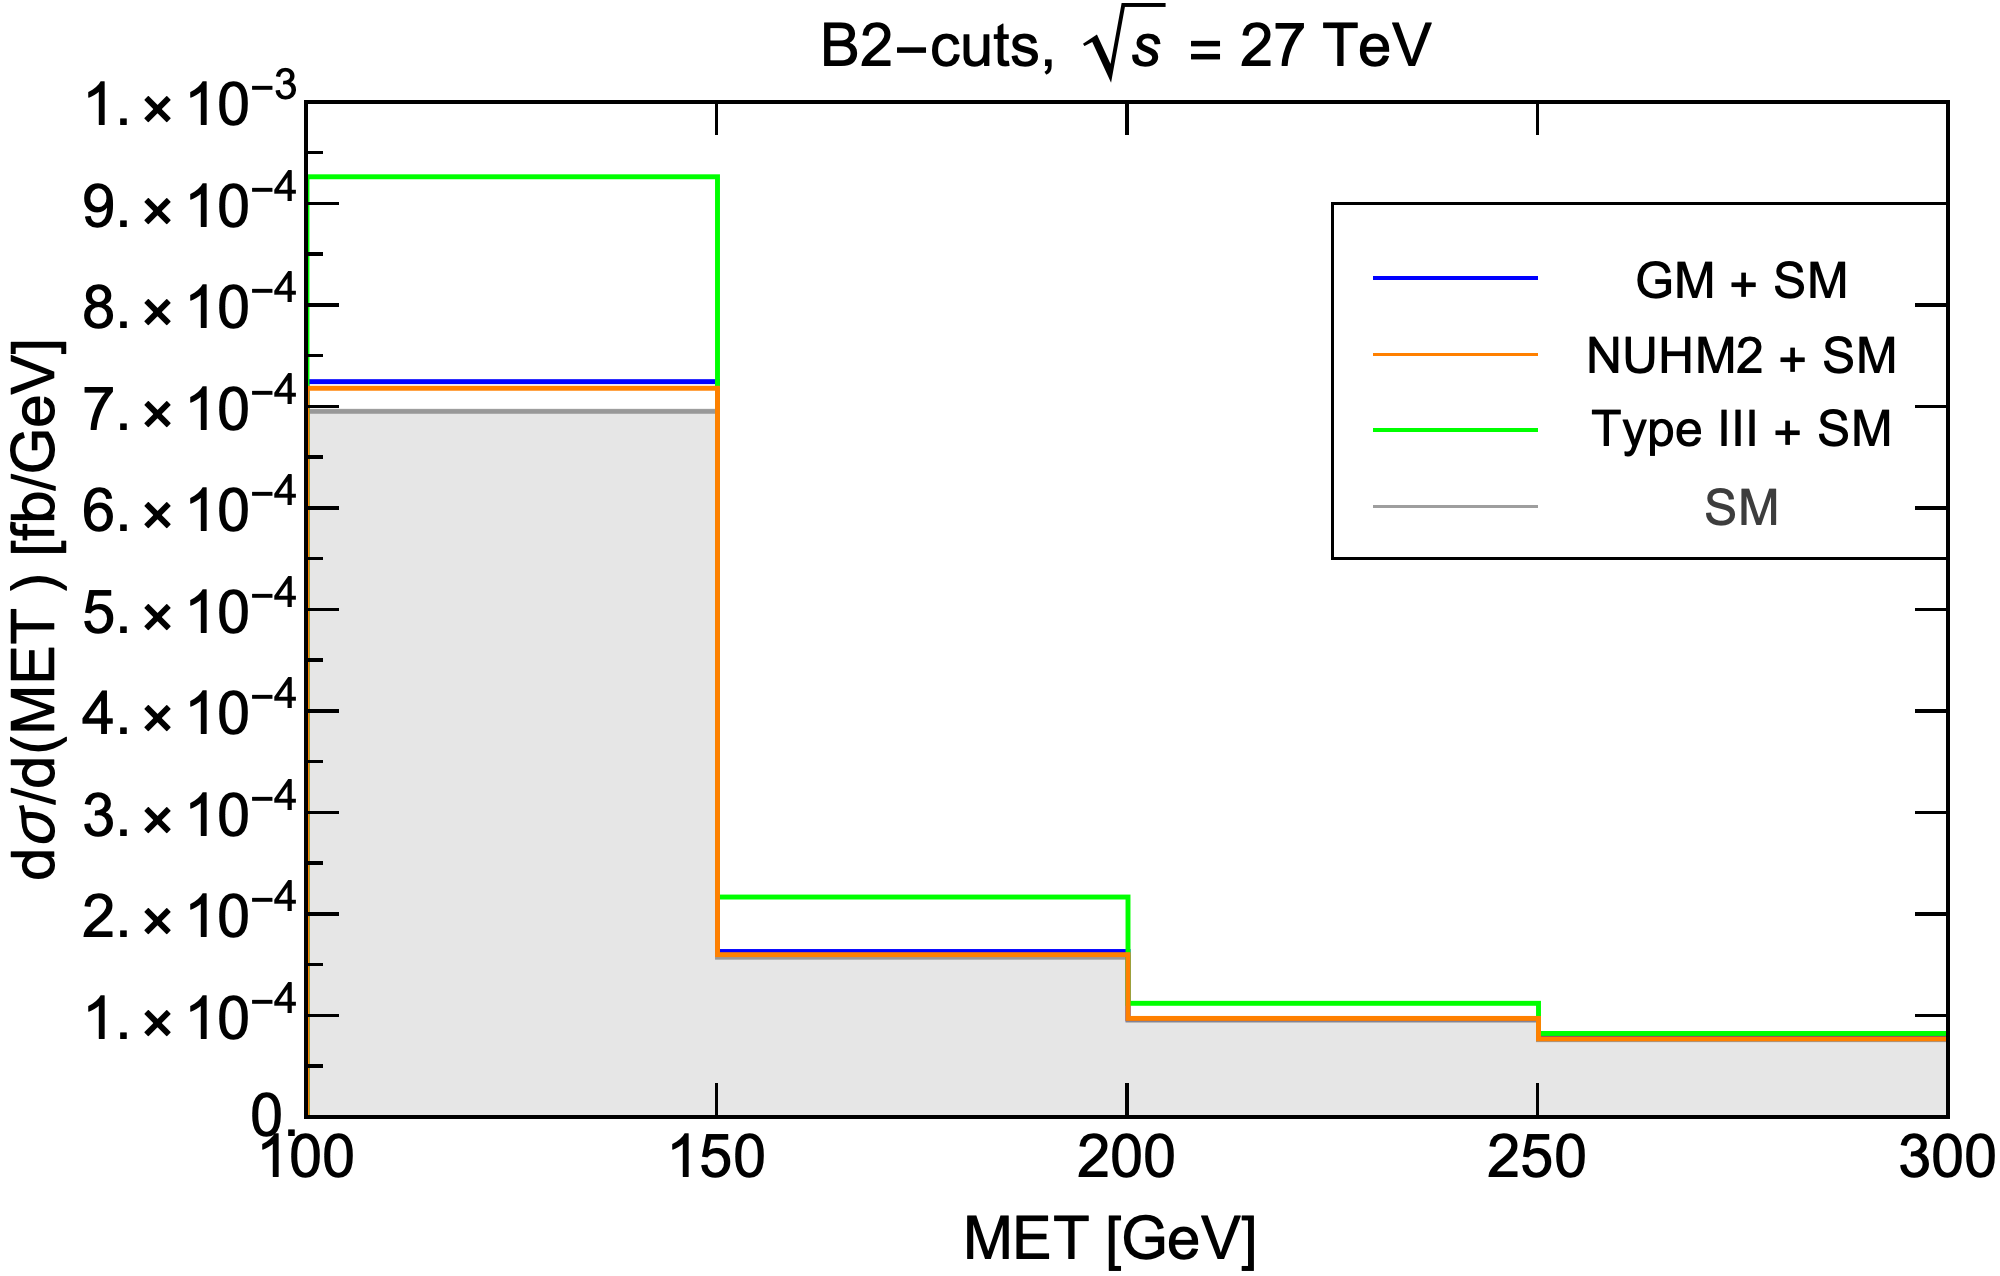
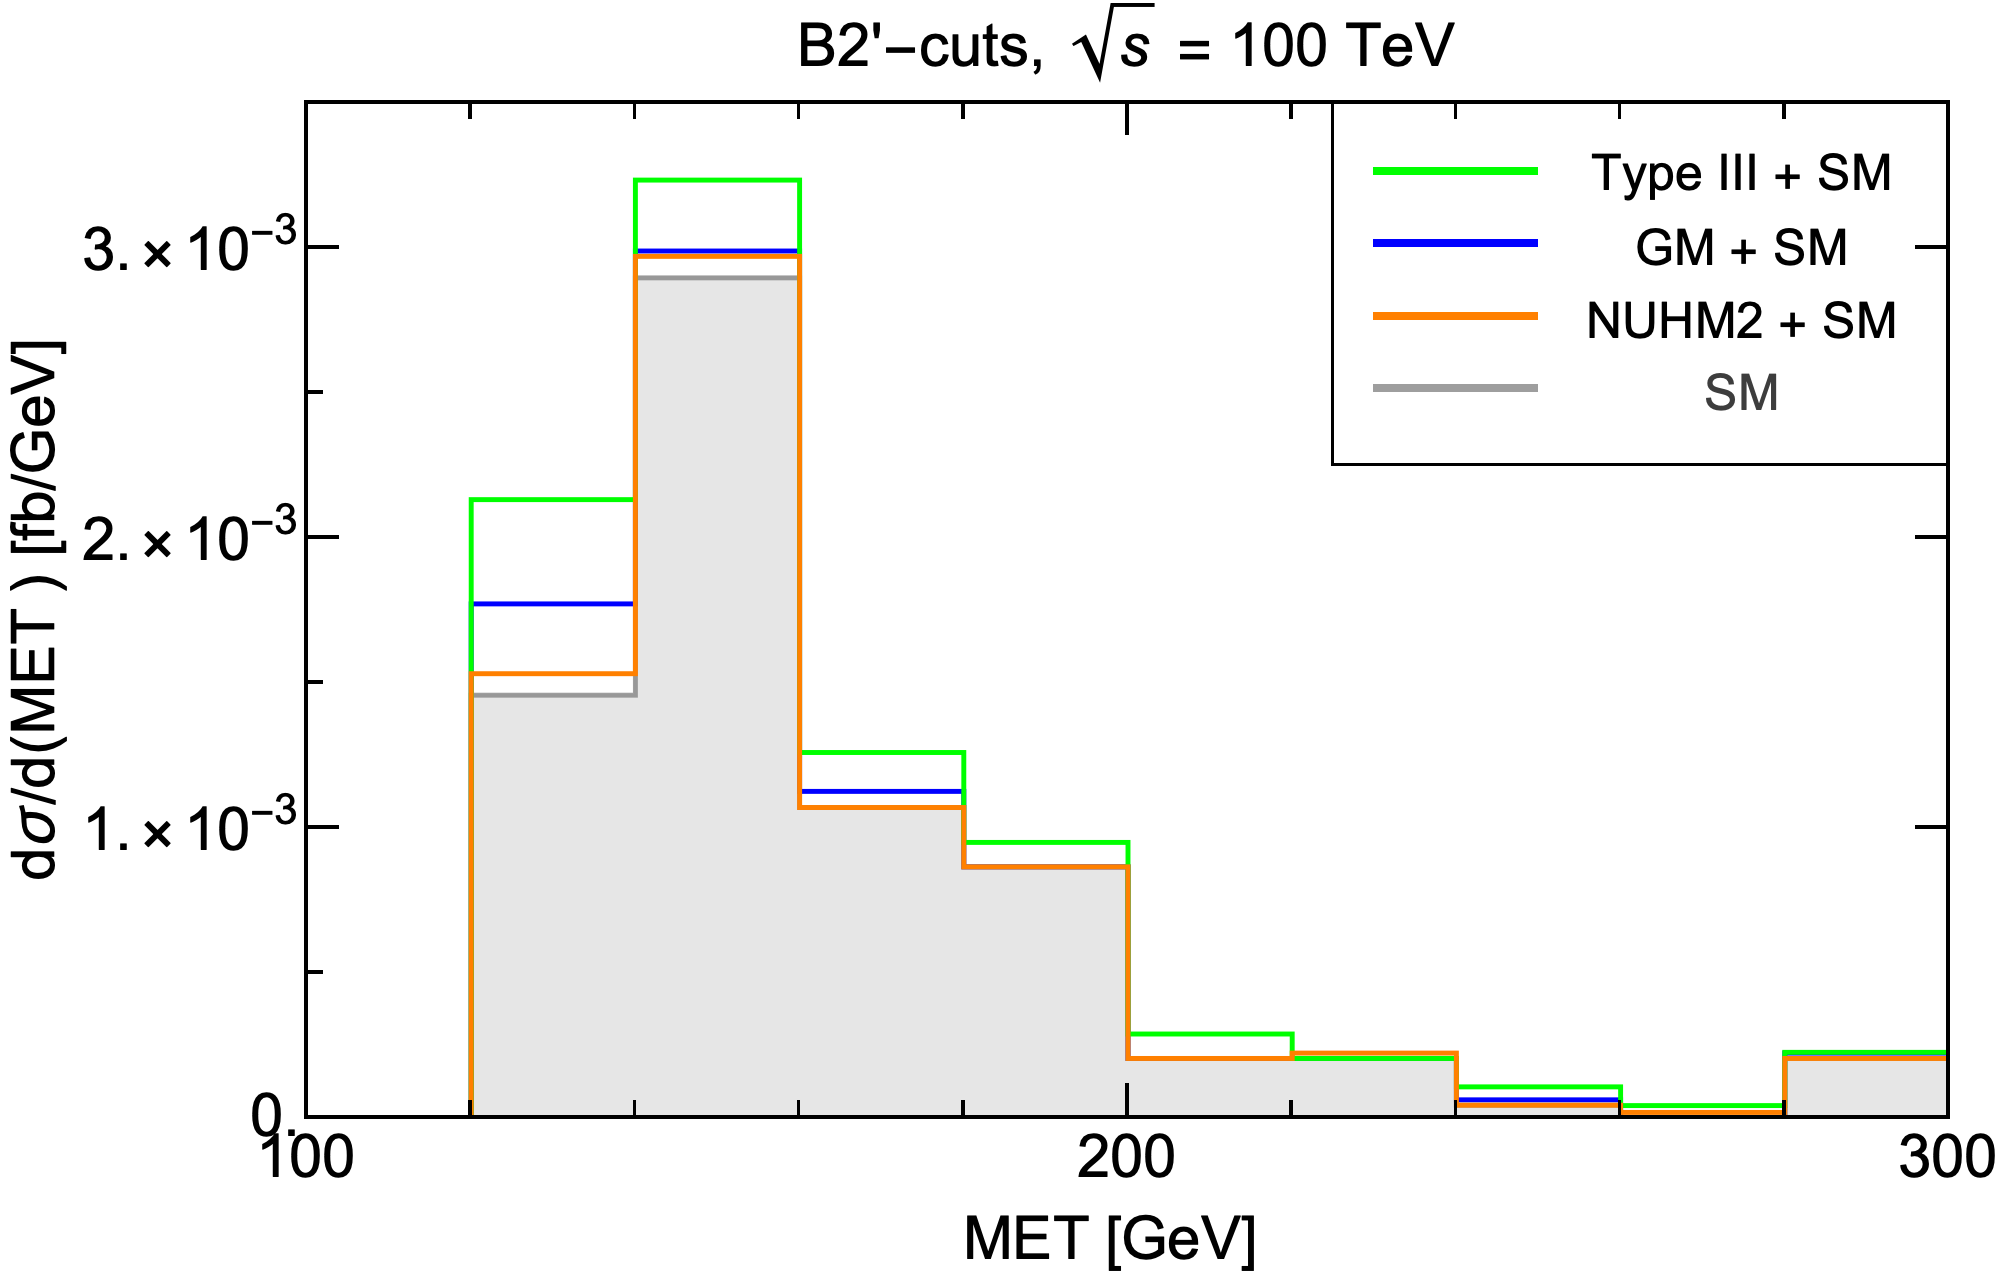
After the B1-cuts and B1′-cuts for TeV and TeV, respectively, the MCT distribution is plotted in Fig. 9(a) and in Fig. 9(b). From Fig. 9(a) we see that a cut of 200 GeV < MCT < 325 GeV can further reduce the SM background and NUHM2 signal as well while retaining enough type-III signals to be visible. Therefore, next we apply the B2-cuts defined as:
-
•
B1-cuts + 200 GeV < MCT < 325 GeV.
Similarly, for TeV, Fig. 9(b) shows that a suitable cut would be 200 GeV < MCT < 350 GeV. Therefore, next we apply the B2′-cuts defined as:
-
•
B1′-cuts + 200 GeV < MCT < 350 GeV.
The cut flow for this scenario is summarized in Table V.
| TeV | ||||||
| Process | K-factor | (NLO) [ab] | B1 [ab] | B2 [ab] | Significance | |
| 3 ab-1 | 15 ab-1 | |||||
| NUHM2 | 1.17 | 13.2 | 2.2 | () | () | |
| type-III | 1.16 | 22.8 | 16.6 | () | () | |
| GM | 1.26 | 2.6 | 1.9 | () | () | |
| 1.72 | 0 | 0 | - | - | ||
| 1.27 | 0 | 0 | - | - | ||
| 1.24 | 12.1 | 1.5 | - | - | ||
| 1.39 | 4.4 | 4.4 | - | - | ||
| 1.04 | 25.3 | 10.1 | - | - | ||
| 2.45 | 76.0 | 26.4 | - | - | ||
| 1.88 | 0 | 0 | - | - | ||
| 1.7 | 41 | 0 | - | - | ||
| 2.0 | 10.9 | 5.2 | - | - | ||
| 2.0 | 9.8 | 4 | - | - | ||
| Total BG | 179.5 | 51.6 | - | - | ||
| TeV | ||||||
| Process | K-factor | (NLO) [ab] | B1′ [ab] | B2′ [ab] | Significance | |
| 3 ab-1 | 15 ab-1 | |||||
| NUHM2 | 1.17 | 36.3 | 5.6 | () | () | |
| type-III | 1.16 | 50.2 | 33 | () | () | |
| GM | 1.26 | 18.9 | 10 | () | () | |
| 1.72 | 0 | 0 | - | - | ||
| 1.27 | 0 | 0 | - | - | ||
| 1.24 | 9.3 | 0 | - | - | ||
| 1.39 | 0 | 0 | - | - | ||
| 1.04 | 213.7 | 65.8 | - | - | ||
| 2.45 | 135.1 | 65.5 | - | - | ||
| 1.88 | 156.7 | 0 | - | - | ||
| 1.7 | 0 | 0 | - | - | ||
| 2.0 | 17.1 | 5.7 | - | - | ||
| 2.0 | 14.0 | 6.1 | - | - | ||
| Total BG | 545.9 | 143.1 | - | - | ||
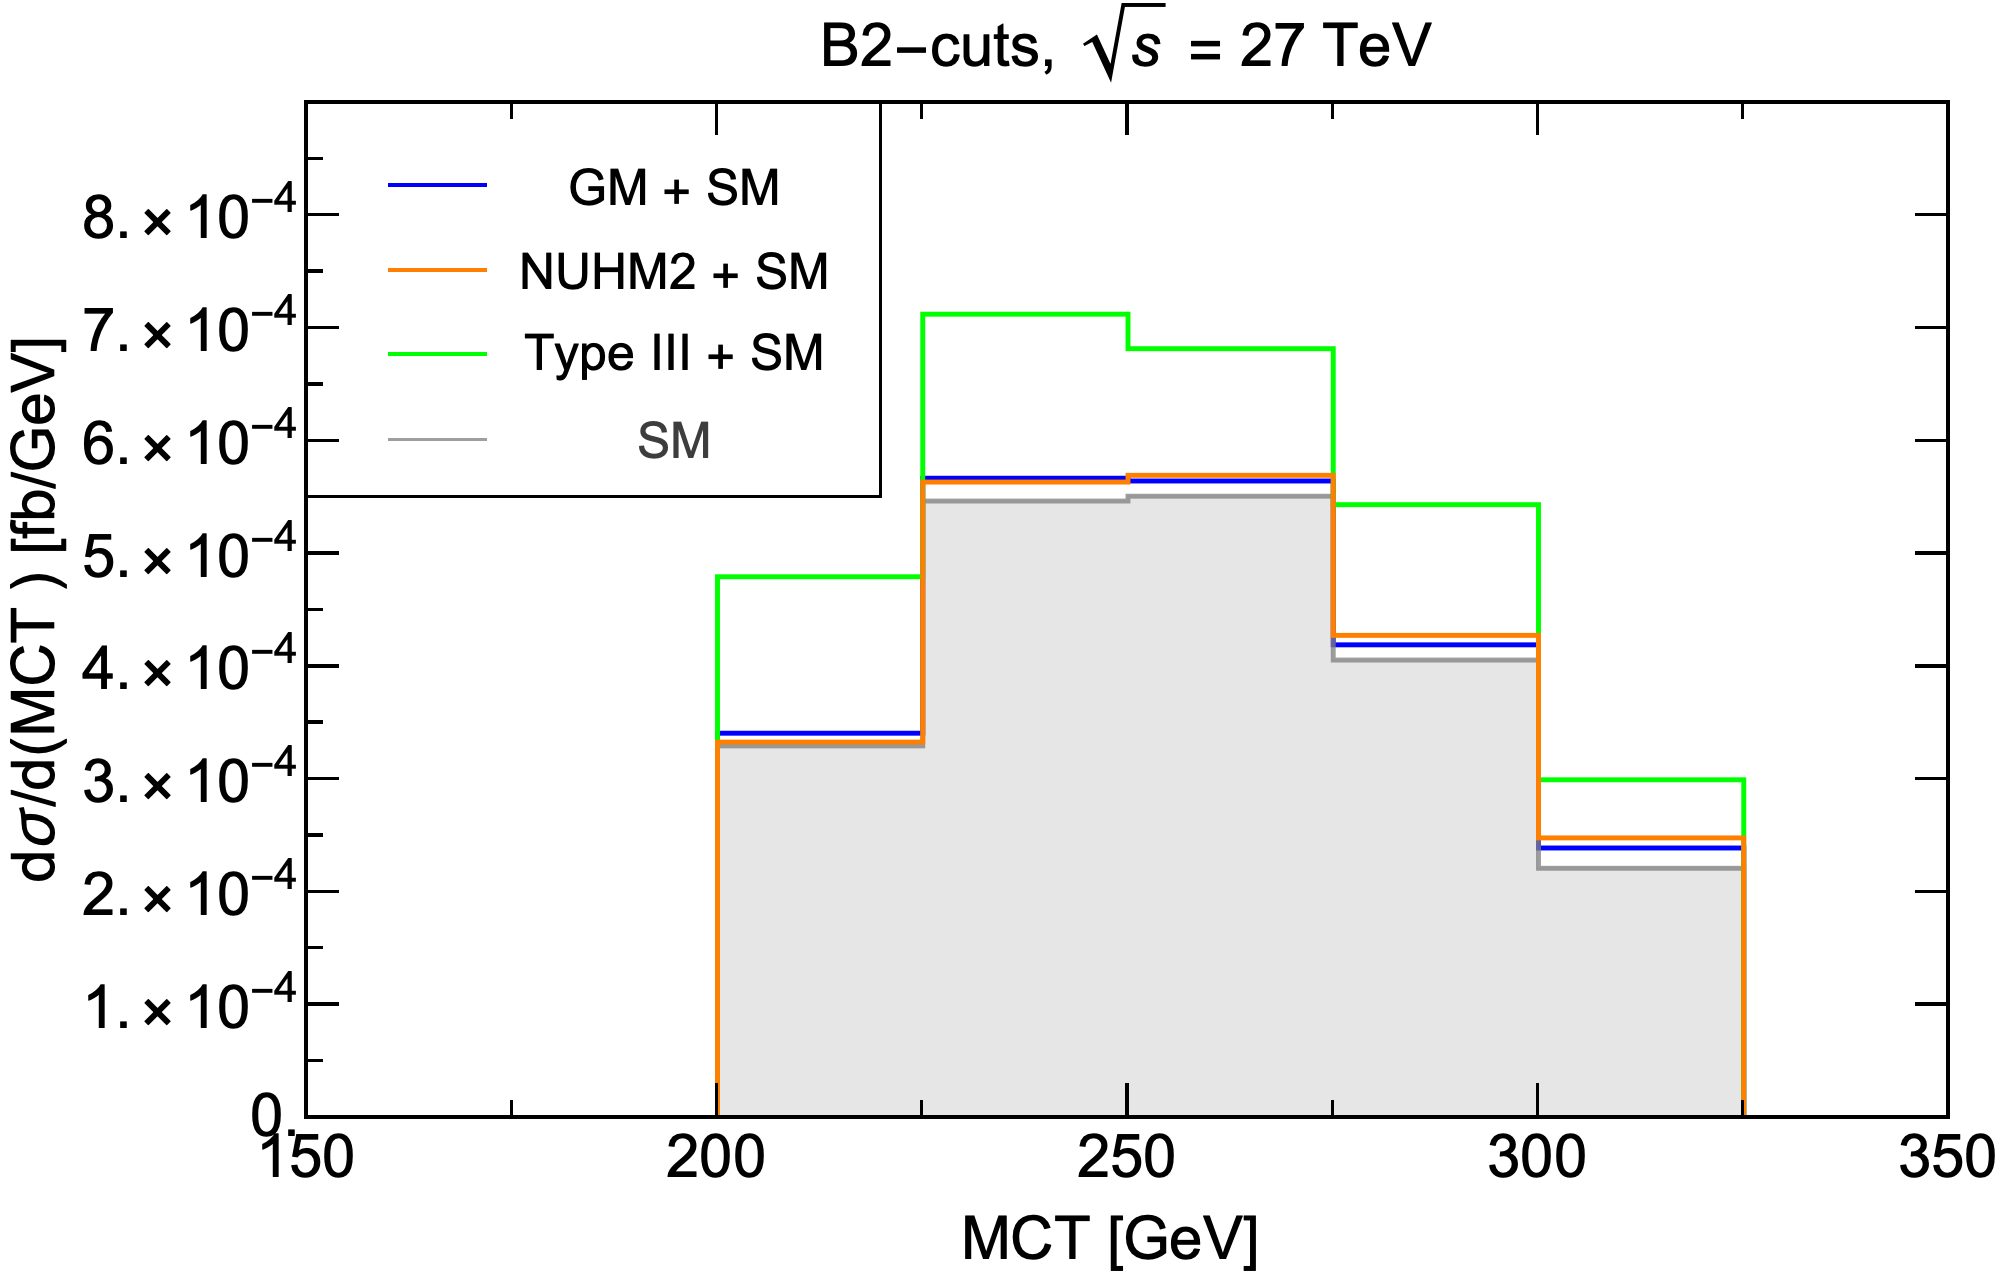
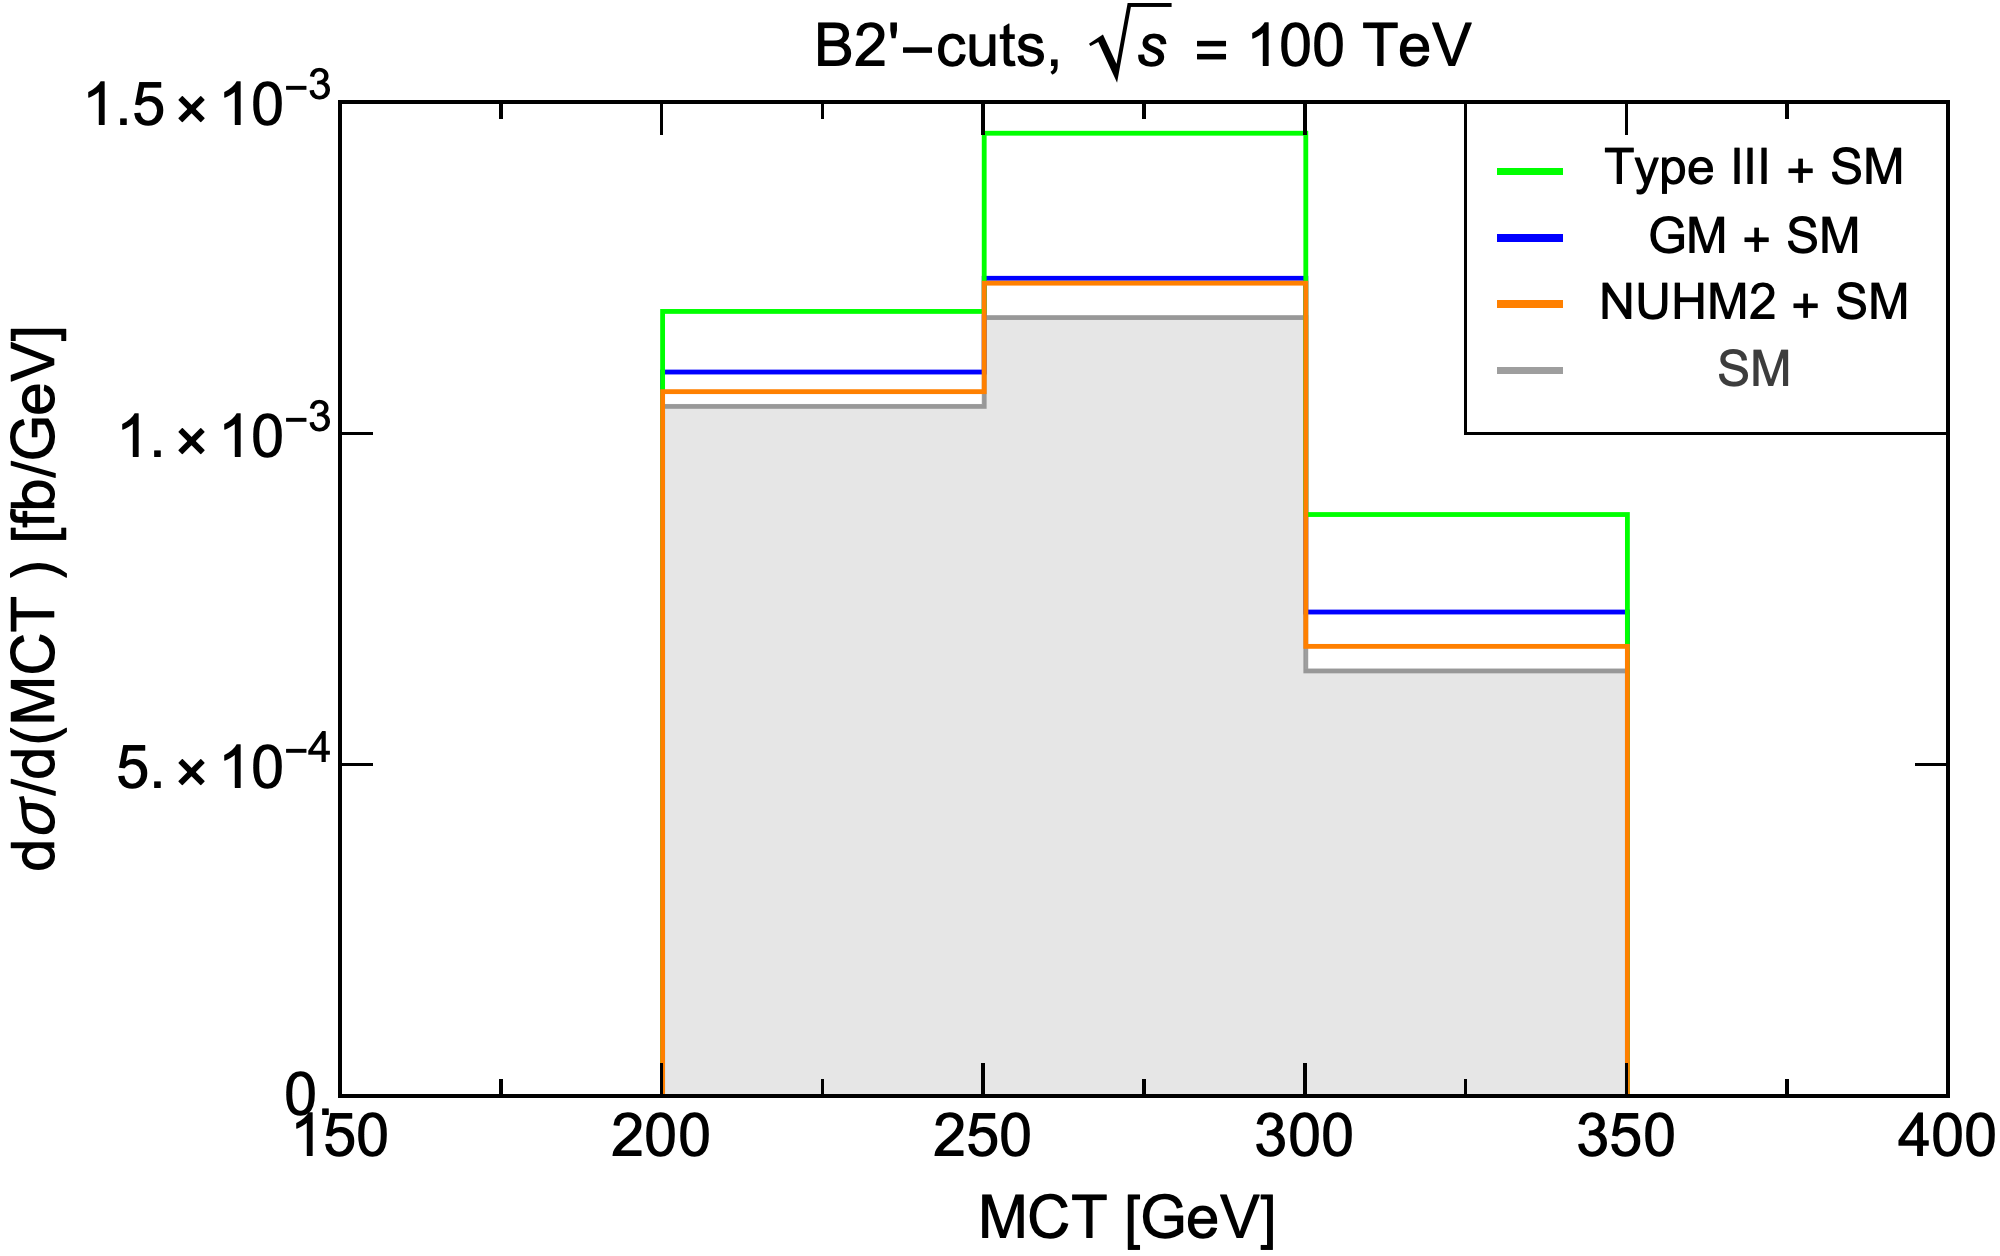
After the B2 and B2′-cuts at TeV and TeV, respectively, we list the significance for the type-III seesaw signal, the NUHM2 signal and the GM model signal for = 3 ab-1 and 15 ab-1. Besides, we also consider the impact of 3 systematic uncertainties and calculate the significance which we show in parenthesis in Table V. We see that on considering 3 systematic uncertainties the significance for each signal reduces, for example, at TeV and for = 15 ab-1, the type-III seesaw signal BM point yields a significance of 7.8 which reduces to 6.3 on considering 3 systematic uncertainties. The table shows that the type-III seesaw signal yields a significance higher than 5 at both energies for = 15 ab-1 while the other two BSM scenarios don’t. We have plotted the MCT distribution and the distribution for the total SM background and various signals on top of it, after imposing the B2 and B2′-cuts at the respective energies in Fig. 10.
3.3 Type-II Seesaw/Georgi-Machacek Model Analysis
In the GM model, since the SSdL and originate from of mass 300 GeV, the MCT distribution should peak and then sharply fall around 300 GeV. Therefore, an efficient cut after S1-cuts to scoop out the GM model signal would be to require the MCT to be 300 GeV.
Since we explicitly have two forward jets in the GM model signal, hence requiring the number of jets 2 would be a suitable cut to retain most of the GM model signal. Hence after S1- cuts, we apply two additional cuts, namely, MCT GeV and njet 2 and this entire set of cut is called the C1-cuts:
-
•
S1-cuts + MCT GeV + njet 2.
After applying the C1-cuts, we plot the distribution of the pseudorapidity () difference between the two leading jets, , in Fig. 11(a) and 11(b) at TeV and TeV, respectively. Due to the presence of two explicit forward jets in the GM model signal, we expect should peak towards higher values and it indeed peaks around 5 in Fig. 11. One naively expects that the process in the SM should also peak towards higher value of . The reason that Fig. 11 does not feature this is the following. The process includes two types of processes: (a) those of , and (b) those of , both at the amplitude level. The processes of type (a) do peak towards higher value of after certain cuts as depicted in Ref. [113]. But here we have included both types of diagrams and our choice of cuts are very different from those used in Ref. [113]. Hence, the peak due to type (a) processes is overshadowed once type (b) processes are included and becomes less prominent.
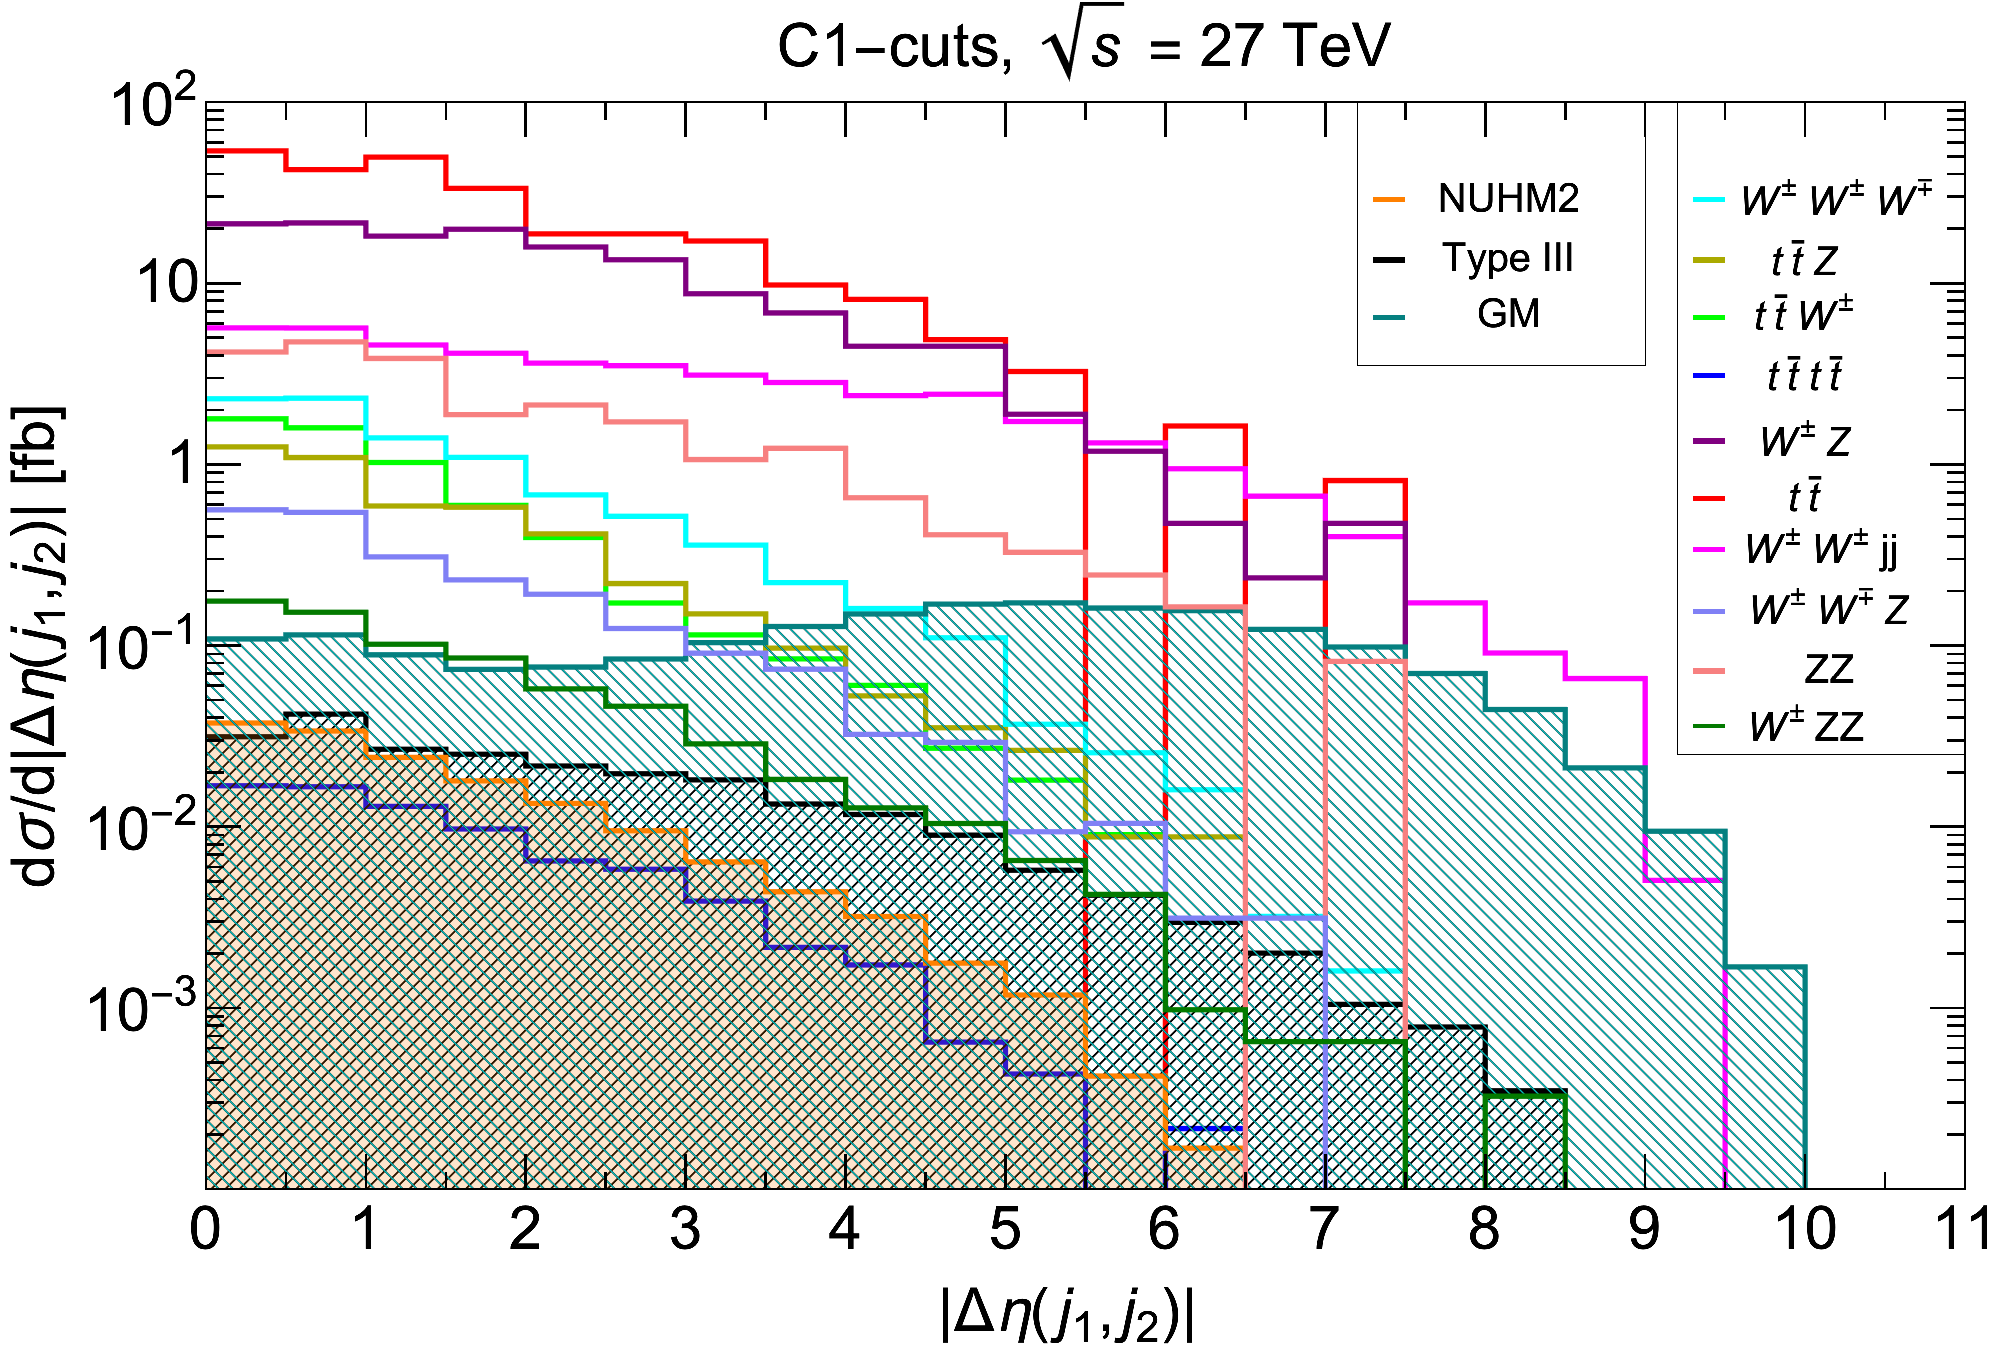
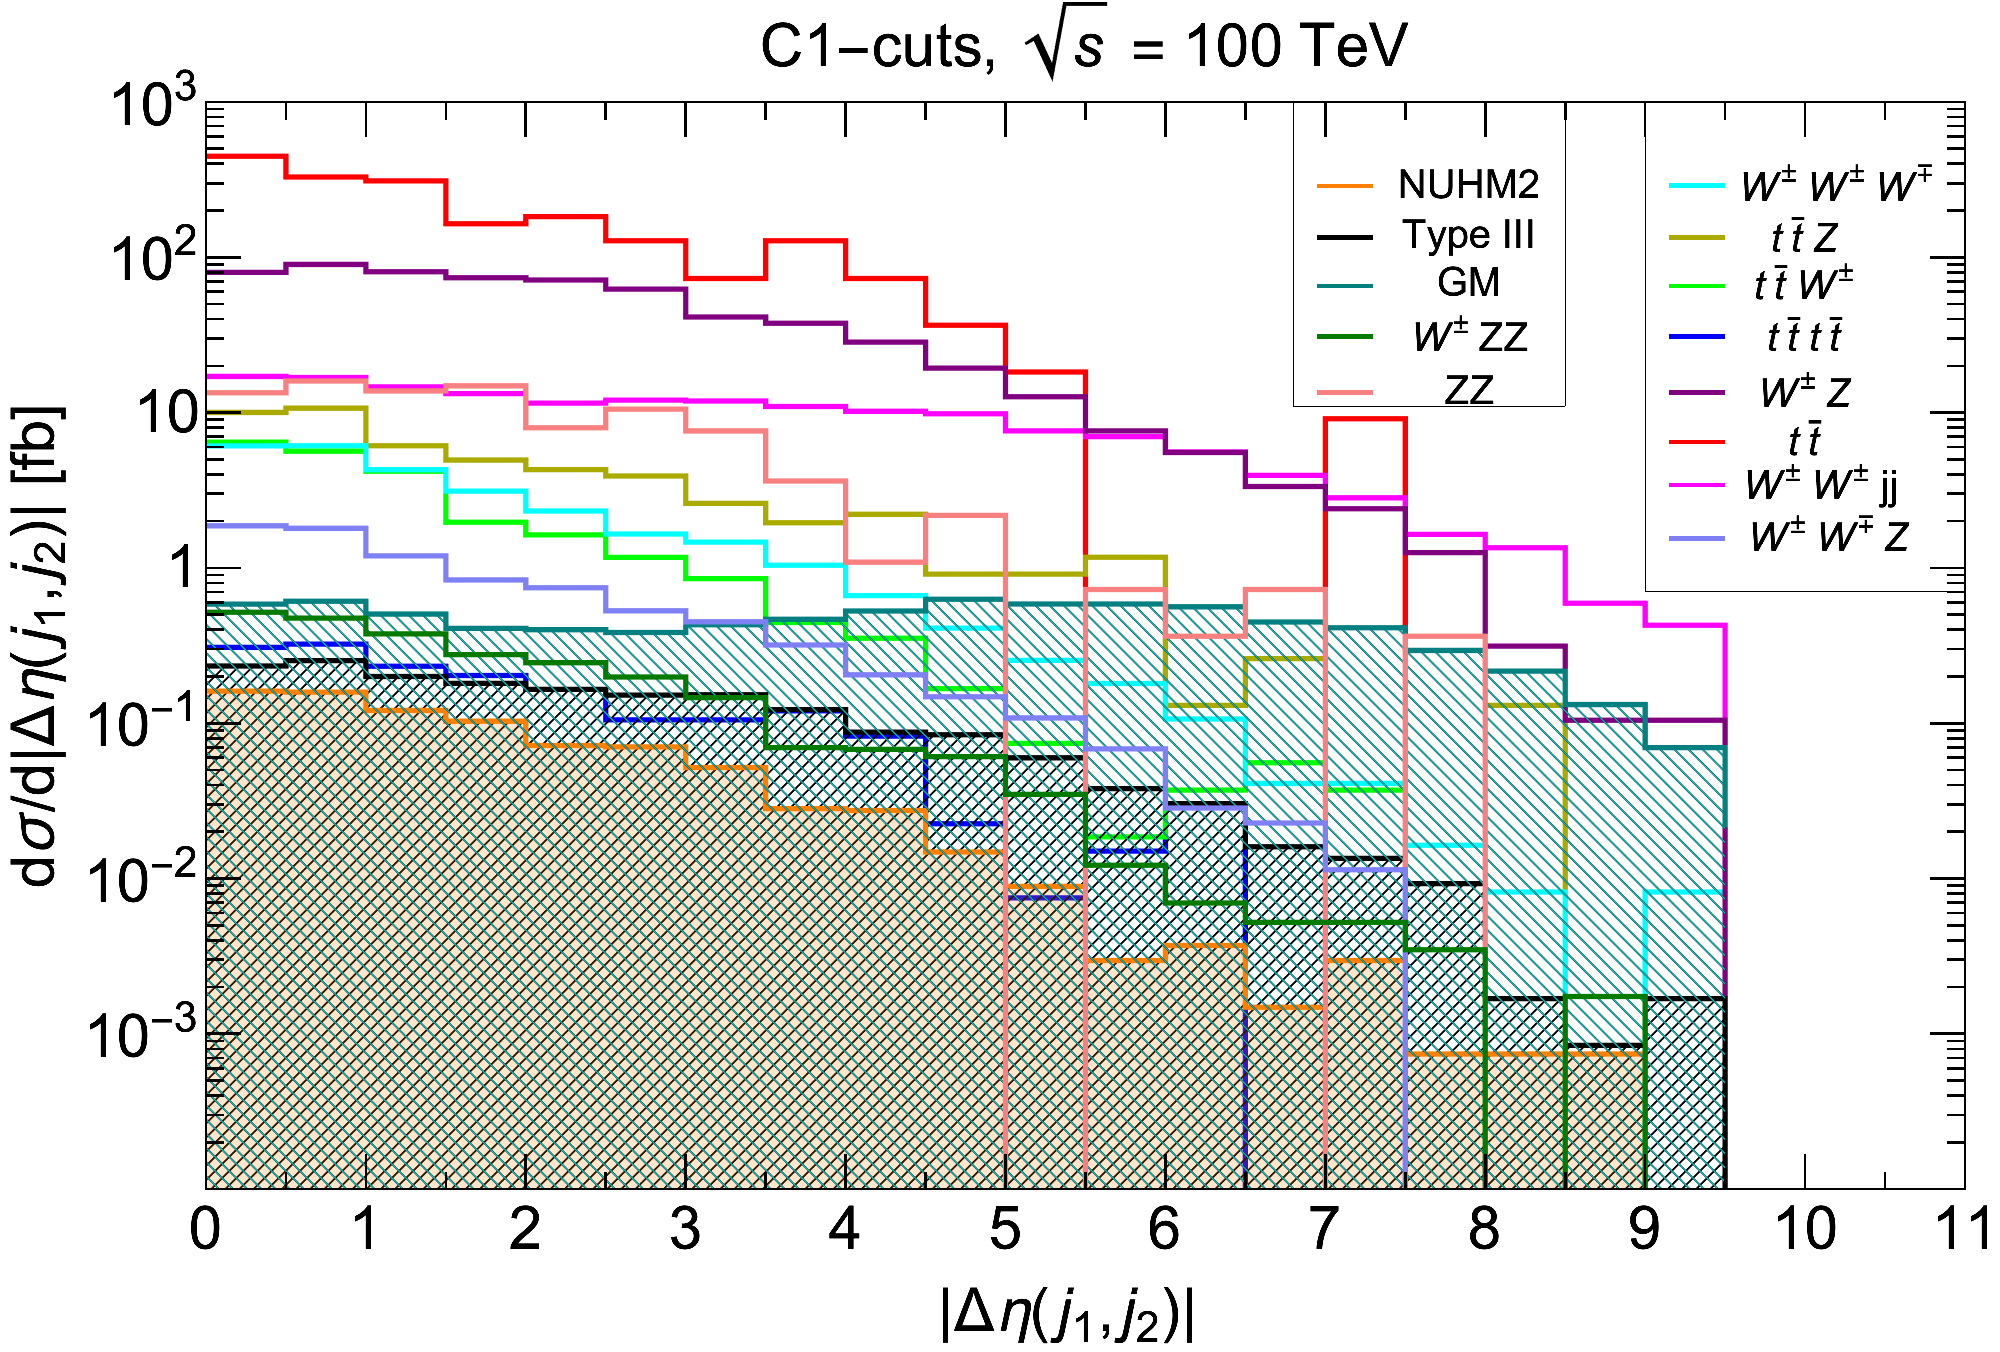
Therefore, requiring is an extremely efficient cut to not only reduce the SM background but also to almost eliminate the signals from the other two BSM models. We now call this full set of cuts to be the C2-cuts:
-
•
C1-cuts + .
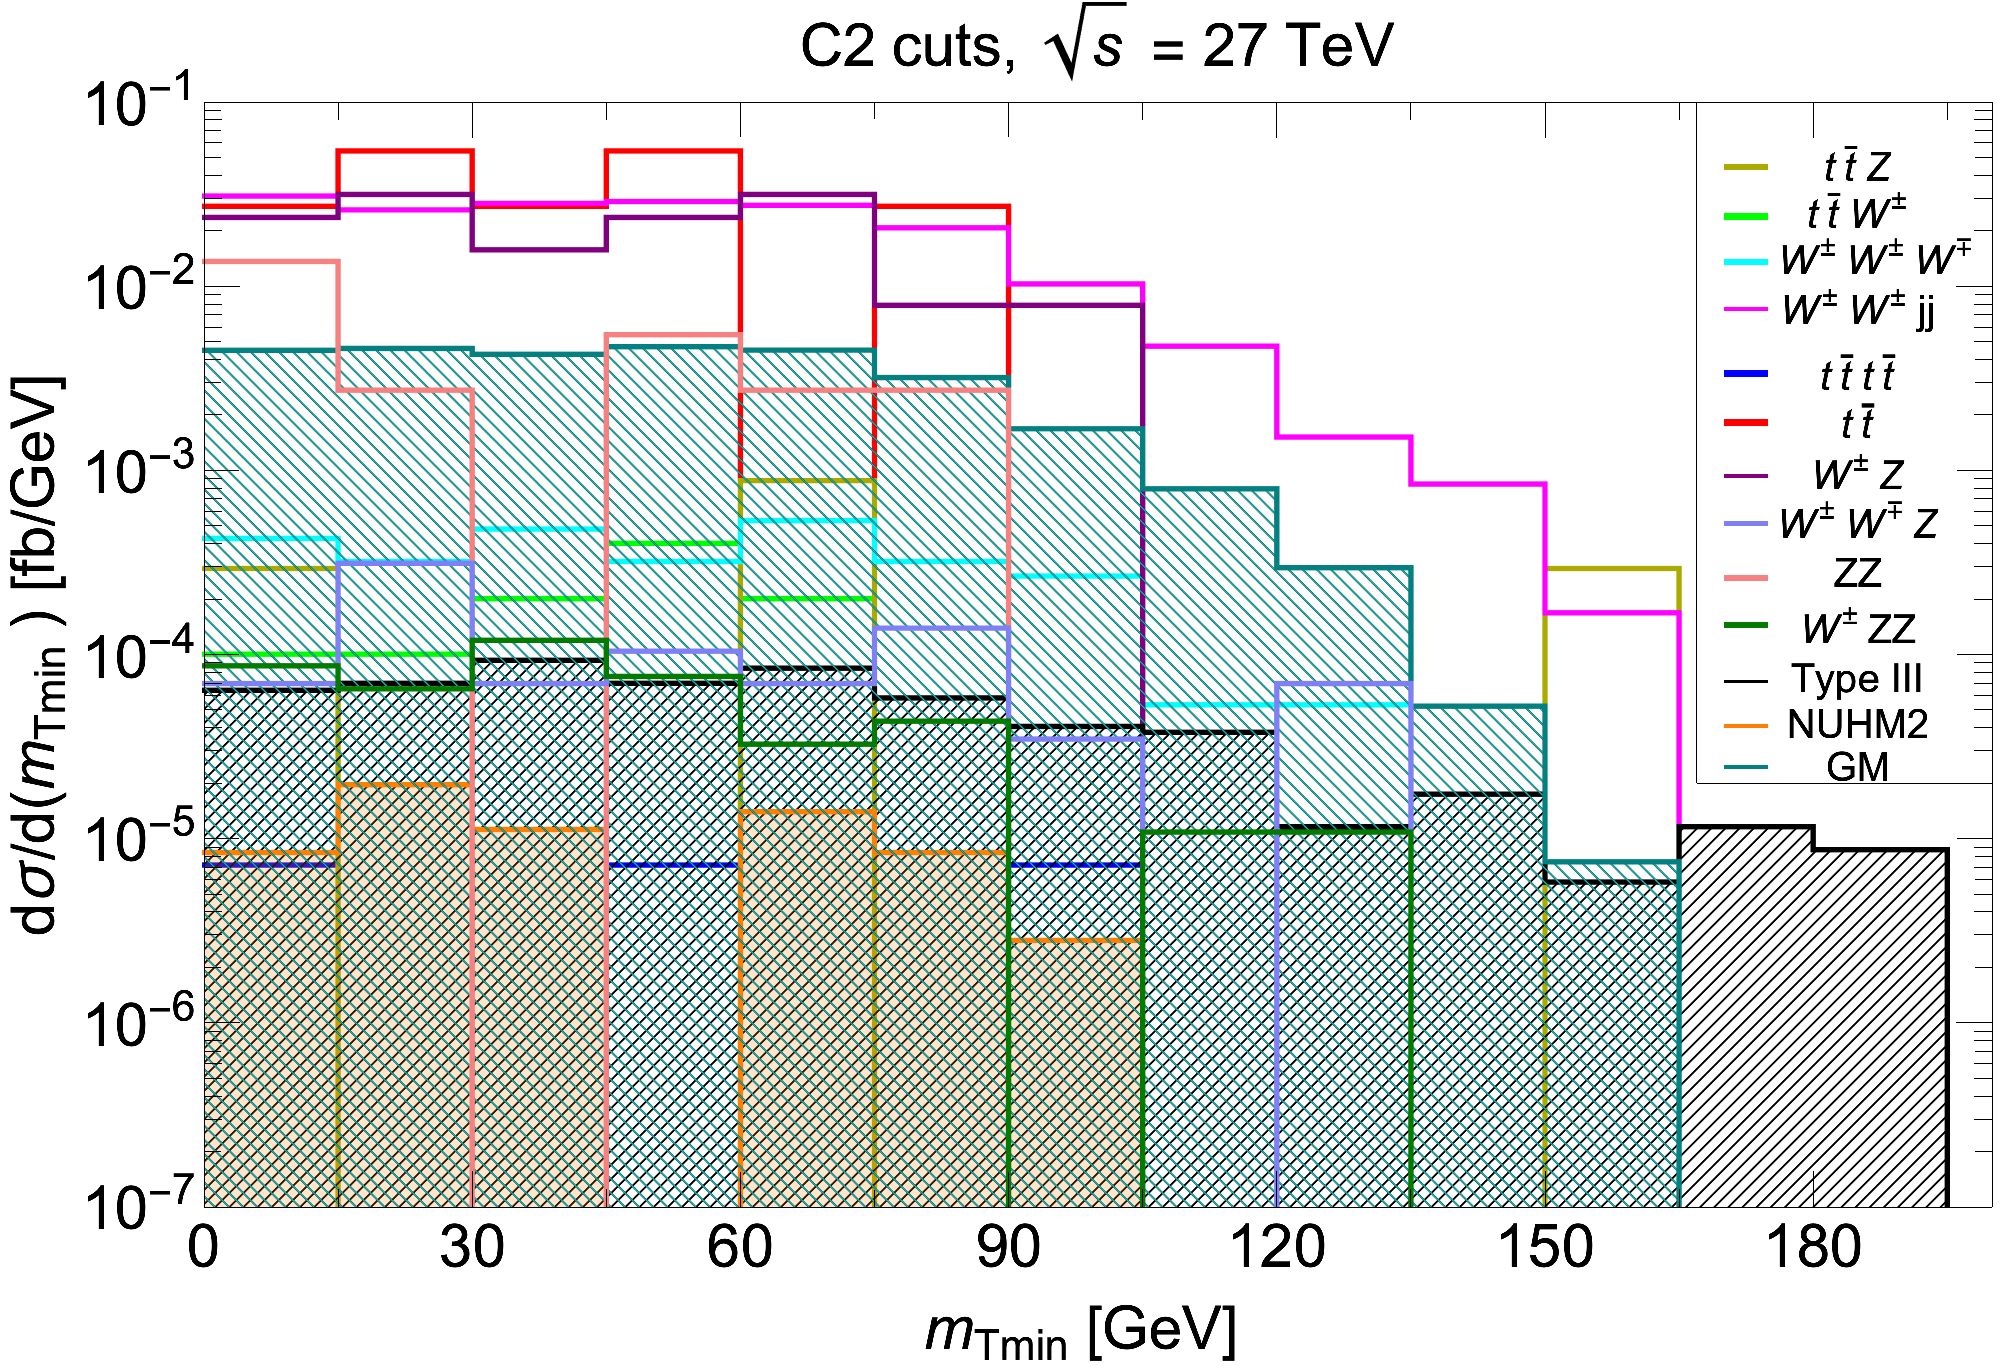
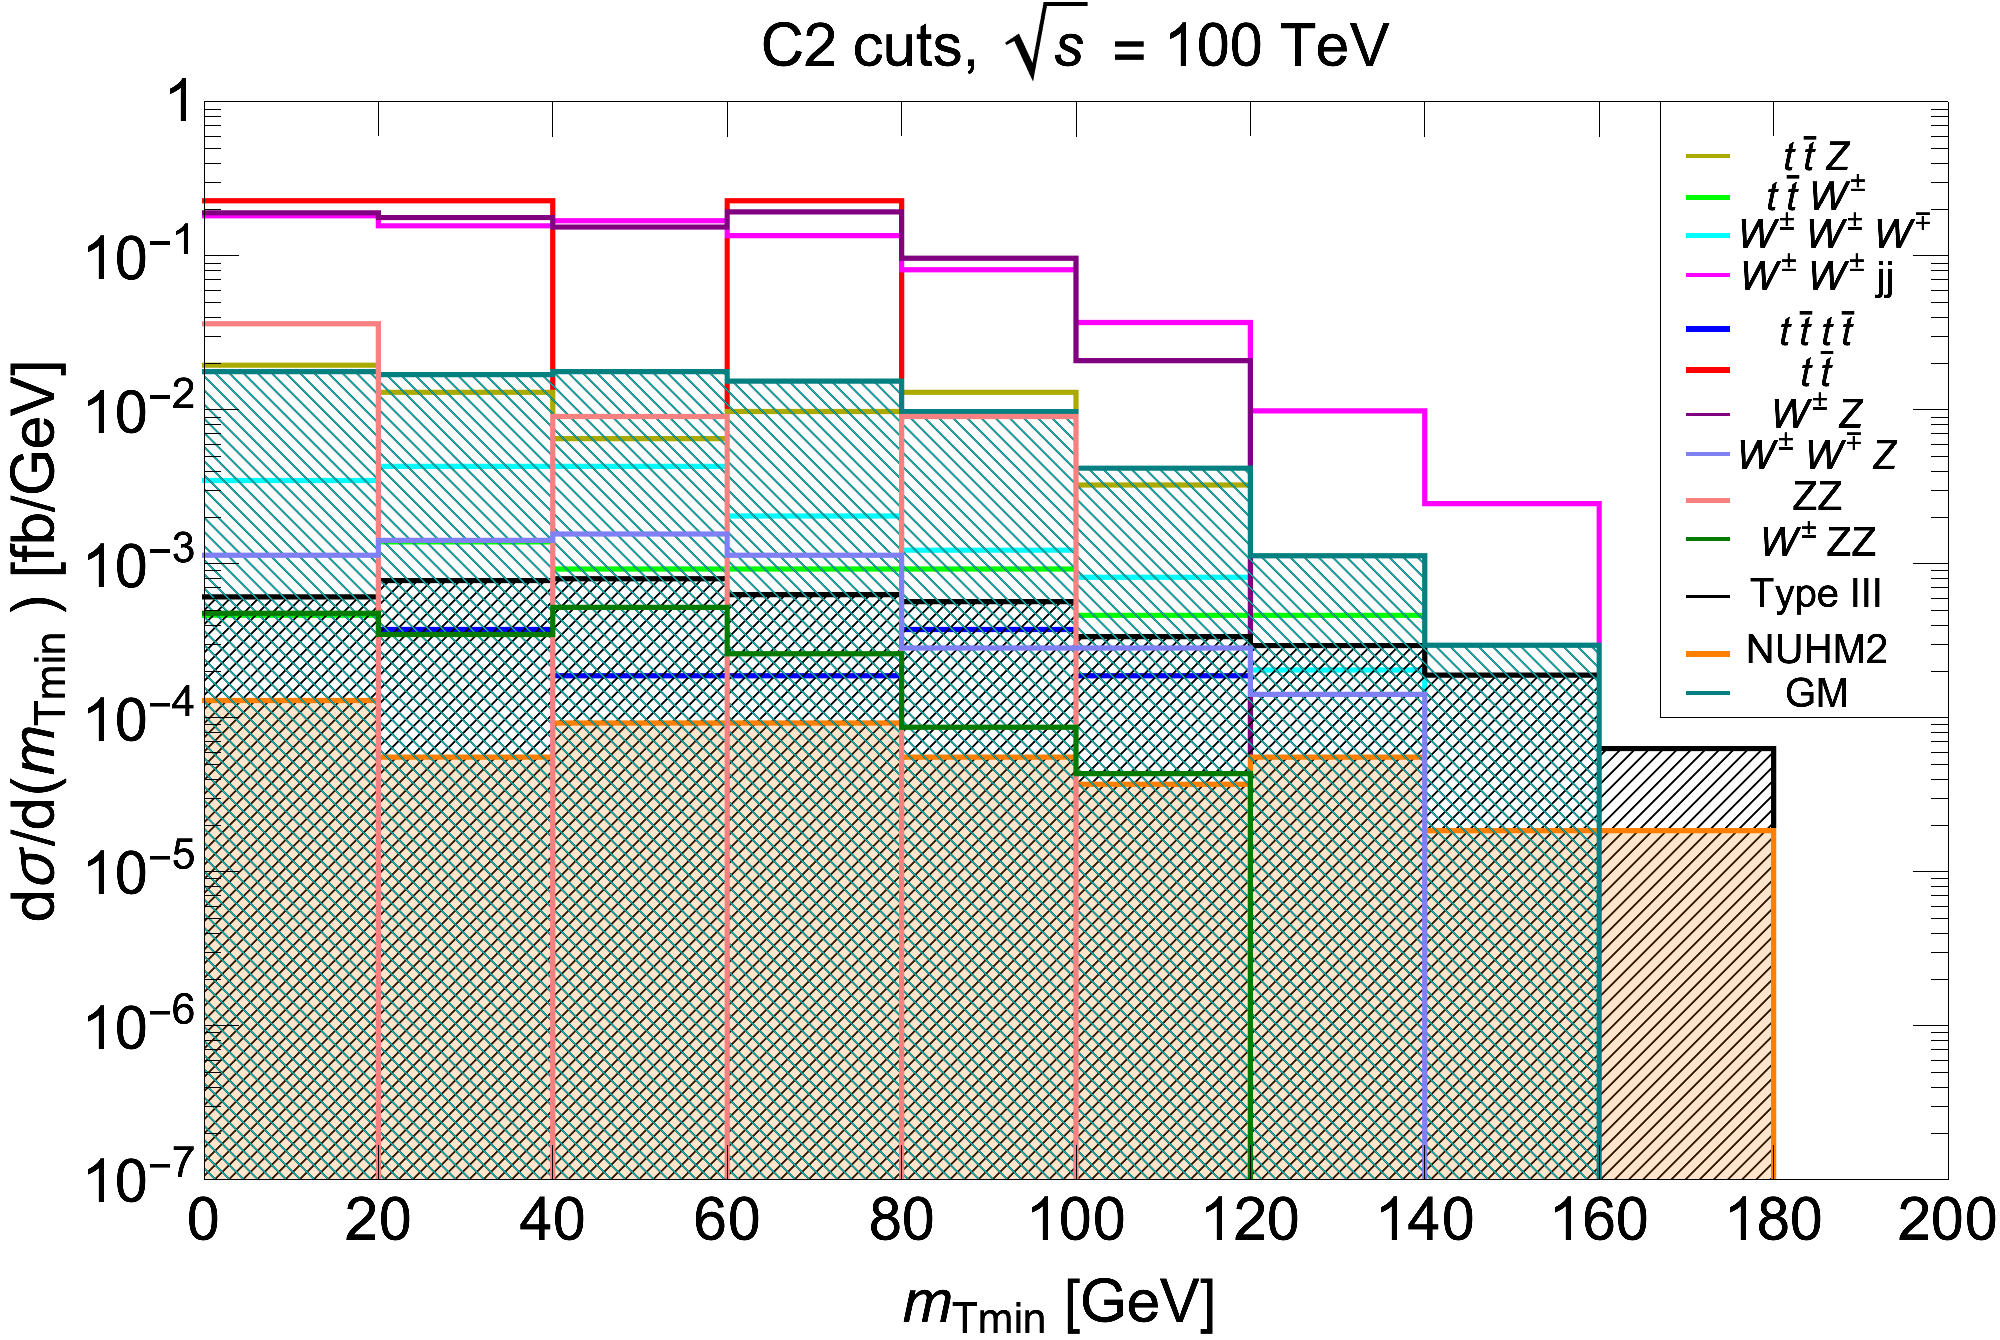
As can be inferred from Fig. 12(a), a further cut of GeV will make the largest SM backgrounds and vanish. We also impose a small cut of GeV just to ensure we pick up those events with some non-zero in the final state since we are looking for SSdB + signature. We therefore propose the C3-cuts:
-
•
C2-cuts + > 105 GeV + > 50 GeV.
Similarly, Fig. 12(b) shows that a further cut of GeV would be needed to make and backgrounds vanish. We therefore propose the C3′-cuts:
-
•
C2-cuts + > 120 GeV + > 50 GeV.
The cut flow for this scenario is summarized in Table VI.
After the final sets of cuts, namely the C3 and C3′-cuts for 27 and 100 TeV, respectively, we calculate and list the significance for the GM model signal, the type-III seesaw signal, and the NUHM2 signal for = 3 ab-1 and 15 ab-1. Additionally, we also show the impact of 3 systematic uncertainties on the significance of the signal in parenthesis in Table VI.
| TeV | |||||||
| Process | K-factor | (NLO) [ab] | C1 [ab] | C2 [ab] | C3 [ab] | Significance | |
| 3 ab-1 | 15 ab-1 | ||||||
| NUHM2 | 1.17 | 77.0 | 0.97 | 0 | 0 | 0 | |
| type-III | 1.16 | 117.86 | 8.6 | 1.4 | () | () | |
| GM | 1.26 | 976.52 | 428.4 | 16.35 | () | () | |
| 1.72 | 131044.0 | 2850.0 | 0 | - | - | ||
| 1.27 | 40.0 | 0.32 | 0 | - | - | ||
| 1.24 | 2938.5 | 15.1 | 0 | - | - | ||
| 1.39 | 2260.2 | 22.0 | 4.4 | - | - | ||
| 1.04 | 21638.0 | 2693.0 | 108.7 | - | - | ||
| 2.45 | 4622.6 | 41.61 | 1.6 | - | - | ||
| 1.88 | 69464.0 | 2126.4 | 0 | - | - | ||
| 1.7 | 408.8 | 0 | - | - | |||
| 2.0 | 13.04 | 1.0 | - | - | |||
| 2.0 | 351.5 | 6.7 | 0.3 | - | - | ||
| Total BG | 116.0 | - | - | ||||
| TeV | |||||||
| Process | K-factor | (NLO) [ab] | C1 [ab] | C2 [ab] | C3′ [ab] | Significance | |
| 3 ab-1 | 15 ab-1 | ||||||
| NUHM2 | 1.17 | 415.13 | 11.1 | 1.9 | () | () | |
| type-III | 1.16 | 900.8 | 85.6 | 11.0 | () | () | |
| GM | 1.26 | 4135.6 | 1663.6 | 28.0 | () | () | |
| 1.72 | 0 | - | - | ||||
| 1.27 | 860 | 26.3 | 0 | - | - | ||
| 1.24 | 111.3 | 9.3 | - | - | |||
| 1.39 | 0 | - | - | ||||
| 1.04 | 214.0 | - | - | ||||
| 2.45 | 327.5 | 4.1 | - | - | |||
| 1.88 | 0 | - | - | ||||
| 1.7 | 0 | - | - | ||||
| 2.0 | 119.5 | 2.8 | - | - | |||
| 2.0 | 34.8 | 0 | - | - | |||
| Total BG | 230.2 | - | - | ||||
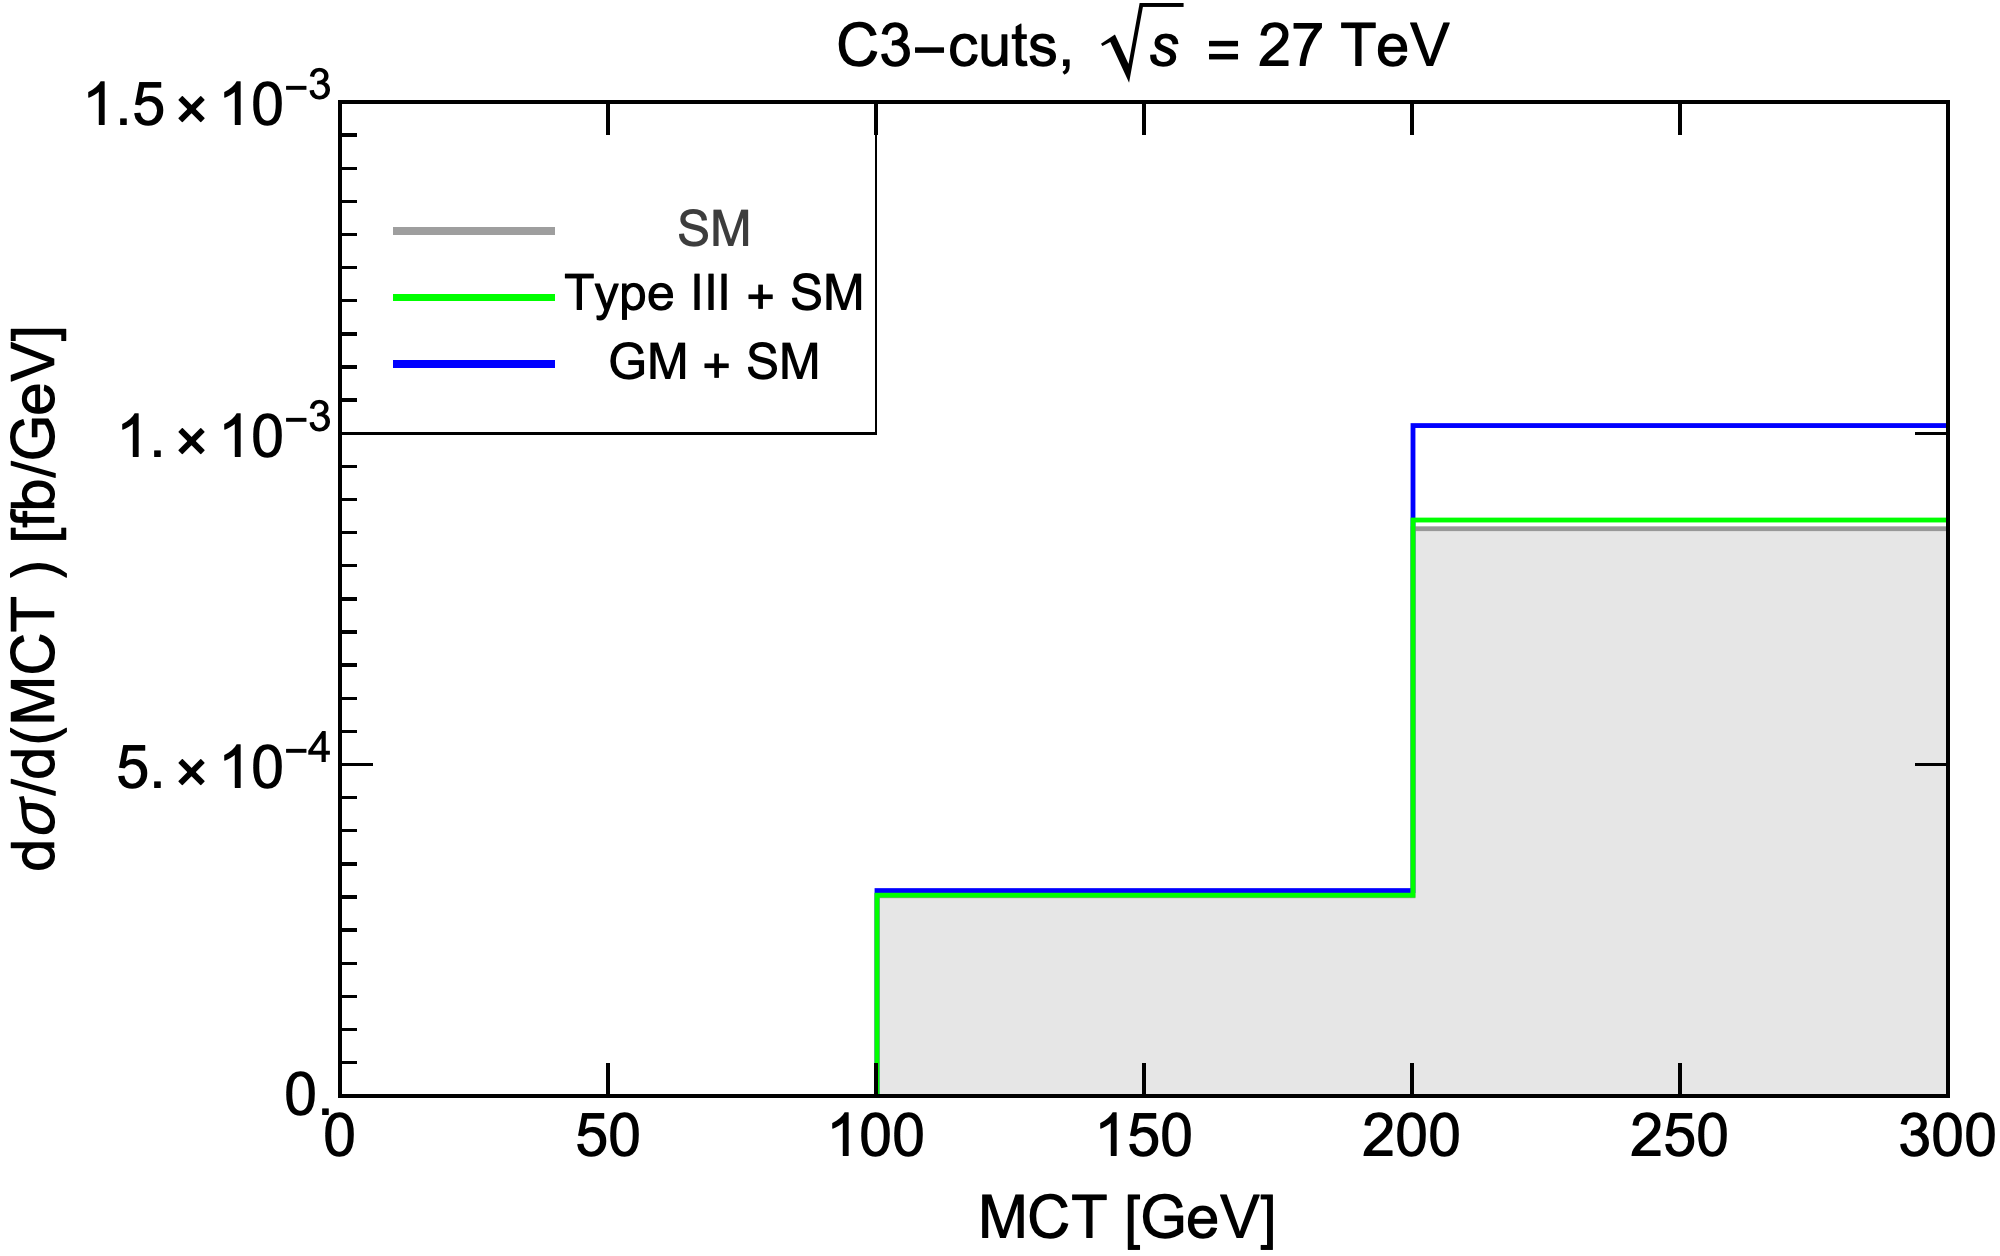
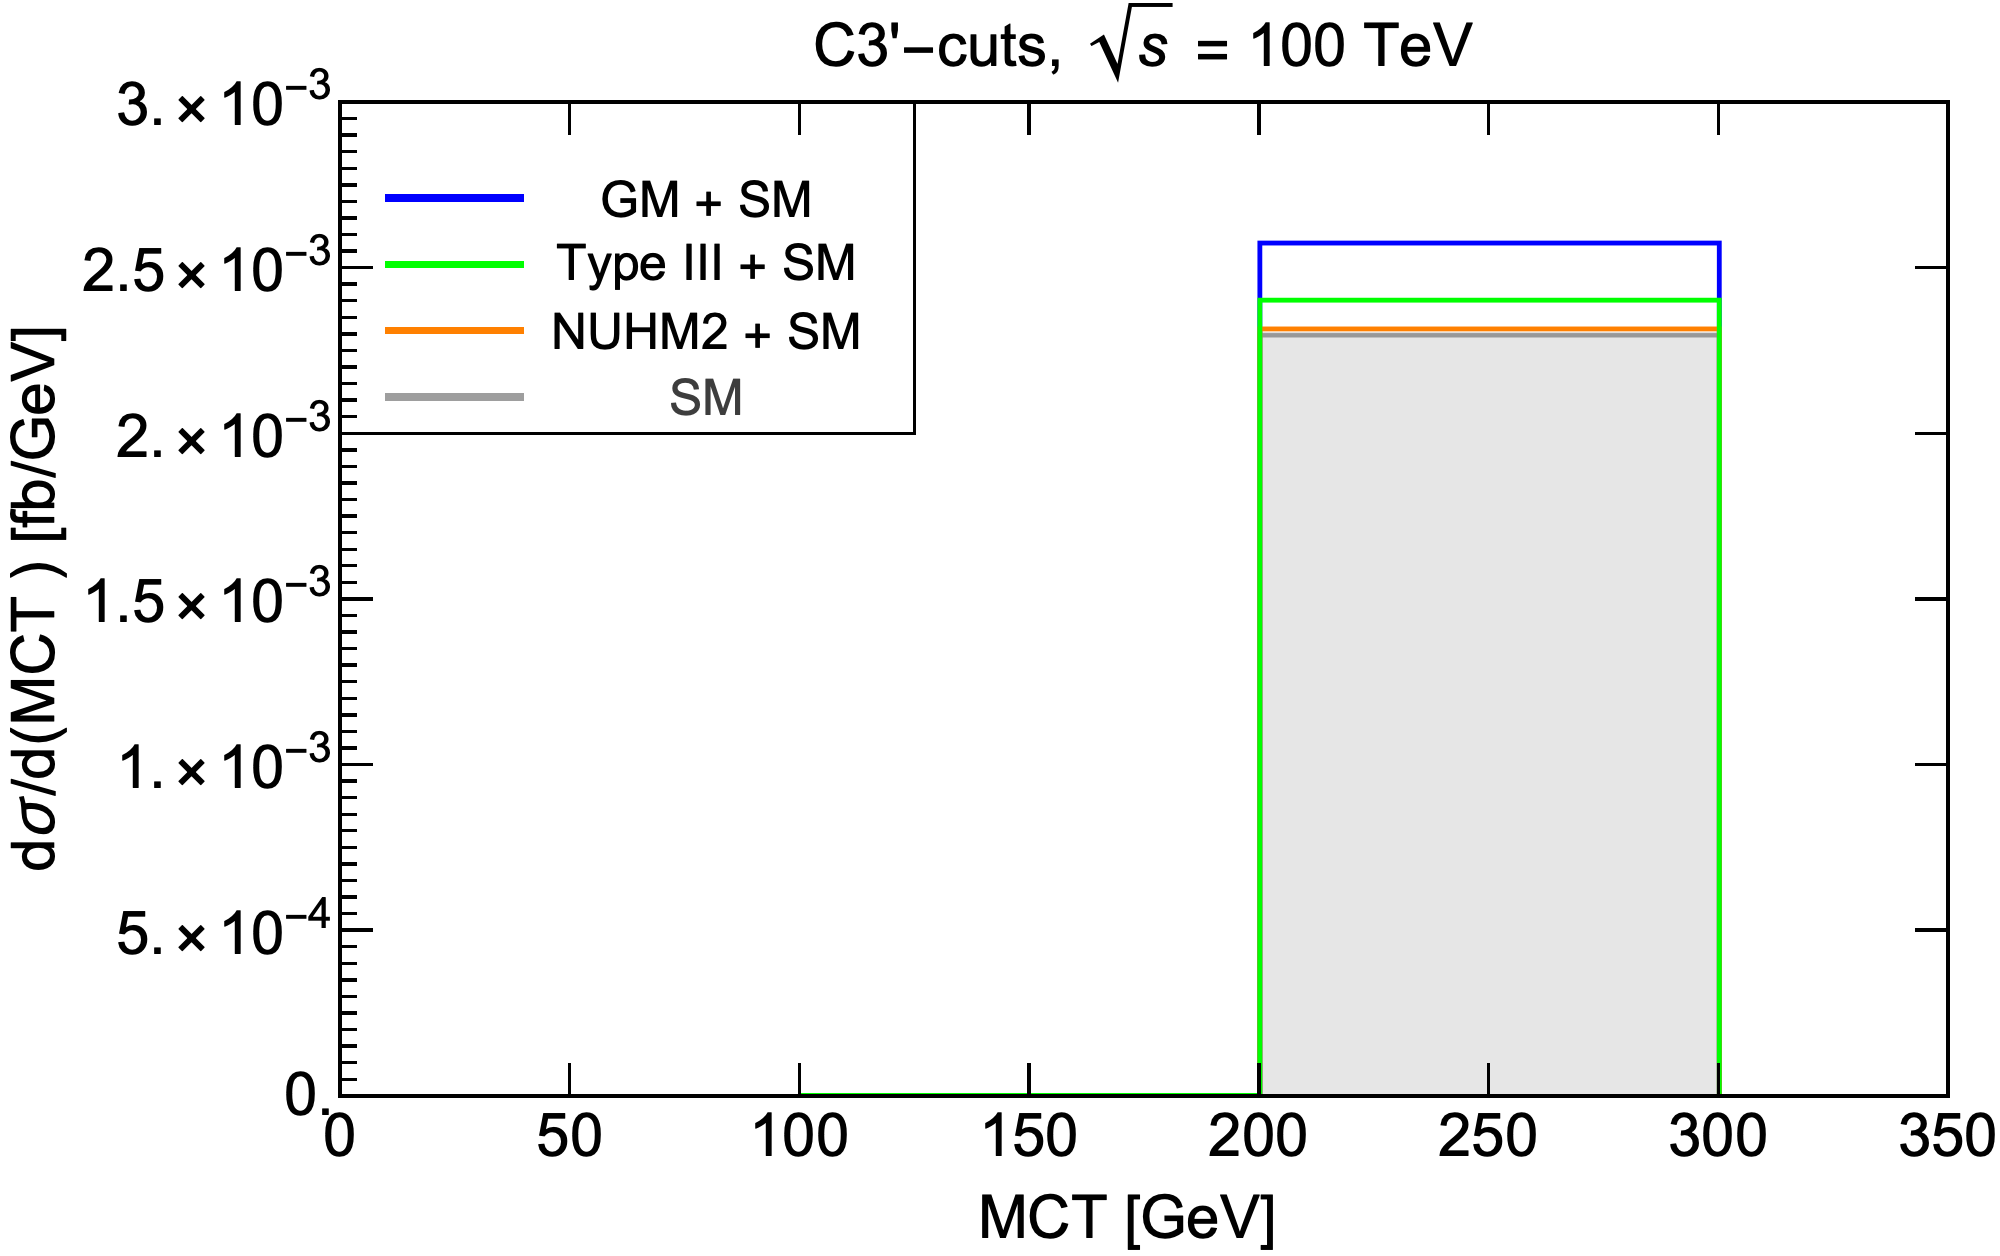
As can be inferred from Table VI, with the C3 (C3′)-cuts at () TeV, the GM model signal can be observed above the 5 level with IL = 15 ab-1 while the other two BSM scenarios yield a significance below 5. In Fig. 13, we show the MCT distribution and the distribution for the total SM background and the various signals on top of it, after the C3 and C3′-cuts at the respective energies.
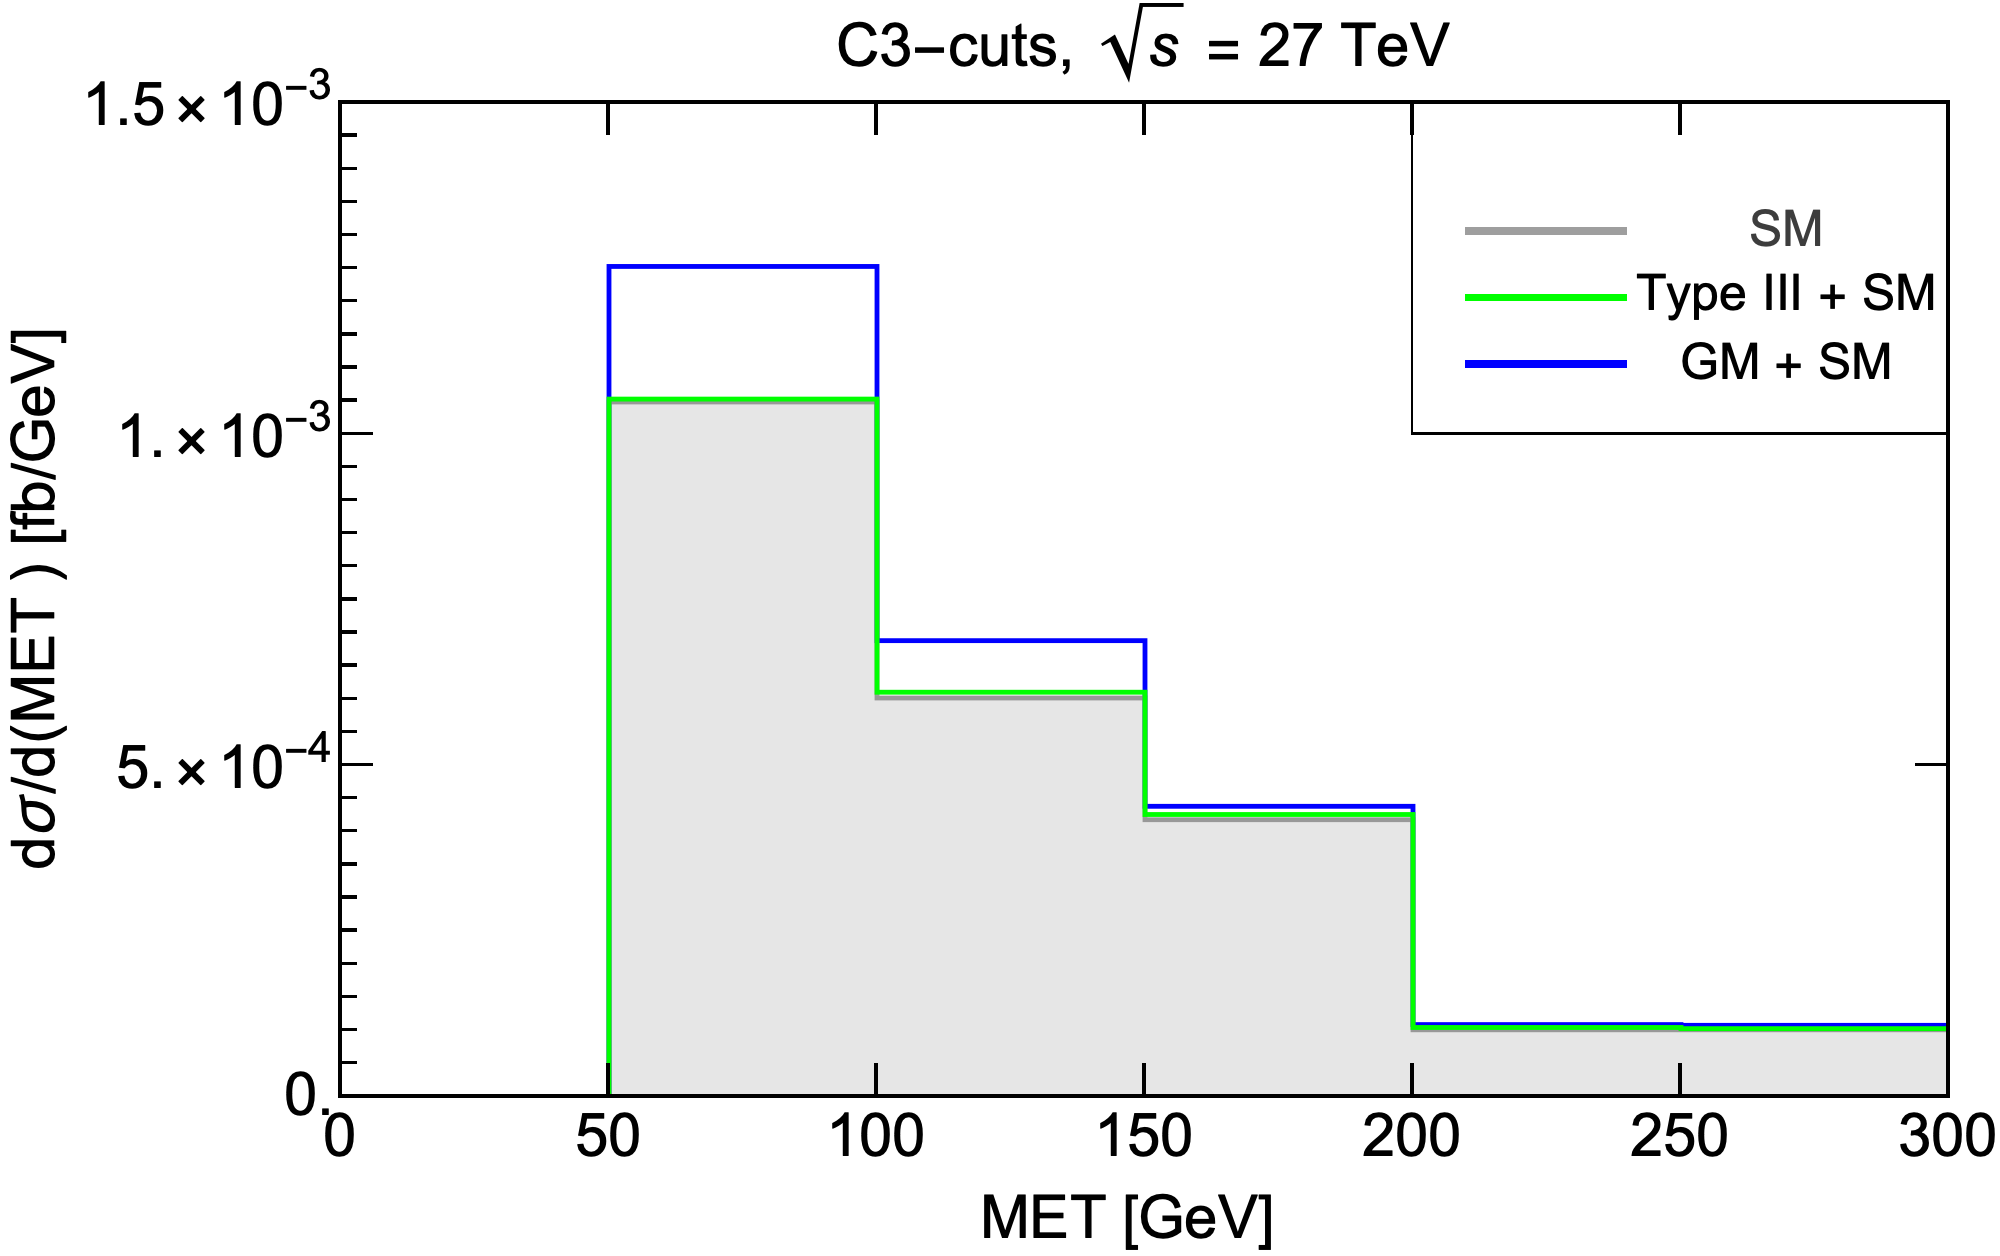
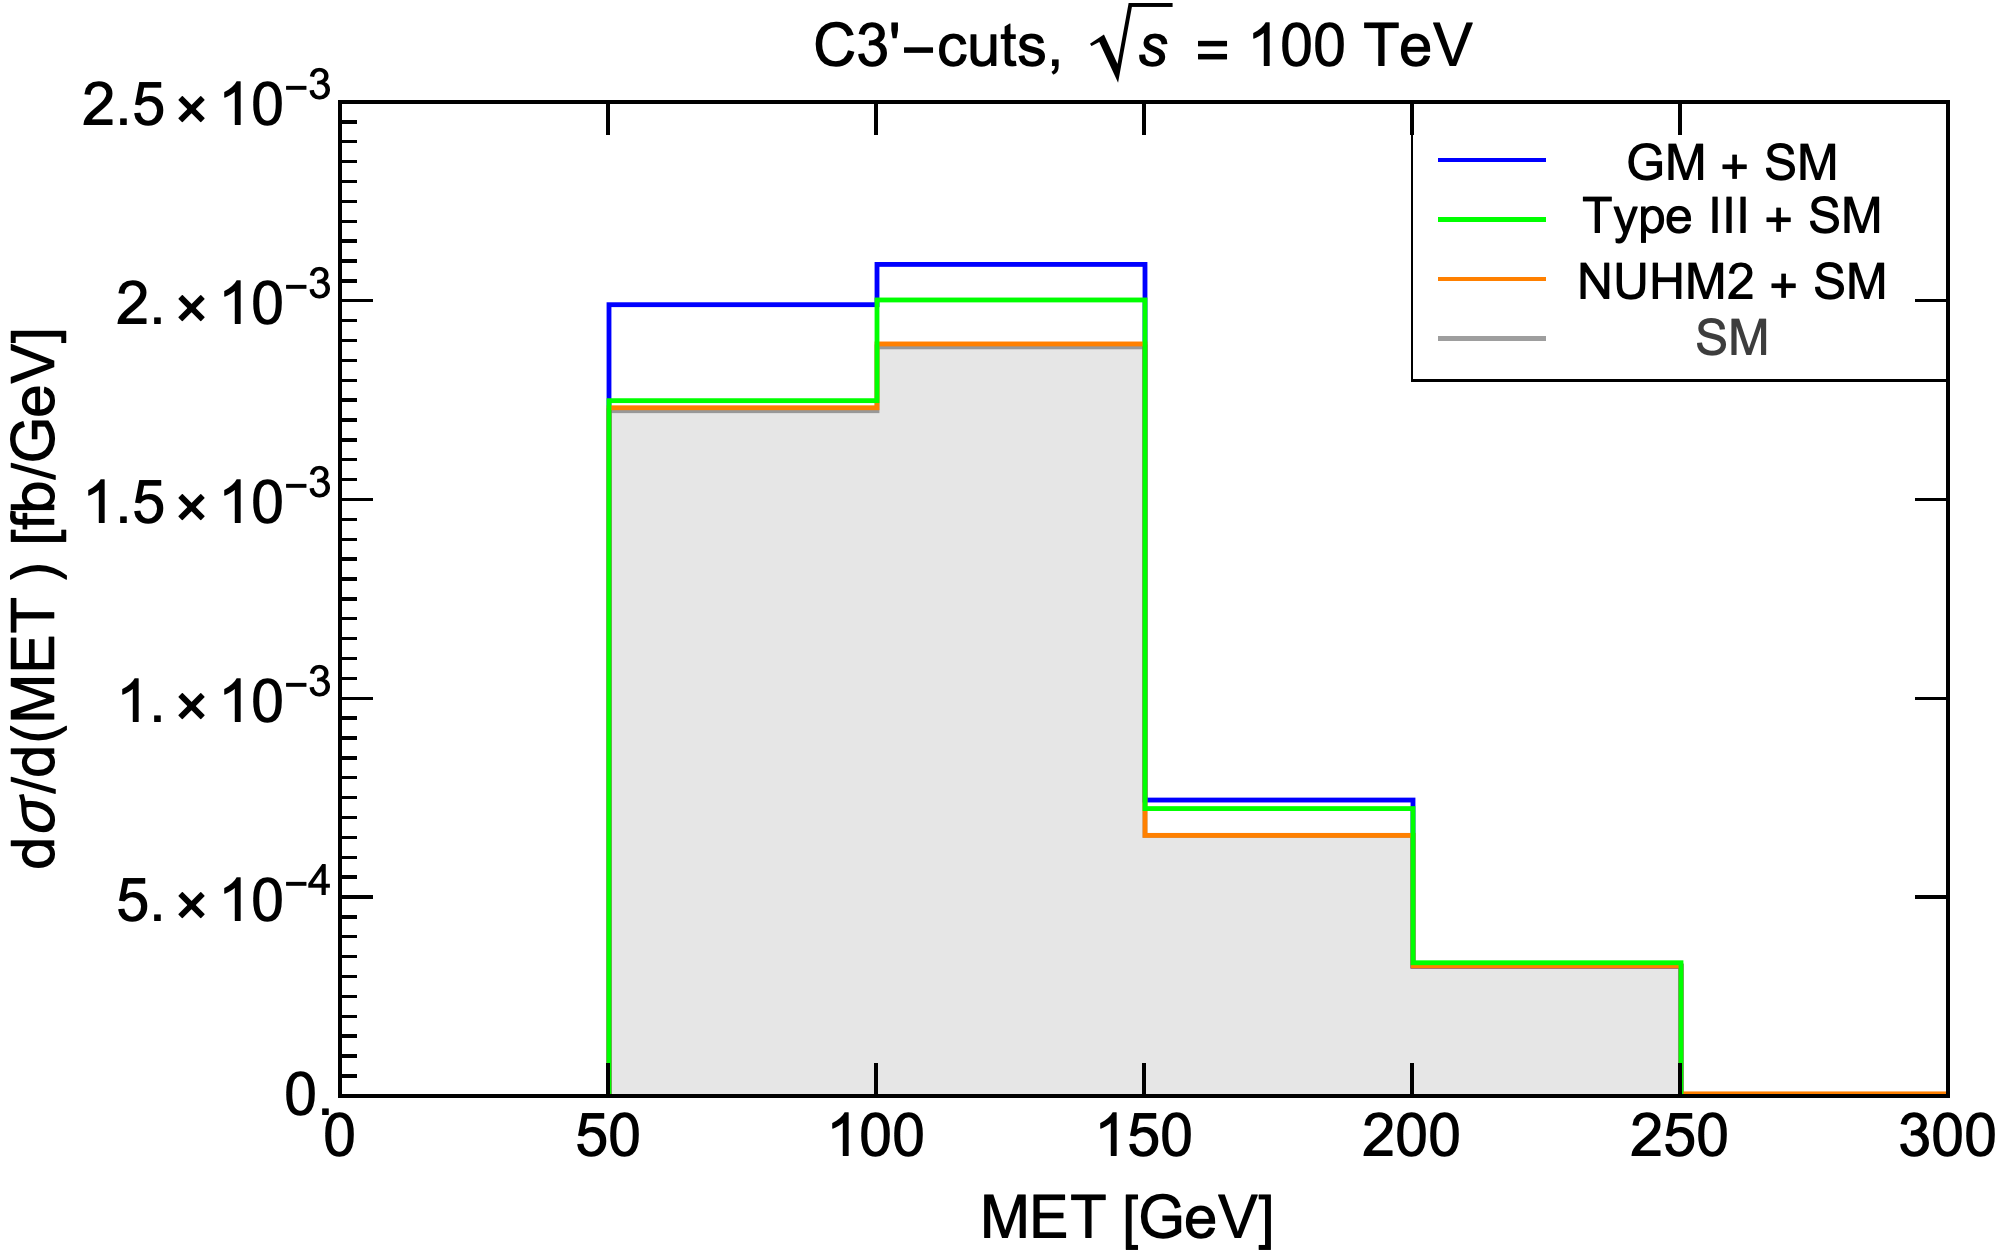
As seen in the above background and signal evaluations, the dominant SM backgrounds, and vanish completely after all the final cuts. This happens because after the S1-cuts, the surviving events from the background will have one lepton originating from real , another lepton coming from semi-leptonic decay of one of the -jets and the would also dominantly come from leptonic decays of . Some of these surviving events will survive the C2-cuts also as these surviving events are accompanied by two or more jets originating from either semi-leptonic decay of -jets or misidentification of the -jet as some lighter jet. In that case, would be mostly bounded by . Therefore, a cut of would reduce the background as well as the background to a great extent which indeed is the case as seen in the above analyses.
Note that, we have taken GeV (not at par with the mass of intermediate states in the other two new physics model signature) in order to highlight the fact that experimental limits on do allow us to take such low mass of . However, even with such small , we still do not obtain significance unless for the scheme of IL = 15 ab-1 for both 27 and 100 TeV because the SM background of is very much similar to the GM model signal. Thus, the cuts employed to extract the GM model do not reduce the background as efficiently as they reduce the other SM backgrounds. Since the GM model signal is produced via the VBF process, taking , would yield a much lower cross section and one might need to resort to a higher-energy collider to obtain significance for the GM model signal.
4 Conclusions
In this paper, our goal is to catalogue various BSM scenarios that can give rise to the SSdB+ (precisely SSdL+, as considering leptonic decays of the diboson gets rid of the large SM QCD backgrounds) signature in experiments and extract these signals from SM background by imposing suitable cuts. Since more than one BSM scenario qualify, we also focus on devising suitable cuts to distinguish these BSM models from one another. We have analyzed three new physics models: the NUHM2 scenario of natural SUSY models, the type-III seesaw model, and the GM model. We carefully select the imposed cuts for each model to obtain a sufficiently large significance for its signal. Assuming = 15 ab-1 and () TeV, the C3 (C3′)-cuts and the B2 (B2′)-cuts are needed to observe clean GM model and type-III seesaw model signals, respectively, at a level above significance. For the NUHM2 model, a clean signal at a level above significance can be seen with the A3 (A3′)-cuts for data collected from = 3 ab-1 and () TeV.
Acknowledgments
We thank Howard Baer for useful discussions. The work of CWC and DS was supported in part by the Ministry of Science and Technology (MOST) of Taiwan under Grant Nos. 108-2112-M-002-005-MY3 and 109-2811-M-002-570.
References
- [1] ATLAS Collaboration, G. Aad et al., “Observation of a new particle in the search for the Standard Model Higgs boson with the ATLAS detector at the LHC,” Phys. Lett. B 716 (2012) 1–29, arXiv:1207.7214 [hep-ex].
- [2] CMS Collaboration, S. Chatrchyan et al., “Observation of a New Boson at a Mass of 125 GeV with the CMS Experiment at the LHC,” Phys. Lett. B 716 (2012) 30–61, arXiv:1207.7235 [hep-ex].
- [3] D. Matalliotakis and H. P. Nilles, “Implications of nonuniversality of soft terms in supersymmetric grand unified theories,” Nucl. Phys. B 435 (1995) 115–128, arXiv:hep-ph/9407251.
- [4] H. Baer, A. Mustafayev, S. Profumo, A. Belyaev, and X. Tata, “Direct, indirect and collider detection of neutralino dark matter in SUSY models with non-universal Higgs masses,” JHEP 07 (2005) 065, arXiv:hep-ph/0504001.
- [5] H. Baer, V. Barger, H. Serce, and X. Tata, “Natural generalized mirage mediation,” Phys. Rev. D 94 no. 11, (2016) 115017, arXiv:1610.06205 [hep-ph].
- [6] L. Randall and R. Sundrum, “Out of this world supersymmetry breaking,” Nucl. Phys. B 557 (1999) 79–118, arXiv:hep-th/9810155.
- [7] H. Baer, V. Barger, and D. Sengupta, “Anomaly mediated SUSY breaking model retrofitted for naturalness,” Phys. Rev. D 98 no. 1, (2018) 015039, arXiv:1801.09730 [hep-ph].
- [8] H. Baer, V. Barger, S. Salam, D. Sengupta, and K. Sinha, “Status of weak scale supersymmetry after LHC Run 2 and ton-scale noble liquid WIMP searches,” Eur. Phys. J. ST 229 no. 21, (2020) 3085–3141, arXiv:2002.03013 [hep-ph].
- [9] R. Foot, H. Lew, X. G. He, and G. C. Joshi, “Seesaw Neutrino Masses Induced by a Triplet of Leptons,” Z. Phys. C 44 (1989) 441.
- [10] M. Magg and C. Wetterich, “Neutrino Mass Problem and Gauge Hierarchy,” Phys. Lett. B 94 (1980) 61–64.
- [11] J. Schechter and J. W. F. Valle, “Neutrino Masses in SU(2) x U(1) Theories,” Phys. Rev. D 22 (1980) 2227.
- [12] R. N. Mohapatra and G. Senjanovic, “Neutrino Mass and Spontaneous Parity Nonconservation,” Phys. Rev. Lett. 44 (1980) 912.
- [13] G. Lazarides, Q. Shafi, and C. Wetterich, “Proton Lifetime and Fermion Masses in an SO(10) Model,” Nucl. Phys. B 181 (1981) 287–300.
- [14] H. Georgi and M. Machacek, “DOUBLY CHARGED HIGGS BOSONS,” Nucl. Phys. B 262 (1985) 463–477.
- [15] H. Baer and X. Tata, Weak scale supersymmetry: From superfields to scattering events. Cambridge University Press, 5, 2006.
- [16] H. Baer, V. Barger, J. S. Gainer, D. Sengupta, H. Serce, and X. Tata, “LHC luminosity and energy upgrades confront natural supersymmetry models,” Phys. Rev. D 98 no. 7, (2018) 075010, arXiv:1808.04844 [hep-ph].
- [17] H. P. Nilles, M. Srednicki, and D. Wyler, “Weak Interaction Breakdown Induced by Supergravity,” Phys. Lett. B 120 (1983) 346.
- [18] J. M. Frere, D. R. T. Jones, and S. Raby, “Fermion Masses and Induction of the Weak Scale by Supergravity,” Nucl. Phys. B 222 (1983) 11–19.
- [19] J. P. Derendinger and C. A. Savoy, “Quantum Effects and SU(2) x U(1) Breaking in Supergravity Gauge Theories,” Nucl. Phys. B 237 (1984) 307–328.
- [20] M. Maniatis, “The Next-to-Minimal Supersymmetric extension of the Standard Model reviewed,” Int. J. Mod. Phys. A 25 (2010) 3505–3602, arXiv:0906.0777 [hep-ph].
- [21] U. Ellwanger, C. Hugonie, and A. M. Teixeira, “The Next-to-Minimal Supersymmetric Standard Model,” Phys. Rept. 496 (2010) 1–77, arXiv:0910.1785 [hep-ph].
- [22] ATLAS Collaboration, M. Aaboud et al., “Measurement of production in the final state with the ATLAS detector in collisions at TeV,” JHEP 10 (2019) 127, arXiv:1905.07163 [hep-ex].
- [23] V. Barger, G. Shaughnessy, and B. Yencho, “Many Leptons at the LHC from the NMSSM,” Phys. Rev. D 83 (2011) 055006, arXiv:1011.3526 [hep-ph].
- [24] H. Baer, V. Barger, P. Huang, D. Mickelson, M. Padeffke-Kirkland, and X. Tata, “Natural SUSY with a bino- or wino-like LSP,” Phys. Rev. D 91 no. 7, (2015) 075005, arXiv:1501.06357 [hep-ph].
- [25] R. K. Barman, G. Belanger, B. Bhattacherjee, R. Godbole, G. Mendiratta, and D. Sengupta, “Invisible decay of the Higgs boson in the context of a thermal and nonthermal relic in MSSM,” Phys. Rev. D 95 no. 9, (2017) 095018, arXiv:1703.03838 [hep-ph].
- [26] R. K. Barman, G. Bélanger, B. Bhattacherjee, R. Godbole, D. Sengupta, and X. Tata, “Current bounds and future prospects of light neutralino dark matter in NMSSM,” Phys. Rev. D 103 no. 1, (2021) 015029, arXiv:2006.07854 [hep-ph].
- [27] H. Baer, V. Barger, P. Huang, D. Mickelson, A. Mustafayev, W. Sreethawong, and X. Tata, “Same sign diboson signature from supersymmetry models with light higgsinos at the LHC,” Phys. Rev. Lett. 110 no. 15, (2013) 151801, arXiv:1302.5816 [hep-ph].
- [28] H. Baer, V. Barger, J. S. Gainer, M. Savoy, D. Sengupta, and X. Tata, “Aspects of the same-sign diboson signature from wino pair production with light higgsinos at the high luminosity LHC,” Phys. Rev. D 97 no. 3, (2018) 035012, arXiv:1710.09103 [hep-ph].
- [29] S. Jana, N. Okada, and D. Raut, “Displaced Vertex and Disappearing Track Signatures in type-III Seesaw,” arXiv:1911.09037 [hep-ph].
- [30] ATLAS Collaboration, M. Aaboud et al., “Search for squarks and gluinos in final states with jets and missing transverse momentum using 36 fb-1 of TeV pp collision data with the ATLAS detector,” Phys. Rev. D 97 no. 11, (2018) 112001, arXiv:1712.02332 [hep-ex].
- [31] ATLAS, CMS Collaboration, T. A. Vami, “Searches for gluinos and squarks,” PoS LHCP2019 (2019) 168, arXiv:1909.11753 [hep-ex].
- [32] ATLAS Collaboration, “Search for direct top squark pair production in the 3-body decay mode with a final state containing one lepton, jets, and missing transverse momentum in TeV collision data with the ATLAS detector,”.
- [33] CMS Collaboration, A. M. Sirunyan et al., “Search for direct top squark pair production in events with one lepton, jets, and missing transverse momentum at 13 TeV with the CMS experiment,” JHEP 05 (2020) 032, arXiv:1912.08887 [hep-ex].
- [34] N. Craig, “The State of Supersymmetry after Run I of the LHC,” in Beyond the Standard Model after the first run of the LHC. 9, 2013. arXiv:1309.0528 [hep-ph].
- [35] R. Barbieri and G. F. Giudice, “Upper Bounds on Supersymmetric Particle Masses,” Nucl. Phys. B 306 (1988) 63–76.
- [36] M. Papucci, J. T. Ruderman, and A. Weiler, “Natural SUSY Endures,” JHEP 09 (2012) 035, arXiv:1110.6926 [hep-ph].
- [37] R. Kitano and Y. Nomura, “Supersymmetry, naturalness, and signatures at the LHC,” Phys. Rev. D 73 (2006) 095004, arXiv:hep-ph/0602096.
- [38] H. Baer, V. Barger, and D. Mickelson, “How conventional measures overestimate electroweak fine-tuning in supersymmetric theory,” Phys. Rev. D 88 no. 9, (2013) 095013, arXiv:1309.2984 [hep-ph].
- [39] A. Mustafayev and X. Tata, “Supersymmetry, Naturalness, and Light Higgsinos,” Indian J. Phys. 88 (2014) 991–1004, arXiv:1404.1386 [hep-ph].
- [40] H. Baer, V. Barger, D. Mickelson, and M. Padeffke-Kirkland, “SUSY models under siege: LHC constraints and electroweak fine-tuning,” Phys. Rev. D 89 no. 11, (2014) 115019, arXiv:1404.2277 [hep-ph].
- [41] H. Baer, V. Barger, P. Huang, D. Mickelson, A. Mustafayev, and X. Tata, “Radiative natural supersymmetry: Reconciling electroweak fine-tuning and the Higgs boson mass,” Phys. Rev. D 87 no. 11, (2013) 115028, arXiv:1212.2655 [hep-ph].
- [42] LEP, ALEPH, DELPHI, L3, OPAL, LEP Electroweak Working Group, SLD Electroweak Group, SLD Heavy Flavor Group Collaboration, t. S. Electroweak, “A Combination of preliminary electroweak measurements and constraints on the standard model,” arXiv:hep-ex/0312023.
- [43] H. Baer, V. Barger, M. Savoy, and H. Serce, “The Higgs mass and natural supersymmetric spectrum from the landscape,” Phys. Lett. B 758 (2016) 113–117, arXiv:1602.07697 [hep-ph].
- [44] H. Baer, V. Barger, D. Sengupta, and X. Tata, “Is natural higgsino-only dark matter excluded?,” Eur. Phys. J. C 78 no. 10, (2018) 838, arXiv:1803.11210 [hep-ph].
- [45] R. D. Peccei and H. R. Quinn, “CP Conservation in the Presence of Instantons,” Phys. Rev. Lett. 38 (1977) 1440–1443.
- [46] R. D. Peccei and H. R. Quinn, “Constraints Imposed by CP Conservation in the Presence of Instantons,” Phys. Rev. D 16 (1977) 1791–1797.
- [47] S. Weinberg, “A New Light Boson?,” Phys. Rev. Lett. 40 (1978) 223–226.
- [48] F. Wilczek, “Problem of Strong and Invariance in the Presence of Instantons,” Phys. Rev. Lett. 40 (1978) 279–282.
- [49] J. E. Kim, “Weak Interaction Singlet and Strong CP Invariance,” Phys. Rev. Lett. 43 (1979) 103.
- [50] M. A. Shifman, A. I. Vainshtein, and V. I. Zakharov, “Can Confinement Ensure Natural CP Invariance of Strong Interactions?,” Nucl. Phys. B 166 (1980) 493–506.
- [51] M. Dine, W. Fischler, and M. Srednicki, “A Simple Solution to the Strong CP Problem with a Harmless Axion,” Phys. Lett. B 104 (1981) 199–202.
- [52] A. R. Zhitnitsky, “On Possible Suppression of the Axion Hadron Interactions. (In Russian),” Sov. J. Nucl. Phys. 31 (1980) 260.
- [53] XENON Collaboration, E. Aprile et al., “First Dark Matter Search Results from the XENON1T Experiment,” Phys. Rev. Lett. 119 no. 18, (2017) 181301, arXiv:1705.06655 [astro-ph.CO].
- [54] F. E. Paige, S. D. Protopopescu, H. Baer, and X. Tata, “ISAJET 7.69: A Monte Carlo event generator for pp, anti-p p, and e+e- reactions,” arXiv:hep-ph/0312045.
- [55] R. Franceschini, T. Hambye, and A. Strumia, “Type-III see-saw at LHC,” Phys. Rev. D 78 (2008) 033002, arXiv:0805.1613 [hep-ph].
- [56] A. Arhrib, B. Bajc, D. K. Ghosh, T. Han, G.-Y. Huang, I. Puljak, and G. Senjanovic, “Collider Signatures for Heavy Lepton Triplet in Type I+III Seesaw,” Phys. Rev. D 82 (2010) 053004, arXiv:0904.2390 [hep-ph].
- [57] P. Bandyopadhyay, S. Choi, E. J. Chun, and K. Min, “Probing Higgs bosons via the type III seesaw mechanism at the LHC,” Phys. Rev. D 85 (2012) 073013, arXiv:1112.3080 [hep-ph].
- [58] D. Goswami and P. Poulose, “Direct searches of Type III seesaw triplet fermions at high energy collider,” Eur. Phys. J. C 78 no. 1, (2018) 42, arXiv:1702.07215 [hep-ph].
- [59] A. Das, S. Mandal, and T. Modak, “Testing triplet fermions at the electron-positron and electron-proton colliders using fat jet signatures,” Phys. Rev. D 102 no. 3, (2020) 033001, arXiv:2005.02267 [hep-ph].
- [60] S. Ashanujjaman and K. Ghosh, “Type-III Seesaw: Phenomenological Implications of the Information Lost in Decoupling from High-Energy to Low-Energy,” arXiv:2102.09536 [hep-ph].
- [61] A. Das and S. Mandal, “Bounds on the triplet fermions in type-III seesaw and implications for collider searches,” Nucl. Phys. B 966 (2021) 115374, arXiv:2006.04123 [hep-ph].
- [62] C. Biggio, E. Fernandez-Martinez, M. Filaci, J. Hernandez-Garcia, and J. Lopez-Pavon, “Global Bounds on the Type-III Seesaw,” JHEP 05 (2020) 022, arXiv:1911.11790 [hep-ph].
- [63] F. del Aguila and J. A. Aguilar-Saavedra, “Distinguishing seesaw models at LHC with multi-lepton signals,” Nucl. Phys. B 813 (2009) 22–90, arXiv:0808.2468 [hep-ph].
- [64] CMS Collaboration, A. M. Sirunyan et al., “Search for disappearing tracks in proton-proton collisions at 13 TeV,” Phys. Lett. B 806 (2020) 135502, arXiv:2004.05153 [hep-ex].
- [65] R. N. Mohapatra and G. Senjanovic, “Neutrino Masses and Mixings in Gauge Models with Spontaneous Parity Violation,” Phys. Rev. D 23 (1981) 165.
- [66] J. C. Pati and A. Salam, “Lepton Number as the Fourth Color,” Phys. Rev. D 10 (1974) 275–289. [Erratum: Phys.Rev.D 11, 703–703 (1975)].
- [67] R. N. Mohapatra and J. C. Pati, “Left-Right Gauge Symmetry and an Isoconjugate Model of CP Violation,” Phys. Rev. D 11 (1975) 566–571.
- [68] G. Senjanovic and R. N. Mohapatra, “Exact Left-Right Symmetry and Spontaneous Violation of Parity,” Phys. Rev. D 12 (1975) 1502.
- [69] R. Kuchimanchi and R. N. Mohapatra, “No parity violation without R-parity violation,” Phys. Rev. D 48 (1993) 4352–4360, arXiv:hep-ph/9306290.
- [70] K. S. Babu and R. N. Mohapatra, “Minimal Supersymmetric Left-Right Model,” Phys. Lett. B 668 (2008) 404–409, arXiv:0807.0481 [hep-ph].
- [71] K. S. Babu and A. Patra, “Higgs Boson Spectra in Supersymmetric Left-Right Models,” Phys. Rev. D 93 no. 5, (2016) 055030, arXiv:1412.8714 [hep-ph].
- [72] L. Basso, B. Fuks, M. E. Krauss, and W. Porod, “Doubly-charged Higgs and vacuum stability in left-right supersymmetry,” JHEP 07 (2015) 147, arXiv:1503.08211 [hep-ph].
- [73] A. Zee, “Quantum Numbers of Majorana Neutrino Masses,” Nucl. Phys. B 264 (1986) 99–110.
- [74] K. S. Babu, “Model of ’Calculable’ Majorana Neutrino Masses,” Phys. Lett. B 203 (1988) 132–136.
- [75] N. Arkani-Hamed, A. G. Cohen, E. Katz, A. E. Nelson, T. Gregoire, and J. G. Wacker, “The Minimal moose for a little Higgs,” JHEP 08 (2002) 021, arXiv:hep-ph/0206020.
- [76] K. S. Babu, P. S. B. Dev, S. Jana, and A. Thapa, “Unified framework for -anomalies, muon and neutrino masses,” JHEP 03 (2021) 179, arXiv:2009.01771 [hep-ph].
- [77] J. F. Gunion, R. Vega, and J. Wudka, “Higgs triplets in the standard model,” Phys. Rev. D 42 (1990) 1673–1691.
- [78] K. S. Babu, S. Nandi, and Z. Tavartkiladze, “New Mechanism for Neutrino Mass Generation and Triply Charged Higgs Bosons at the LHC,” Phys. Rev. D 80 (2009) 071702, arXiv:0905.2710 [hep-ph].
- [79] F. Bonnet, D. Hernandez, T. Ota, and W. Winter, “Neutrino masses from higher than d=5 effective operators,” JHEP 10 (2009) 076, arXiv:0907.3143 [hep-ph].
- [80] S. Bhattacharya, S. Jana, and S. Nandi, “Neutrino Masses and Scalar Singlet Dark Matter,” Phys. Rev. D 95 no. 5, (2017) 055003, arXiv:1609.03274 [hep-ph].
- [81] K. Kumericki, I. Picek, and B. Radovcic, “TeV-scale Seesaw with Quintuplet Fermions,” Phys. Rev. D 86 (2012) 013006, arXiv:1204.6599 [hep-ph].
- [82] Y. Cai, T. Han, T. Li, and R. Ruiz, “Lepton Number Violation: Seesaw Models and Their Collider Tests,” Front. in Phys. 6 (2018) 40, arXiv:1711.02180 [hep-ph].
- [83] C.-W. Chiang, T. Nomura, and K. Tsumura, “Search for doubly charged Higgs bosons using the same-sign diboson mode at the LHC,” Phys. Rev. D 85 (2012) 095023, arXiv:1202.2014 [hep-ph].
- [84] C.-W. Chiang, A.-L. Kuo, and T. Yamada, “Searches of exotic Higgs bosons in general mass spectra of the Georgi-Machacek model at the LHC,” JHEP 01 (2016) 120, arXiv:1511.00865 [hep-ph].
- [85] Particle Data Group Collaboration, P. A. Zyla et al., “Review of Particle Physics,” PTEP 2020 no. 8, (2020) 083C01.
- [86] S. Blasi, S. De Curtis, and K. Yagyu, “Effects of custodial symmetry breaking in the Georgi-Machacek model at high energies,” Phys. Rev. D 96 no. 1, (2017) 015001, arXiv:1704.08512 [hep-ph].
- [87] C.-W. Chiang, A.-L. Kuo, and K. Yagyu, “One-loop renormalized Higgs boson vertices in the Georgi-Machacek model,” Phys. Rev. D 98 no. 1, (2018) 013008, arXiv:1804.02633 [hep-ph].
- [88] A. Melfo, M. Nemevsek, F. Nesti, G. Senjanovic, and Y. Zhang, “Type II Seesaw at LHC: The Roadmap,” Phys. Rev. D 85 (2012) 055018, arXiv:1108.4416 [hep-ph].
- [89] M. Aoki, S. Kanemura, and K. Yagyu, “Testing the Higgs triplet model with the mass difference at the LHC,” Phys. Rev. D 85 (2012) 055007, arXiv:1110.4625 [hep-ph].
- [90] C.-W. Chiang and K. Yagyu, “Testing the custodial symmetry in the Higgs sector of the Georgi-Machacek model,” JHEP 01 (2013) 026, arXiv:1211.2658 [hep-ph].
- [91] R. M. Barnett, J. F. Gunion, and H. E. Haber, “LIKE SIGN DILEPTONS AS A SIGNAL FOR GLUINO PRODUCTION,” in 1988 DPF Summer Study on High-energy Physics in the 1990s (Snowmass 88). 10, 1988.
- [92] H. Baer, X. Tata, and J. Woodside, “Gluino Cascade Decay Signatures at the Tevatron Collider,” Phys. Rev. D 41 (1990) 906–915.
- [93] H. Baer, X. Tata, and J. Woodside, “Multi - lepton signals from supersymmetry at hadron super colliders,” Phys. Rev. D 45 (1992) 142–160.
- [94] R. M. Barnett, J. F. Gunion, and H. E. Haber, “Discovering supersymmetry with like sign dileptons,” Phys. Lett. B 315 (1993) 349–354, arXiv:hep-ph/9306204.
- [95] J. Alwall, M. Herquet, F. Maltoni, O. Mattelaer, and T. Stelzer, “MadGraph 5 : Going Beyond,” JHEP 06 (2011) 128, arXiv:1106.0522 [hep-ph].
- [96] J. Alwall, R. Frederix, S. Frixione, V. Hirschi, F. Maltoni, O. Mattelaer, H. S. Shao, T. Stelzer, P. Torrielli, and M. Zaro, “The automated computation of tree-level and next-to-leading order differential cross sections, and their matching to parton shower simulations,” JHEP 07 (2014) 079, arXiv:1405.0301 [hep-ph].
- [97] T. Sjöstrand, S. Ask, J. R. Christiansen, R. Corke, N. Desai, P. Ilten, S. Mrenna, S. Prestel, C. O. Rasmussen, and P. Z. Skands, “An introduction to PYTHIA 8.2,” Comput. Phys. Commun. 191 (2015) 159–177, arXiv:1410.3012 [hep-ph].
- [98] DELPHES 3 Collaboration, J. de Favereau, C. Delaere, P. Demin, A. Giammanco, V. Lemaître, A. Mertens, and M. Selvaggi, “DELPHES 3, A modular framework for fast simulation of a generic collider experiment,” JHEP 02 (2014) 057, arXiv:1307.6346 [hep-ex].
- [99] M. Cacciari, G. P. Salam, and G. Soyez, “The anti- jet clustering algorithm,” JHEP 04 (2008) 063, arXiv:0802.1189 [hep-ph].
- [100] CMS Collaboration, S. Chatrchyan et al., “Identification of b-Quark Jets with the CMS Experiment,” JINST 8 (2013) P04013, arXiv:1211.4462 [hep-ex].
- [101] CMS Collaboration, A. M. Sirunyan et al., “Identification of heavy-flavour jets with the CMS detector in pp collisions at 13 TeV,” JINST 13 no. 05, (2018) P05011, arXiv:1712.07158 [physics.ins-det].
- [102] CMS Collaboration Collaboration, “Tau Identification Performance in 2017 Data at TeV,”. https://cds.cern.ch/record/2622155.
- [103] CMS Collaboration, V. Khachatryan et al., “Reconstruction and identification of lepton decays to hadrons and τ at CMS,” JINST 11 no. 01, (2016) P01019, arXiv:1510.07488 [physics.ins-det].
- [104] W. Beenakker, R. Hopker, and M. Spira, “PROSPINO: A Program for the production of supersymmetric particles in next-to-leading order QCD,” arXiv:hep-ph/9611232.
- [105] T. Gherghetta, G. F. Giudice, and J. D. Wells, “Phenomenological consequences of supersymmetry with anomaly induced masses,” Nucl. Phys. B 559 (1999) 27–47, arXiv:hep-ph/9904378.
- [106] J. L. Feng and T. Moroi, “Supernatural supersymmetry: Phenomenological implications of anomaly mediated supersymmetry breaking,” Phys. Rev. D 61 (2000) 095004, arXiv:hep-ph/9907319.
- [107] ATLAS Collaboration, “Search for doubly-charged Higgs bosons in same-charge electron pair final states using proton-proton collisions at with the ATLAS detector,”.
- [108] CMS Collaboration, A. M. Sirunyan et al., “Measurements of the production cross section and the branching fraction, and constraints on anomalous triple gauge couplings at ,” Eur. Phys. J. C 78 (2018) 165, arXiv:1709.08601 [hep-ex]. [Erratum: Eur.Phys.J.C 78, 515 (2018)].
- [109] D. T. Nhung, L. D. Ninh, and M. M. Weber, “NLO production at the LHC,” in 9th Rencontres du Vietnam: Windows on the Universe, pp. 219–222. 2013. arXiv:1310.6159 [hep-ph].
- [110] D. T. Nhung, L. D. Ninh, and M. M. Weber, “NLO corrections to WWZ production at the LHC,” JHEP 12 (2013) 096, arXiv:1307.7403 [hep-ph].
- [111] V. Hankele and D. Zeppenfeld, “QCD corrections to hadronic WWZ production with leptonic decays,” Phys. Lett. B 661 (2008) 103–108, arXiv:0712.3544 [hep-ph].
- [112] NLO Multileg Working Group Collaboration, Z. Bern et al., “The NLO multileg working group: Summary report,” in 5th Les Houches Workshop on Physics at TeV Colliders, pp. 1–120. 3, 2008. arXiv:0803.0494 [hep-ph].
- [113] A. Ballestrero et al., “Precise predictions for same-sign W-boson scattering at the LHC,” Eur. Phys. J. C 78 no. 8, (2018) 671, arXiv:1803.07943 [hep-ph].