Traction chain networks: Insights beyond force chain networks for non-spherical particle systems
Abstract
Force chain networks are generally applied in granular materials to gain insight into inter-particle granular contact. For conservative spherical particle systems, i.e. frictionless and undamped, force chains are information complete due to symmetries resulting from isotropy and constant curvature of a sphere. In fact, for conservative spherical particle systems, given the geometry and material, the force chain network uniquely defines the contact state that includes elastic forces, penetration distance, overlap volume, contact areas and contact pressures in a particle system. This is, however, not the case for conservative non-spherical particle systems. The reason is that a force chain network is not sufficient to uniquely define the contact state in a conservative non-spherical particle system. Additional information is required to define the contact state of non-spherical granular systems. Traction chain networks are proposed to complement force chain networks for the improved quantification of the state of contact of a granular system.
1Department of Mechanical and Aeronautical Engineering, University of Pretoria, South Africa.
E-mail: nico.wilke@up.ac.za
1 Introduction
Particles under dynamical loading continuously experience a change in forces and accelerations to which the particles are subjected, while in static particle systems, these loadings remain fixed. Particle systems are loaded as the result of body forces and surface tractions. The result is a complex response of particles spatially and temporally that manifest as flow, transitional and solid response over space and through time.
The distinction between body forces and surface tractions differentiates between loadings that act at each point in a body, i.e. body forces, from loadings that only act only on the surface of a particle, i.e. surface tractions. Gravity and inertial forces represent body forces, while pseudo body forces described by non-inertial reference frames include centrifugal, Euler and Coriolis forces. In turn, surface tractions are due to interactions between particles and the environment that may include geometrical objects or fluids and between particles. Surface tractions resulting from direct contact between particles include normal contact, sliding contact due to friction, interlocking for non-convex systems [1, 2, 3], short-range cohesive and adhesive interactions.
Spherical particle contact has been studied for a variety of cases. These include the classical frictionless and small strain solution of Hertz [4], friction and adhesive (e.g. van der Waals) forces with the work of Johnson, Kendall and Roberts (JKR) that generalised Hertz’ solution for elastic spheres [5]. Although contact between spheres is well understood, spherical particle systems exhibit complex behaviour [6].
Force chain networks form an integral component to study and quantify the resulting complex behaviour [7]. They are heterogeneous structures that are ubiquitous in granular material research as they quantify aspects of load, acoustic and thermal paths through granular materials. Force chain networks quantify contact forces between interacting particles, distinct from stress networks that quantify the distribution of the average particle stresses in granular media [8]. Ironically, despite the prevalence of force chain networks, there is no agreement on a quantitative description of force chains, numerous approaches having been proposed as outlined by [9]. Despite this force chain networks aim to quantify the network of contact forces between particles.
Experimental attempts to visualise force chain networks include photoelasticity, acoustically [9], thermal conduction [10] and electrical conduction [11]. In particular, isochromatic photoelasticity visualises differences in principal stress directions. Acoustic transmission paths highlight paths with matched contact impendence. Thermal conduction visualises thermal transmission paths that mainly depend on the effective contact area. Electrical conduction paths are observed after an initial insulating state changes to conducting state when the DC Branly threshold is exceeded. Physical transmission paths are highly correlated with interparticle contact forces for spherical particle systems. This stems from the fact that the state of inter-particle contact is completely and uniquely defined by a force chain network for a conservative spherical particle system.
However, even for conservative non-spherical particle systems, this is not the case. Physical transmission paths require additional information to uniquely define the contact state of force and pressure. As a result, force chain networks give only a partial view of the state of a network. Further, non-spherical particle contact is much less understood. Contact between angular particles may result in localised tractions, e.g. near-point contact or near edge contacts or distribute over an entire face that may result in the same contact forces but yield distinct surface tractions. Additional complex surface tractions may result from interactions with the environment, fluids and gases, as shown in Figure 1, for fluid modelled using smoothed-particle hydrodynamics (SPH) interacting with cuboid particles [12].

This paper extends the notion of informative networks beyond inter-particle contact forces to also consider inter-particle contact tractions. This subtle but critical distinction is particularly important when considering contact between non-spherical particles. Inter-particle contact tractions complement force chain networks to provide a complete picture of particle interactions and mechanisms that may contribute to define the contact state that may help define damage and failure. Thus, in addition to contact forces, contact tractions offer key insights required to evolve our understanding and study of non-spherical particle interactions, degradation and ultimately breakage. The first step towards this larger study is to quantify and visualise traction chain networks and force chain networks, which is the focus of this study.
This paper outlines the required background knowledge on contact mechanics, macroscopic resultants and tractions in Section 2, followed by a compact outline of force and traction chain networks in Section 3. Next, force and traction chains for spherical particle systems are explored in Section 4.1. This is followed by force and traction chains for polyhedral particle systems in Section 4.2. Non-spherical particle systems considered in this study is limited to polyhedral particle systems without the loss of generality. Finally, conclusions and future work are offered in Section 5.
2 Background
2.1 Spherical contact mechanics
2.1.1 Hertz-Mindlin model
Consider the classical solution for non-adhesive frictionless elastic contact between two spheres, and , with radii and is equated with contacting between a sphere with effective radius computed from
| (1) |
and a half-space or plane. The radius of the contact area, , between an elastic sphere with effective radius that penetrates a half-space or plane by a distance, , is given by
| (2) |
with contact Area, , being linearly related to the penetration distance, , following
| (3) |
In turn, the applied force is related to the penetration distance, , by
| (4) |
with effective Young’s modulus
| (5) |
computed from the individual Young’s modulus of the sphere (subscript ) and plane (subscript ). The radial variation in contact pressure is expressed by
| (6) |
where the maximum pressure is given by
| (7) |
The radius of the contact area is related to the applied load by
| (8) |
Consequently, the penetration distance is related to the maximum contact pressure by
| (9) |
The contact volume overlap is given by
| (10) |
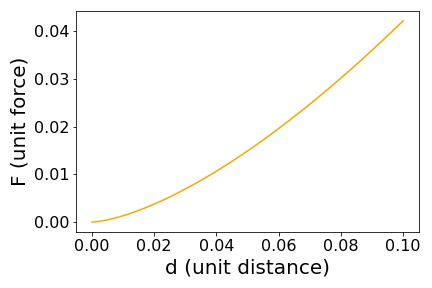
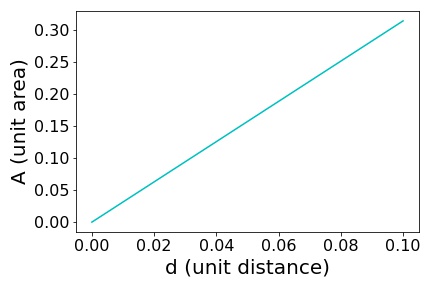
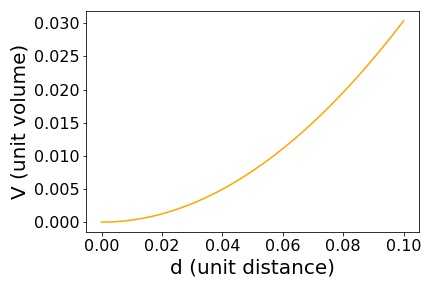
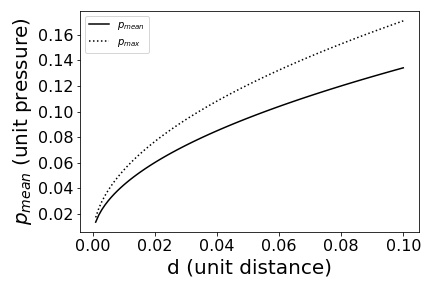
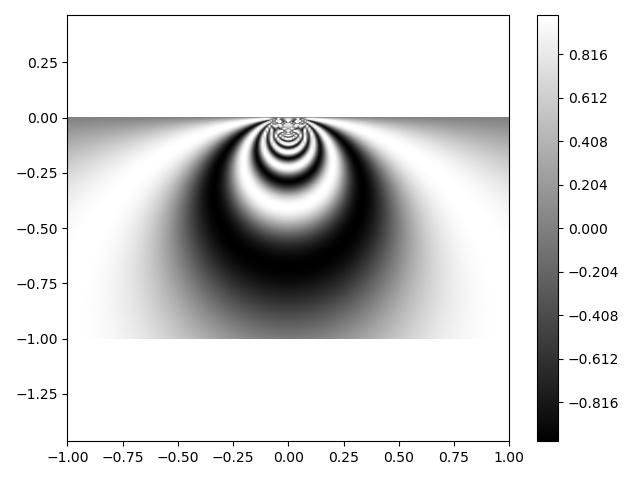
For a Poission’s ratio of the maximum shear stress occurs at Figure 2 show the contact force, contact area, contact volume and mean pressure relationships w.r.t. a penetration distance of up to a 10% between a frictionless sphere and an infinite plate (left), and the maxmimum shear stress cosine distribution inside the infinite plate. Consequently, , , and , indicating that uniquely defines the state of , , and .
For circular grains subject to NC contacts, the stress tensor [8] is estimated from
| (11) |
with l the branch vector of particles in contact and F the contact forces between particles.
Hence, for conservative contact, i.e. frictionless and undamped contact we find that , , V, and are only a function penetration distance given the material properties and radii. As a result force chains are informative and fundamental to quantifying spherical contact mechanics.
2.1.2 Linear-spring dashpot model
The normal and tangential forces are often modelled by a linear-spring dashpot (LSD) model [13]. Consider two particles in contact, particle and (indicated as subscripts with variables). Their center of mass (COM) positions are given by and and the contact points relative to the COMs represented by and . The linear and angular velocities are given by and ; and and , for the two particles, respectively. The relative velocity at the contact points is given . The unit vectors and define the normal and tangential directions. This allows for the decomposition of the velocity into normal and tangential components given by and . The normal and tangential forces between the two particles are computed by summing the spring (s) and dashpot (d) contributions in the normal and tangential directions
| (12) |
| (13) |
Given the overlap distance, in the normal and, in the tangential directions, we obtain
| (14) |
| (15) |
for normal and tangential spring stiffness’s and Consequently, the magnitude of the normal force is given by
| (16) |
Recall, the contact radius is given by , which combined with the former, gives
| (17) |
As a result, the is constant, which is a direct consequence of the linear spring model. Hence, when employing a LSD model, we expect to recover a constant traction magnitude irrespective of the penetration distance when damping is inactive, and friction ignored.
2.2 Polyhedral contact mechanics
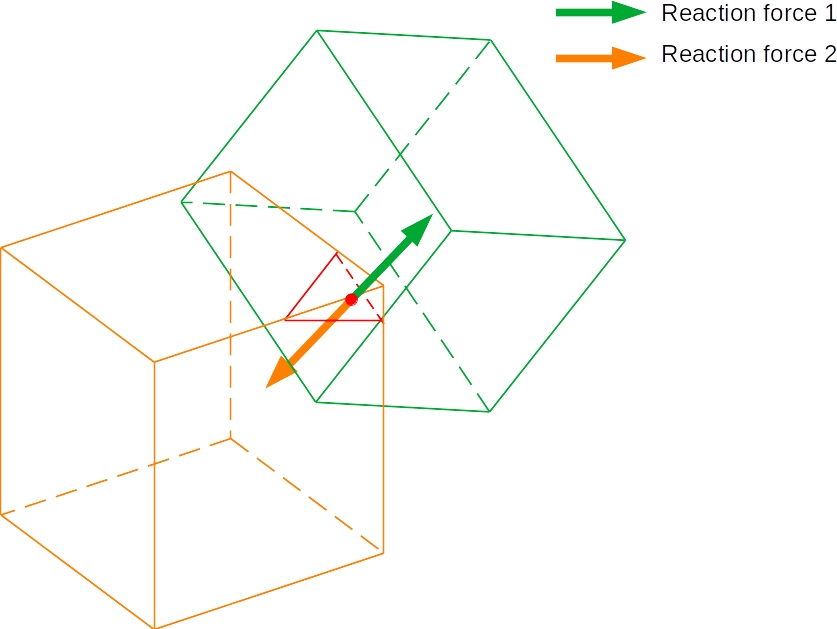
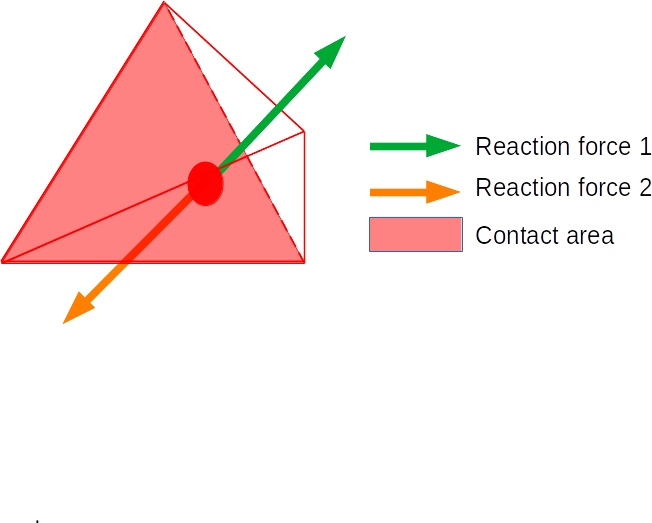
Non-adhesive frictionless elastic contact between two polyhedra is visualised in Figure 3. The overlap volume uniquely resolves the contact force directions. It avails information to estimate the contact force magnitude, which can be expressed as a function of , penetration distanced , surface area and volume Commercial and research DEM codes mostly resolve force magnitude as some function of penetration distance (as used by Rocky [14]) or overlap volume [3, 15]. The former offers computational advantages, while the latter offers continuity and stability.

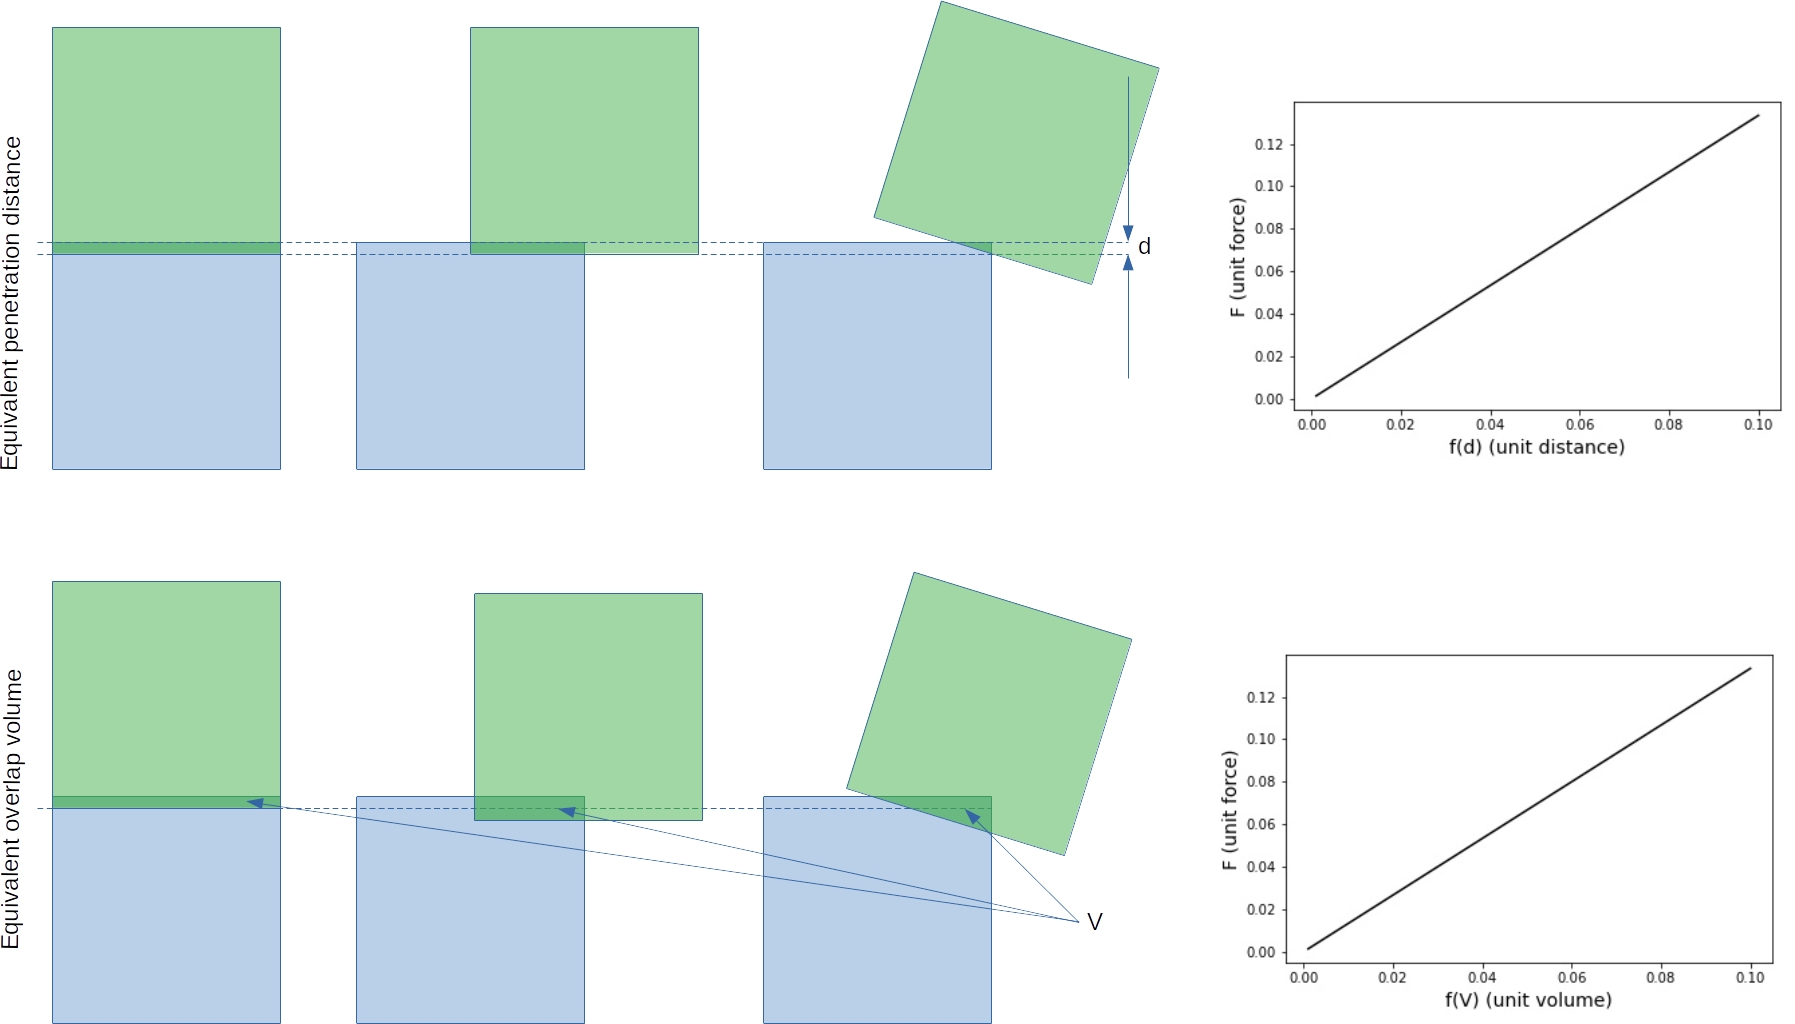
For visual clarity, the main ideas are developed around two-dimensional polyhedral particle representations. This is done without loss of generalisation as they also represent three-dimensional prisms in the out of page direction. For example, consider the two-dimensional visualisation of several polyhedral contact scenarios and force magnitude computations depicted in Figure 4. The top row represents contact laws that scale contact force magnitude only with penetration distance, and the bottom row represents contact laws that scale only with overlap volume [15].
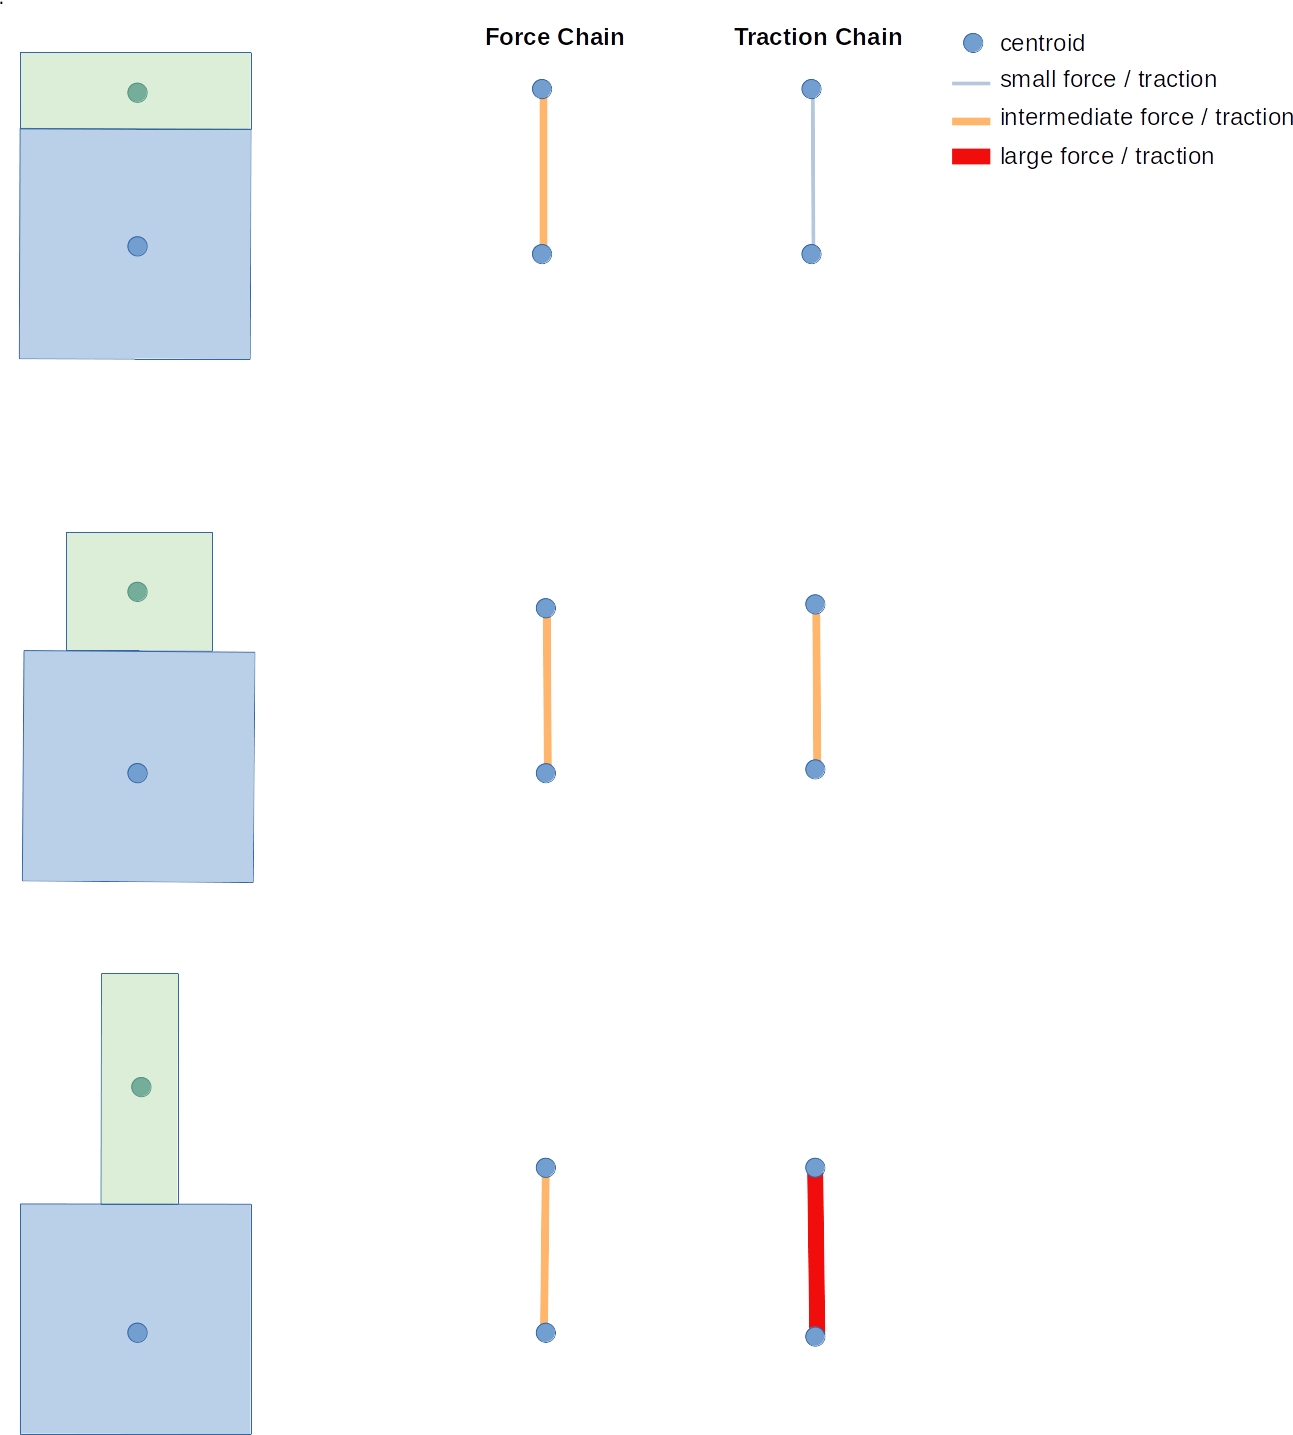
It is important to note that the computed contact force magnitude and contact force direction is the same for all three scenarios. However, the maximum or average pressure is distinct for the three scenarios. The left-most has the lowest average contact pressure and the highest average contact pressure for the right-most configurations. As a result, the contact force , contact area , and contact volume are not uniquely related by the penetration distance as with contact between spherical particles.
Therefore, polyhedral and other non-spherical particle contacts require a fundamental rethinking of the role of force chains as the only approach to quantify and visualise inter-particle contact.
2.3 Force and moment resultants and traction vectors
Computational mechanics defines the resultant surface forces, moments and torsions to result from tractions acting through surfaces [16]. For example, consider the finite surface defined by the unit outward normal with area presented in Figure 5. The unit normal is expressed in the indicated global coordinate system. Through the surface acts a spatially varying traction vector (force per unit area). The three resultant forces acting on the surface due to the traction vector are given by
the two resultant bending moments are computed from
and the resultant torsion defined by
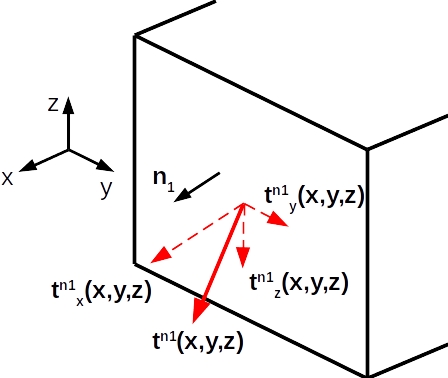
The average traction vector due to load acting over the finite surface defined by outward unit normal with surface area can be estimated from
| (18) |
Hence, the traction indicates the intensity of the force acting over the surface as it has units of force per unit area. For surfaces defined by normals parallel to the global coordinate system, the tractions are proportional to the stress components of the stress tensor. As a result, the stresses acting on the surfaces can readily be derived from the traction vector.
Note the fundamental role that the area plays in estimating surface tractions. In contrast, proposed estimates of the particle stress tensor [8], are often independent of the area on which contact forces act.
3 Force and traction chain networks
Force chain networks offer insight into contact mechanics that are informative for spherical particle systems. We show that non-spherical particle systems require complementary networks to get a more informative assessment of contact mechanics.
This study proposes the traction chain network to be considered iand force chain networks to quantify inter-particle contact in particle systems. Force chain networks and mean particle stress networks offer complementary viewpoints in particle system interactions. Traction chain networks complement these networks to highlight surface traction magnitudes in a particle system. This enables the differentiation between distinct scenarios that may otherwise seem equivalent, as shown in Figure 6. For example, consider three scenarios of binary particle systems of equal mass cuboids. The force chain network is unable to differentiate between the three scenarios shown. In turn, the traction chain network offers a complementary view of contact in the network, clearly showing higher pressure in the bottom scenario of Figure 6, as opposed to the middle or top scenarios. Differentiating between these scenarios is key when considering and quantifying particle damage and degradation.
Particles experience forces due to particles contacting each other within a particle system, as shown in Figure 7 for spherical (left) and cubic (right) particle systems, with each system containing around 1150 particles.
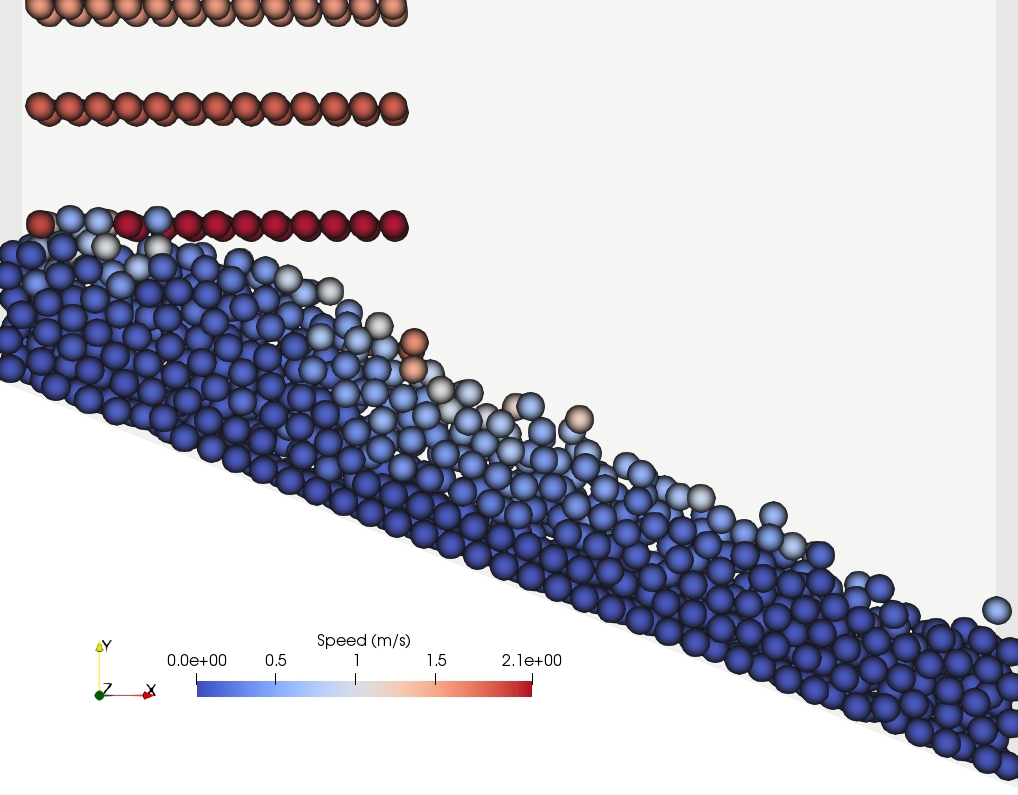
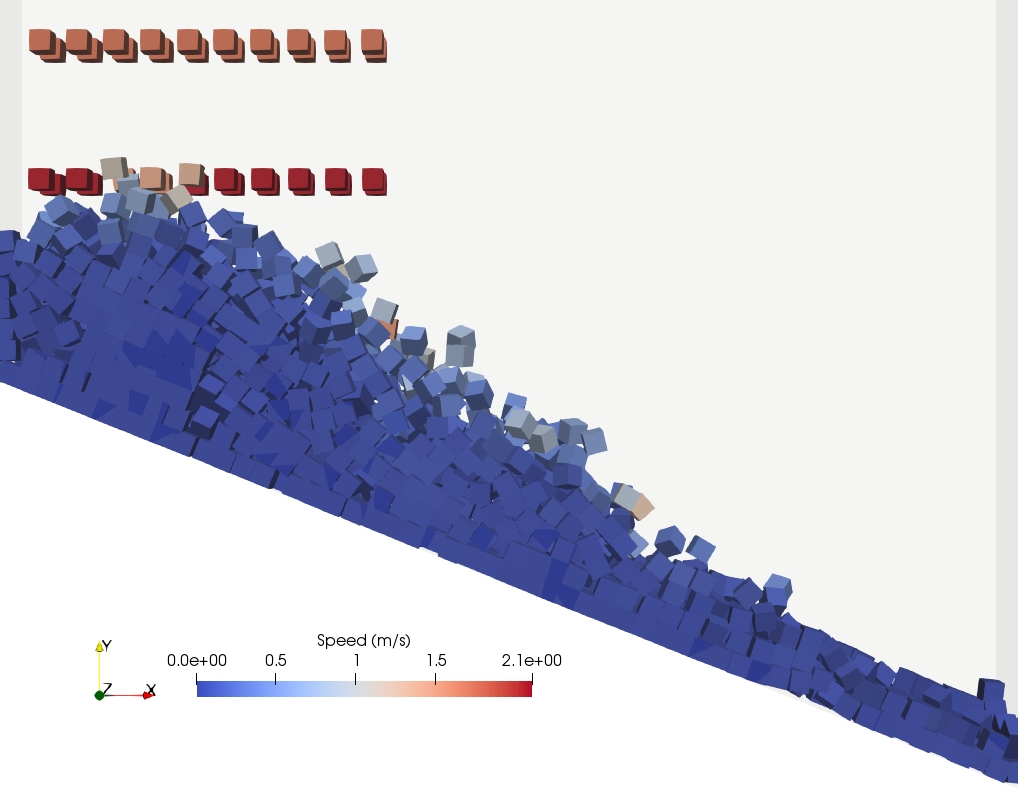
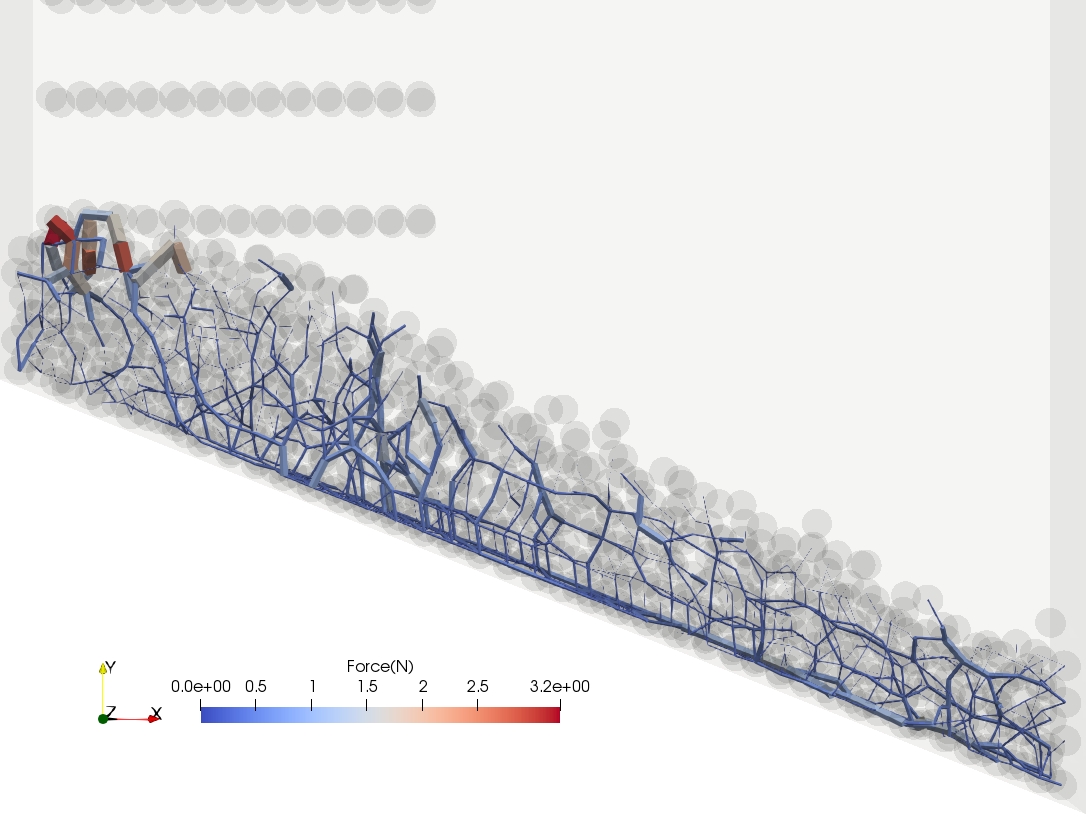
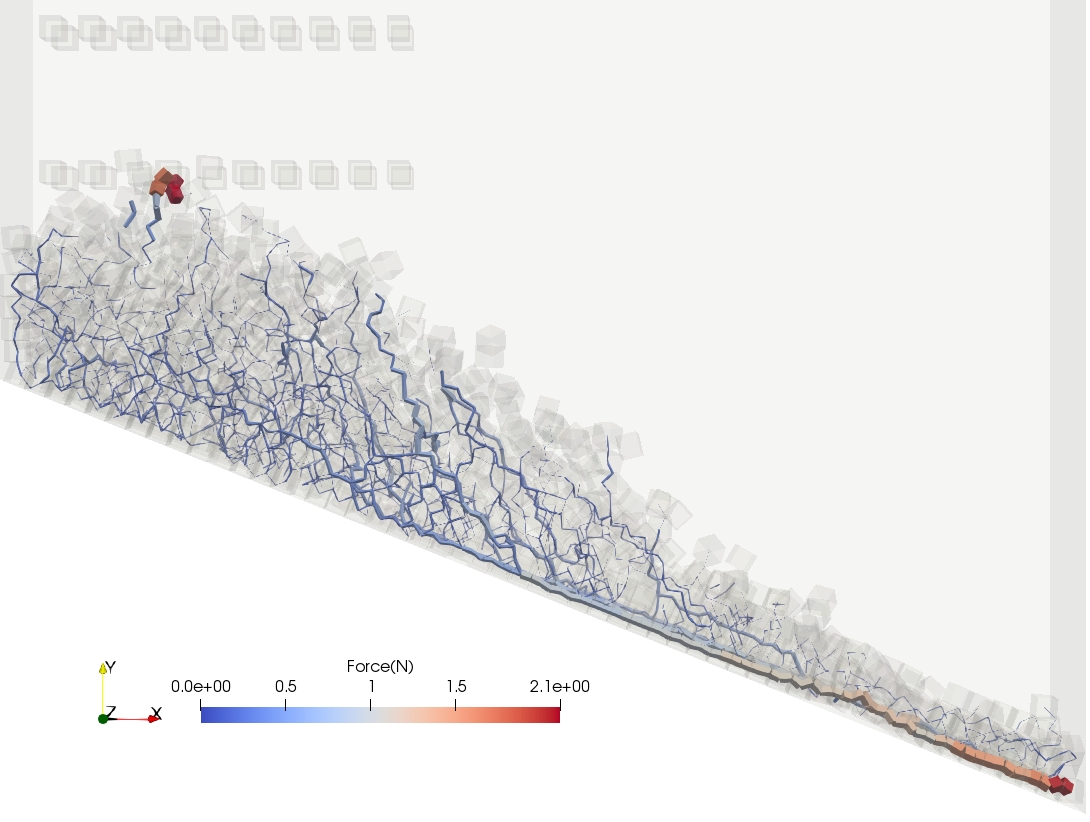
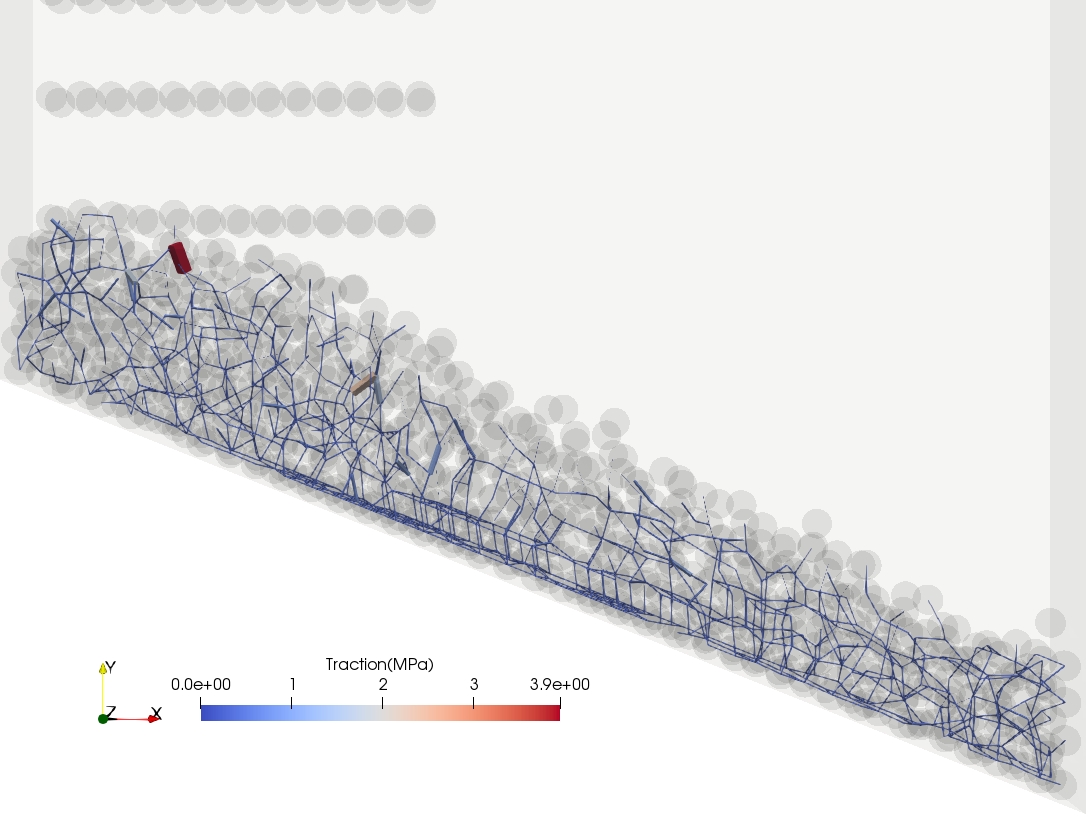
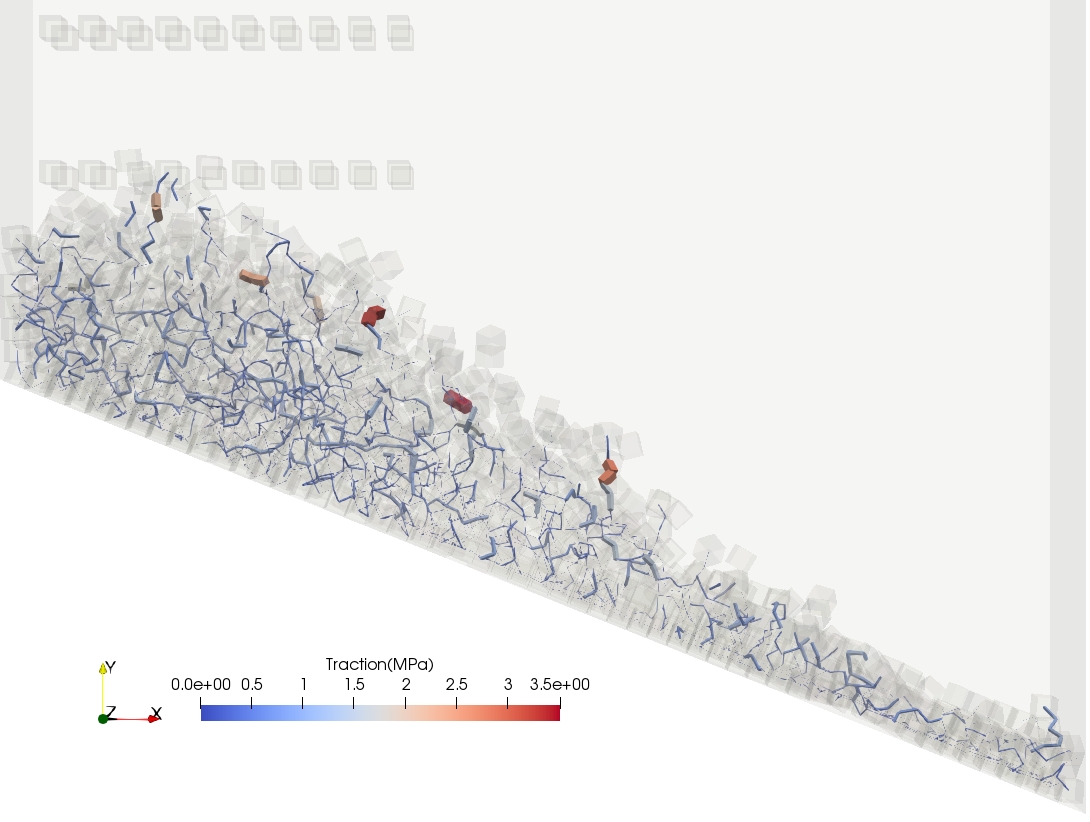
Body forces load the particles resulting in interactions with the environment and each other. Particles are often subject to multiple surface tractions due to inter-particle contact. Several approaches have been proposed to compute force chains. These include a quasi-linear approach proposed by [17] followed by [18]. Figure 7 visualises the force and traction chain networks representing the force magnitude between particle centroids and the contact volume centroid.
For spherical particle systems, a force chain network is informative. However, a traction chain network provides additional information to complement a force chain network when non-conservative systems (frictional and dissipative particle systems) are considered.
For conservative particle systems (no friction and undamped), contact pressures, contact tractions, contact forces, contact volumes, contact areas and penetration depth can be derived from a single force chain network, as shown in Section 4.1. In particular, we expect traction chain networks to be constant for spherical particle systems when considering contact laws that scale linearly with penetration distance as with the LSD.
All DEM simulations in this study were conducted using the LSD model that includes sliding friction.
4 Numerical Results
We first consider force and traction chain networks for spherical particle systems with and without friction and damping in Section 4.1. This is followed by a systematic breakdown of force and traction chain networks for polyhedral particle systems in Section 4.2. Three foundational example problems that isolate and demonstrate the differences between force chain and traction chain networks are considered in Section 4.2.1. Naturally, these foundational example problems can serve as unit tests for discrete element codes and postprocessing scripts. This followed by a septenary particle stacking that highlights differences between force chain and traction chain networks for a slightly larger system. Lastly, we conclude with a 2000 particle system to highlight the complementary nature of force and traction chain networks.
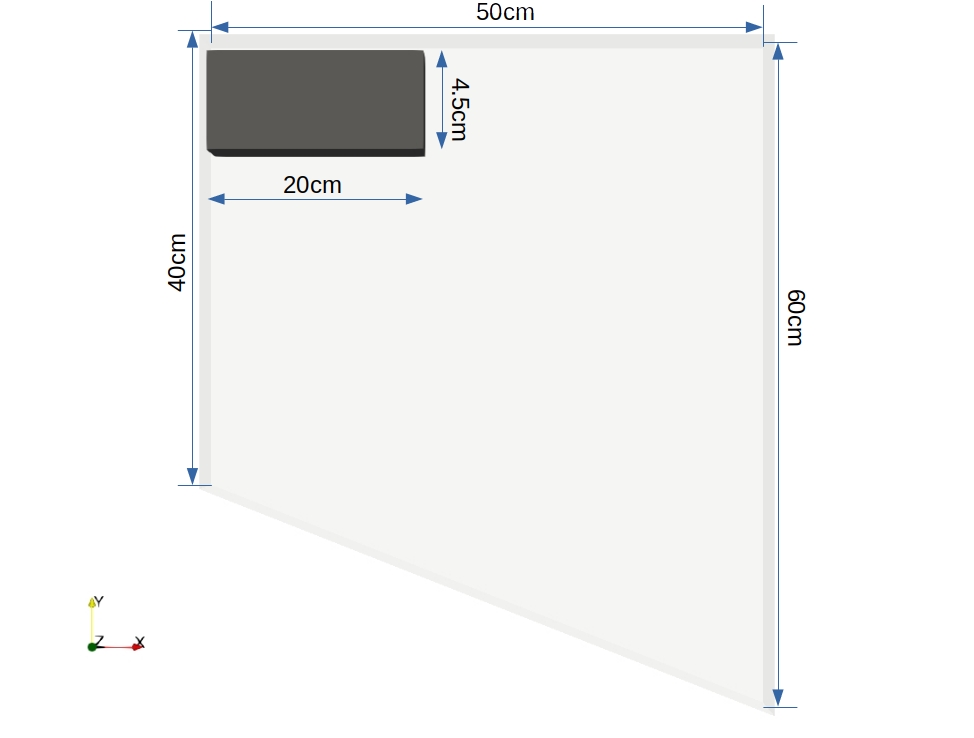
The geometry of the primary setup is given in planar view as depicted in Figure 8. The out of page dimension of the container is 5 cm. The particle inlet is indicated in dark grey. The particles are deposited with a -0.5 m/s vertical velocity. The particle-wall static and kinetic coefficients of friction are 1.0, the coefficient of restitution is 0.01. For spherical particle systems, the particle-wall normal stiffness and tangential stiffnesses are 5000 of 2500 , respectively. For polyhedral particle systems, the particle-wall normal stiffness and tangential stiffnesses are 5000 of 2500 , respectively. The particle-wall rolling damping 0.01.
The particle-particle kinetic coefficients of friction are 0.0 or 1.0 for the frictionless and frictional cases. The particle-particle coefficient of restitution is 0.01 and 1.0 for the damped and undamped cases. For spherical particle systems, the particle-wall normal stiffness and tangential stiffnesses are 5000 and 2500 , respectively. For polyhedral particle systems, the particle-particle normal and tangential stiffnesses are 5000 and 2500 , respectively. The particle-particle rolling damping is 0.001.
In this study, all simulations are subject to a conservative gravitational field of -9.81 m/s2 in the y-direction of indicated reference frames. Slide box simulations conducted with spherical particles have diameter 14 mm, cube particles have side lenghts 10 mm having a density of 2000 . The spherical and cubic particle systems each contain around 1150 particles, which is after 1s and 2s of simulation time, respectively.
All simulations are conducted using the BlazeDEM-GPU framework [19]. The BlazeDEM-GPU framework was developed in consortium with the University of Pretoria, South Africa and the Council for Scientific and Industrial Research (CSIR), South Africa. The project received significant financial, experimental and human capital support from IMT Lille Douai, France enabled upscaling to industrial-scale research using BlazeDEM-GPU [20, 21, 19, 22]. Govender is the primary developer of BlazeDEM-GPU, and continually extending the software’s capabilities to expand application domains [23, 24, 25]. Development contributions to BlazeDEM-GPU include the extension of the broad-phase grid-based spatial partitioning to the boundary-volume hierarchy (BVH) by Lubbe et al. [26, 27]. BlazeDEM-GPU, initially considered penetration distance to resolve particle-particle contact [20, 21, 28, 19]. However, this resulted in instabilities in determining contact directions [19, 2, 3]. Wilke et al. [1] proposed an efficient GPU-based volume contact algorithm that enabled the extension from convex to non-convex polyhedra with stable directions. This allowed for stable contact resolution of convex and non-convex particles in BlazeDEM-GPU using polyhedral volume overlap [1, 29]. Recent, multi-physics extensions include DEM coupling with gradient corrected SPH by Joubert et al. [12].
In this study, all force chain networks depict the total contact force magnitude, and all traction networks are computed using the total contact force magnitude. Additional insights can be gained when decomposing the total contact forces and tractions into their respective normal and tangential components.
4.1 Spherical particle contact
In the simulations that follow interactions between particles and the container boundary are non-conservative, i.e. friction and damping are present using the model parameters outlined in Section 4. All simulations represent 1s of simulation time which equates to around 1150 particles having been introduced into the system.
4.1.1 Conservative contact
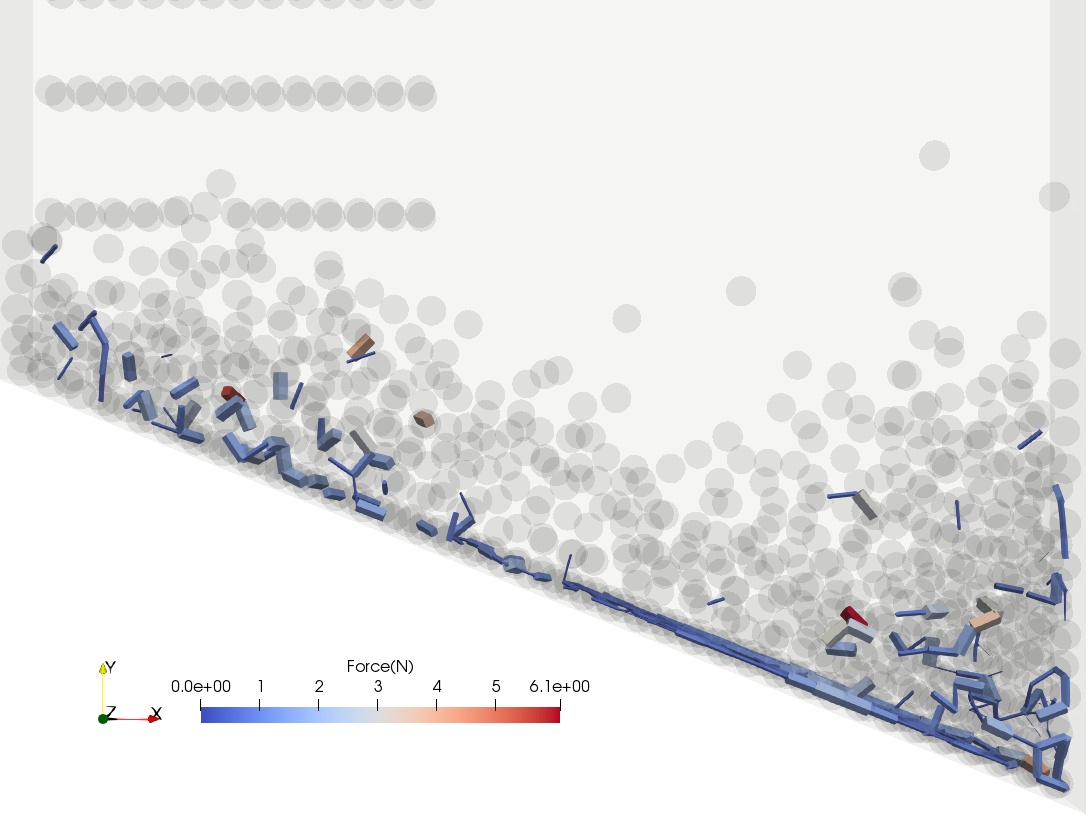
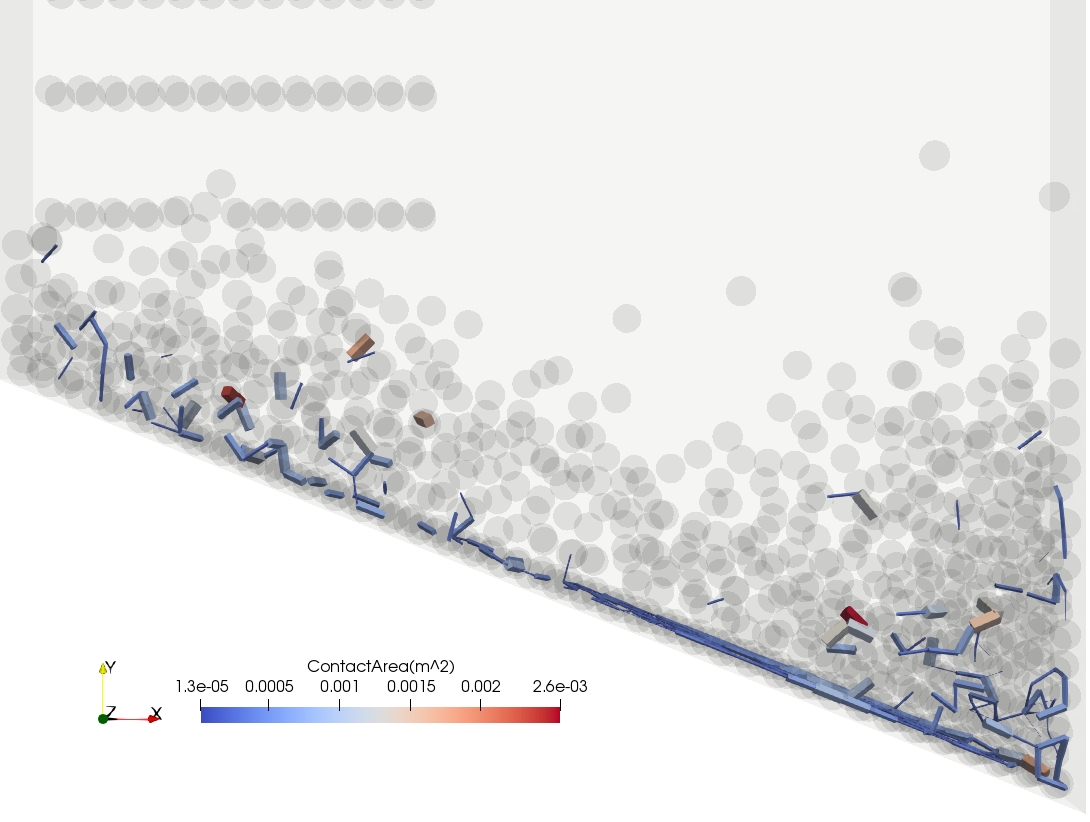
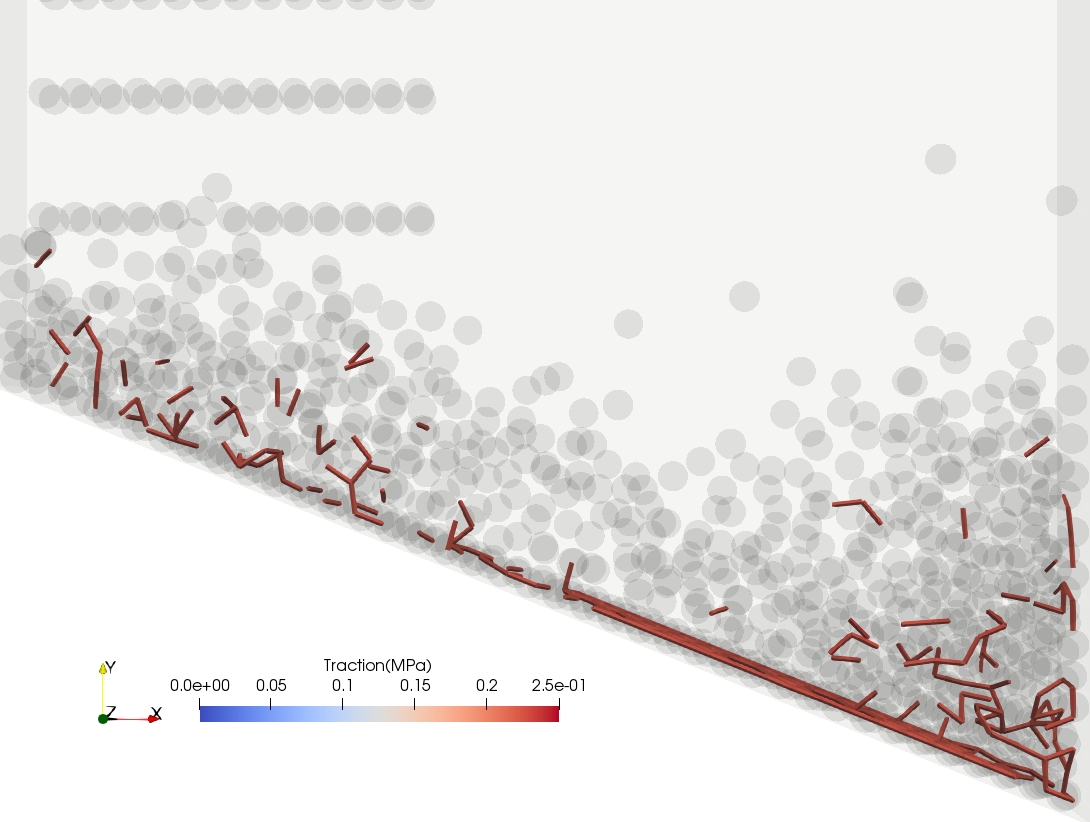
Consider three information networks, force, contact area and traction depicted in Figure 9, for a conservative spherical particle system, i.e. for frictionless and undamped particle-particle contact. The force chain and area chain networks are merely scaled versions of the same information. The traction chain network is constant and adds no information beyond contributing the scalar value MPa, which is the result of using a linear spring contact model. The MPa equates to a normal spring stiffness of 5000 .
4.1.2 Damped frictionless contact
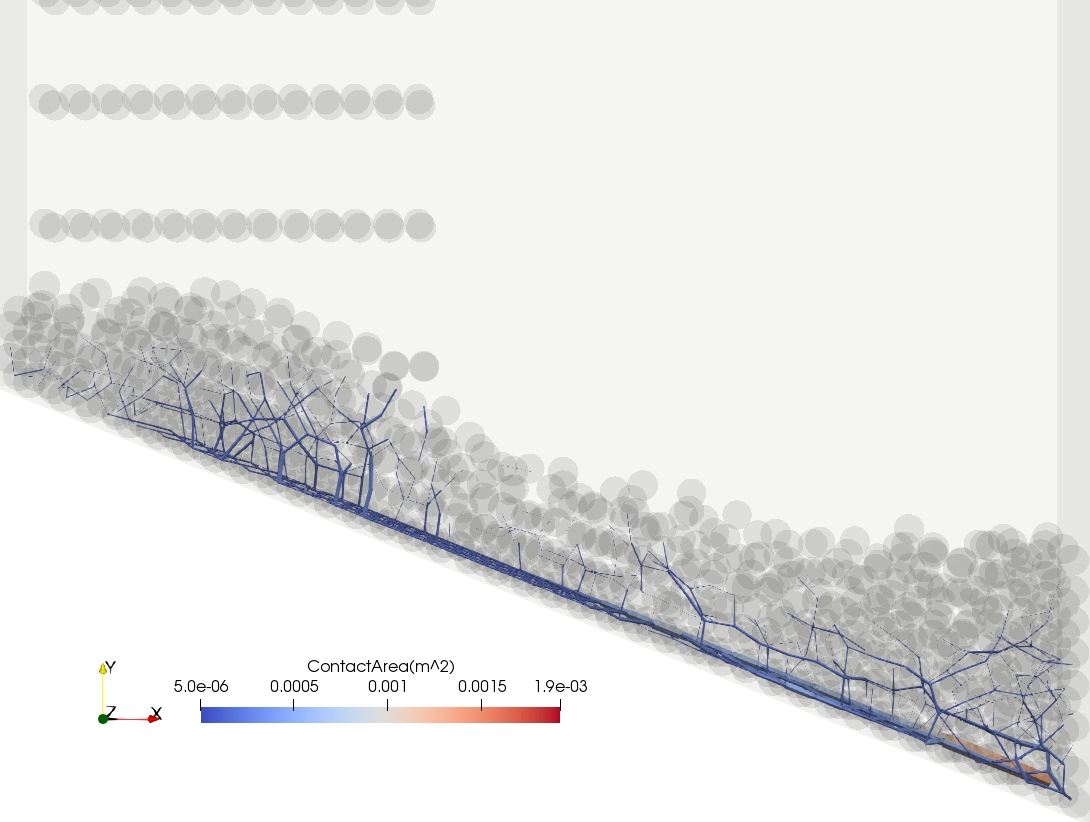
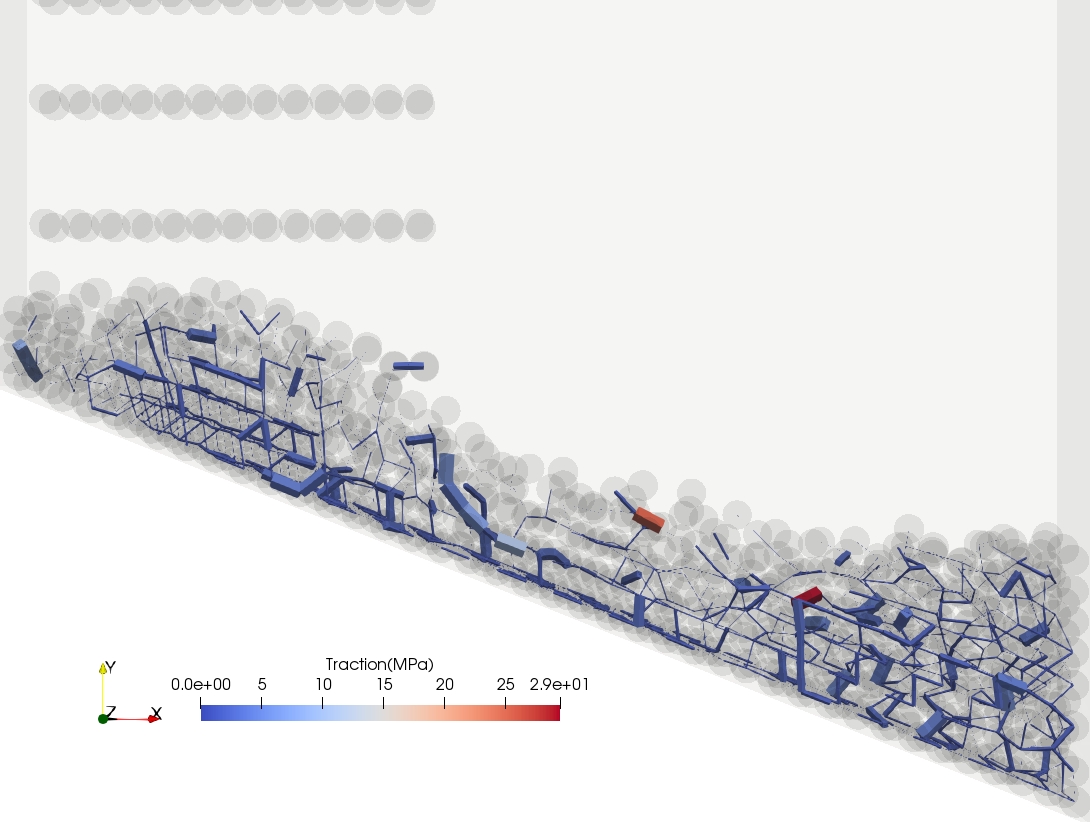
Next, consider three information networks, force, contact area and traction depicted in Figure 10, for a frictionless but damped particle-particle contact. Here, particle damping contributes additional forces that the particles experience, in addition to the linear spring. As a result, dynamic contact result in distinct tractions, whereas static contact is representative of a homogenous traction network. Overall, the force, contact area and traction chain networks are distinct. Differences in the traction network are now only the result of damping forces that are non-zero in dynamic contact between particles.

4.1.3 Undamped frictional contact
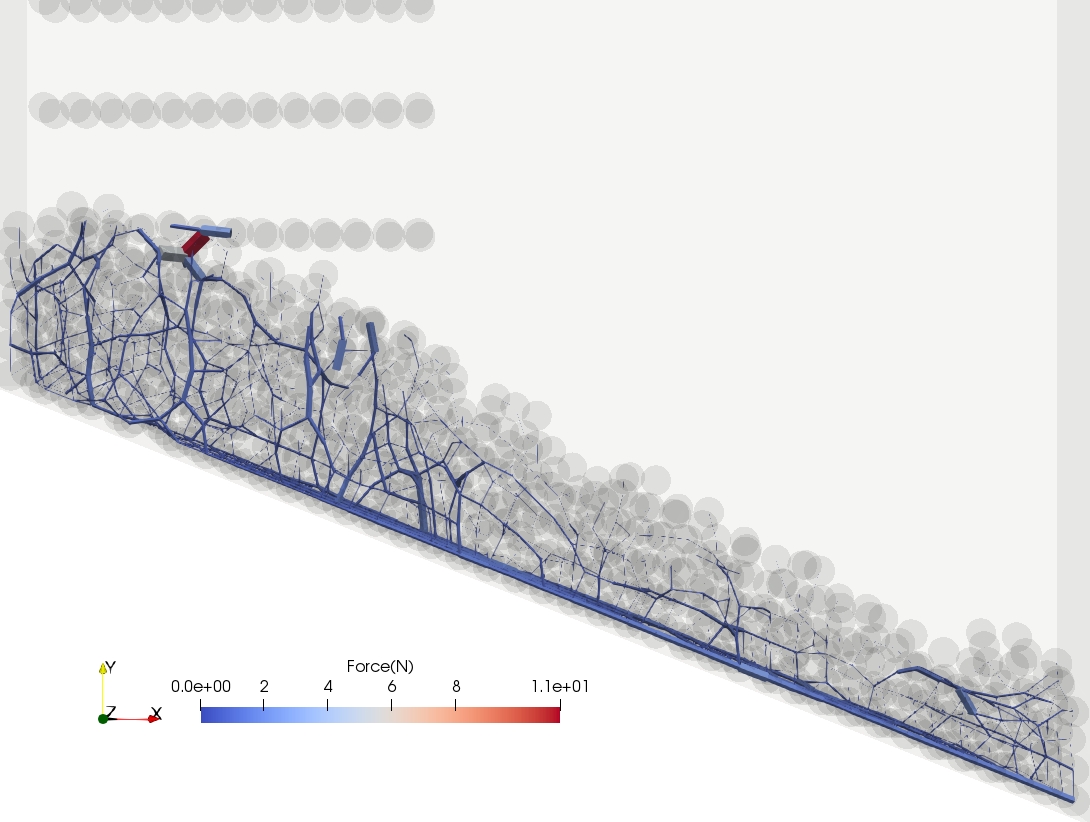
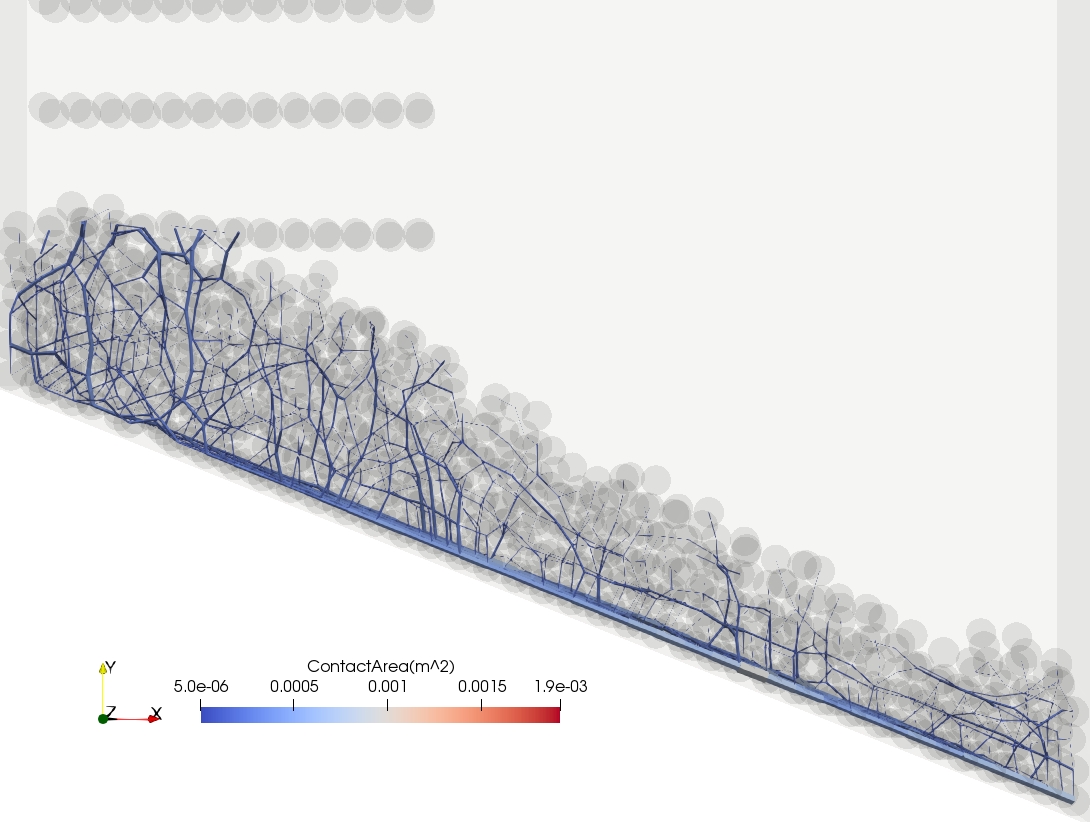
Consider now the three information networks, force, contact area and traction depicted in Figure 11, for undamped but frictional particle-particle contact. Here, particle-particle friction contributes additional forces that the particles experience, in addition to the linear spring. As a result, static and dynamic contact result in distinct tractions. Overall, the force, contact area and traction chain networks are distinct. Differences in the traction network are now only the result of frictional forces that are non-zero in both static and dynamic contact between particles.
4.1.4 Damped frictional contact
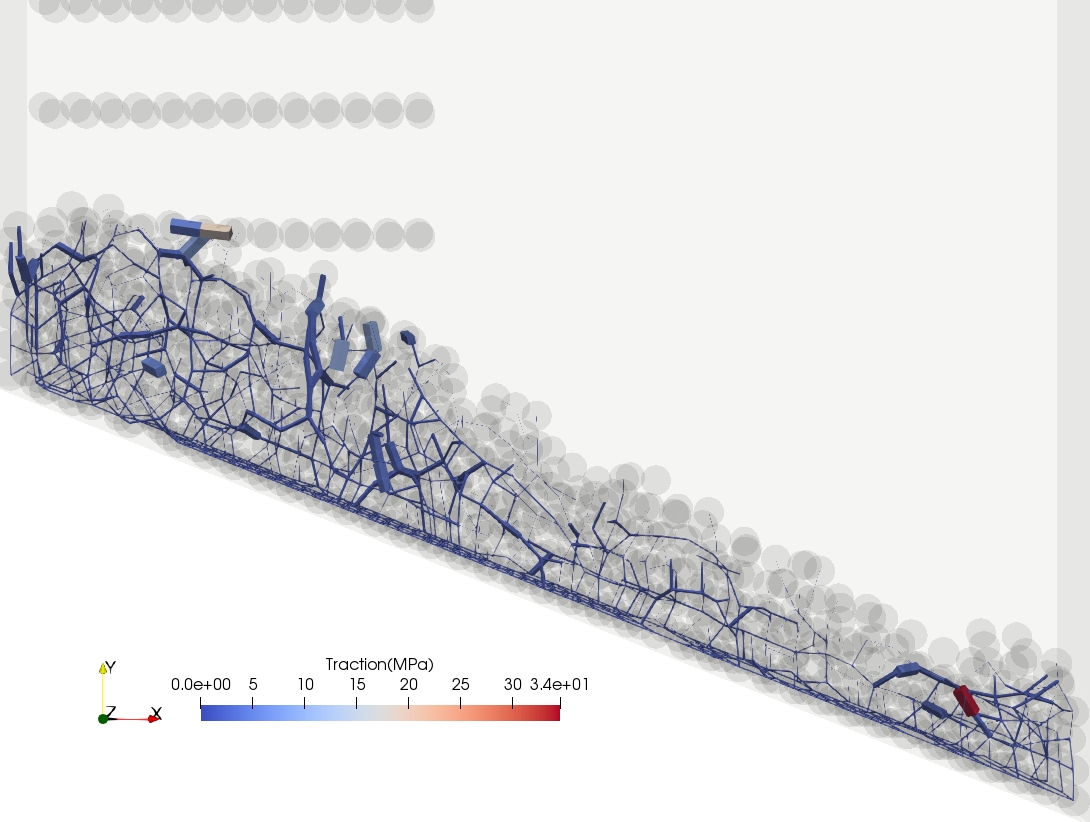
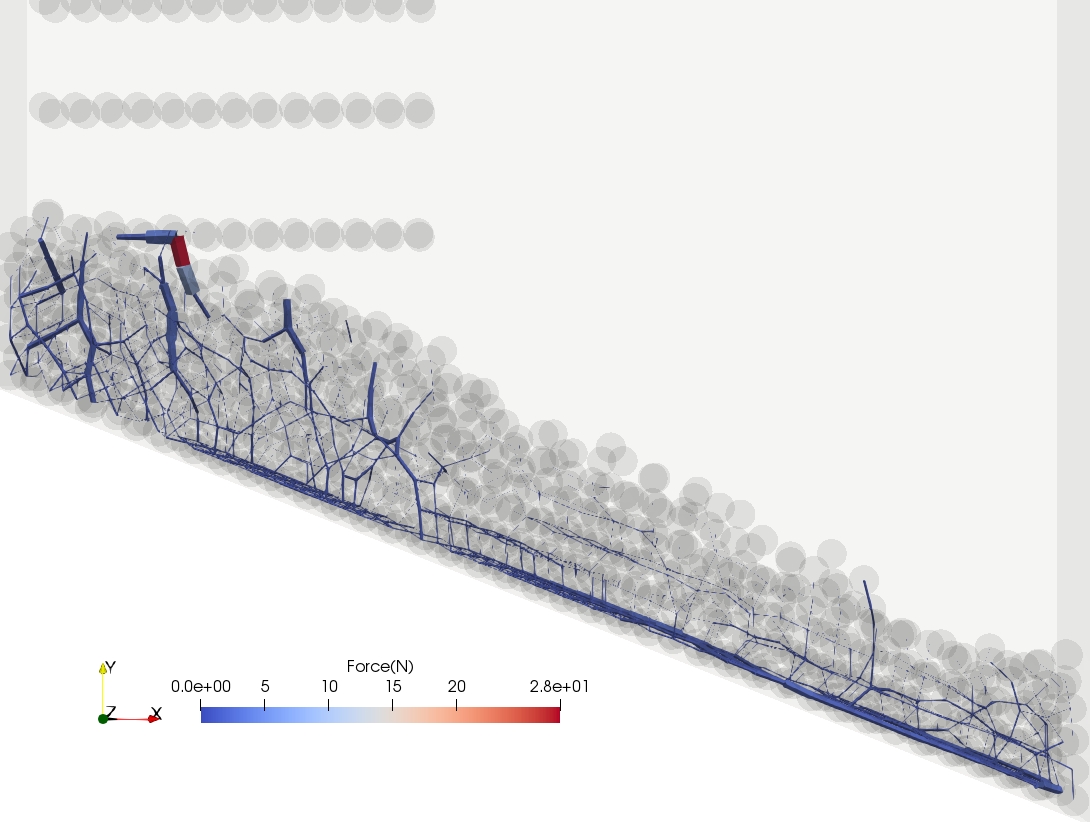
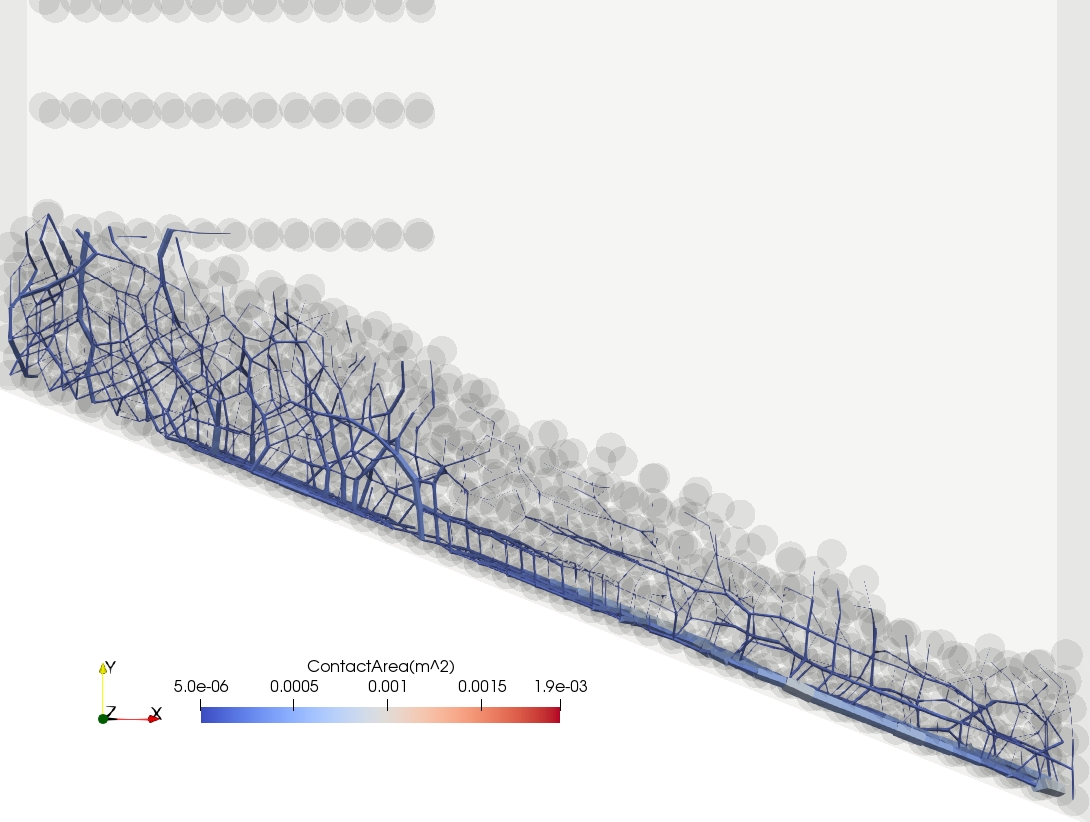
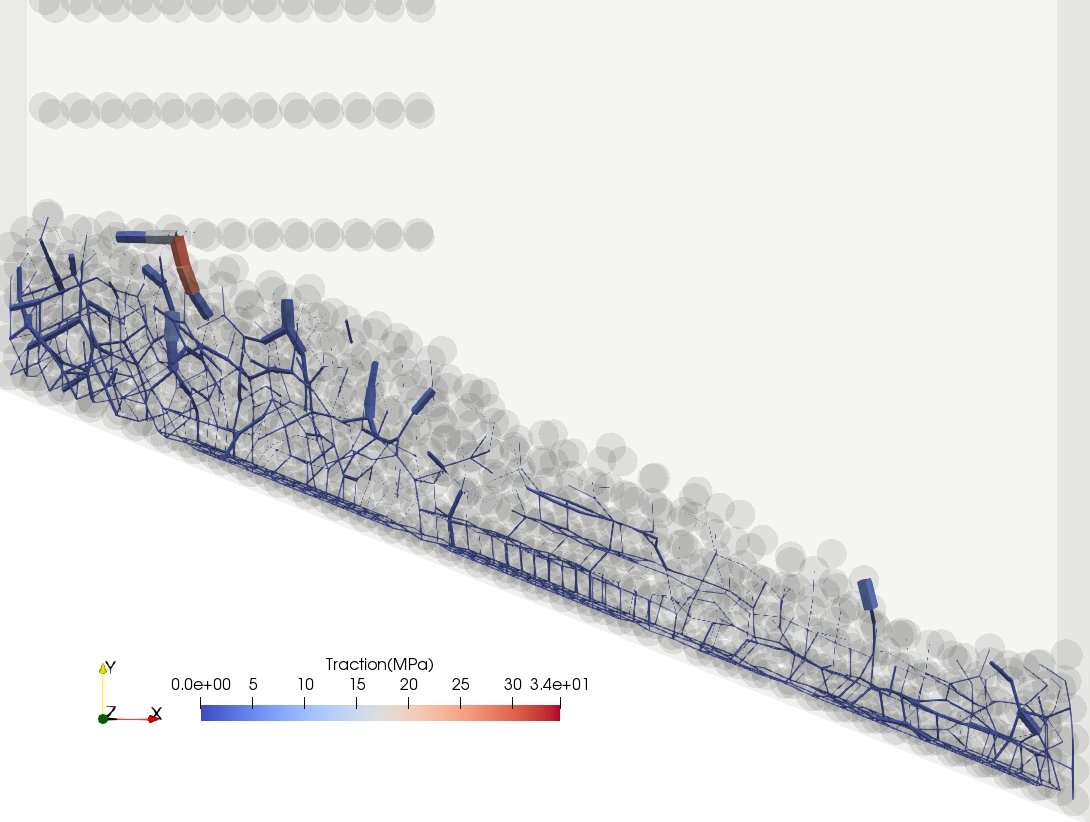
Consider now the three information networks, force, contact area and traction depicted in Figure 12, for damped and frictional particle-particle contact. Here, damping and particle-particle friction contributes additional forces that the particles experience, in addition to the linear spring. As a result, static and dynamic contact result in distinct tractions. Overall, the force, contact area and traction chain networks are distinct. Differences in the traction network are due to both frictional and damping forces that are non-zero in both static and dynamic contact between particles.
4.2 Polyhedral particle contact
4.2.1 Binary particle system
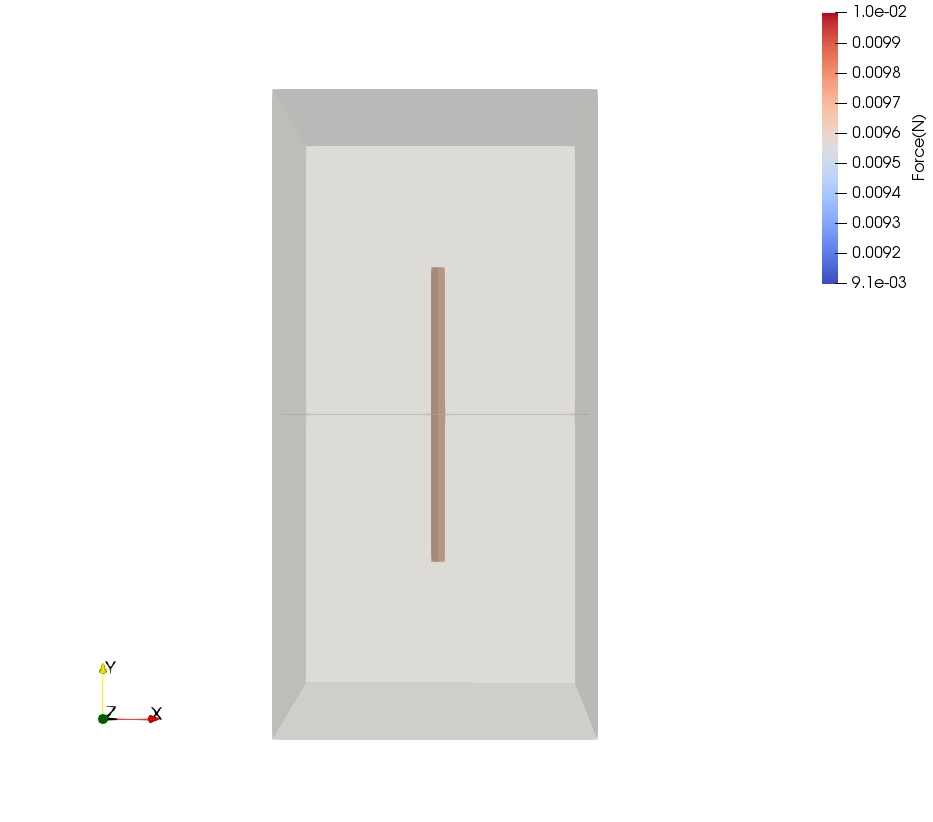
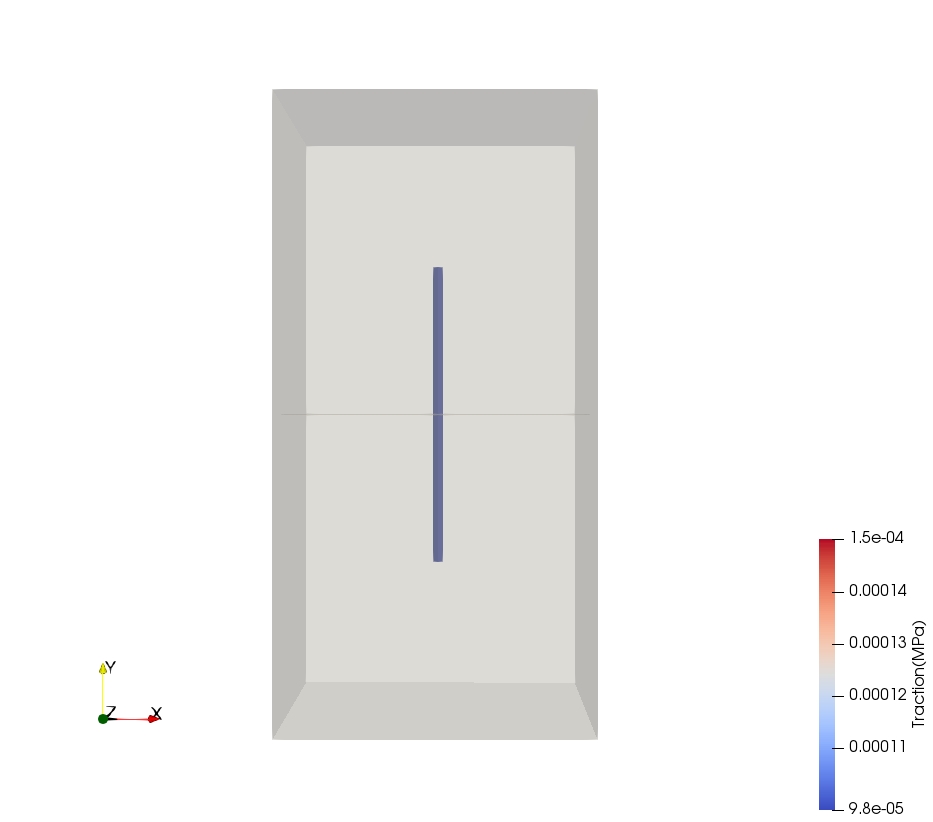
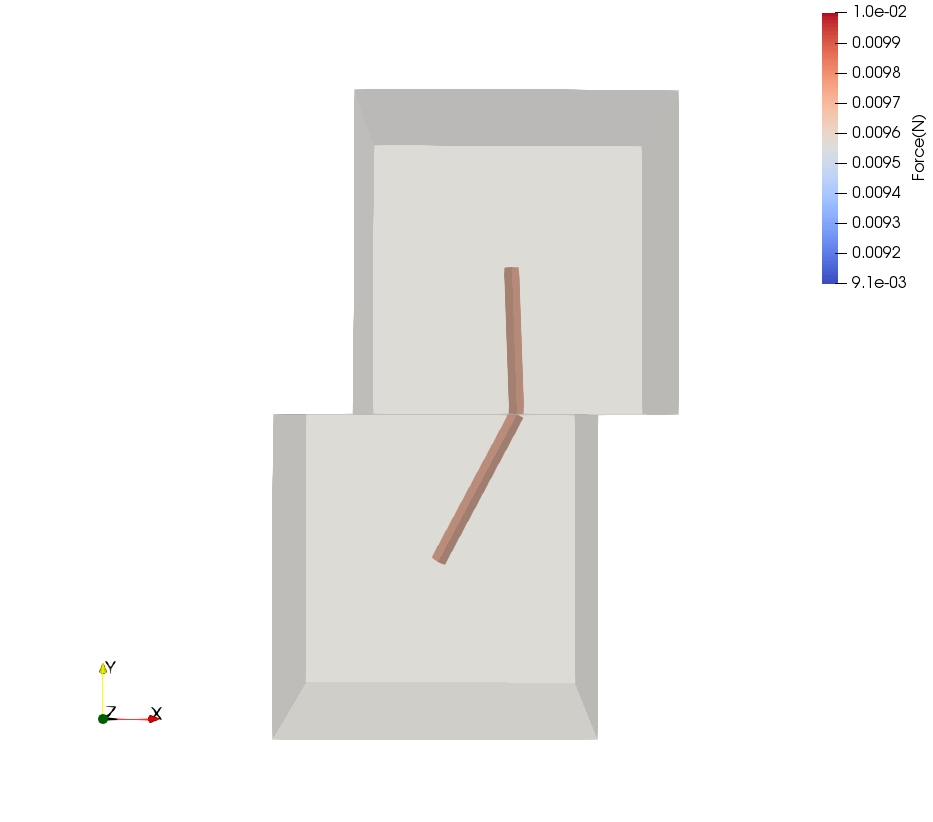
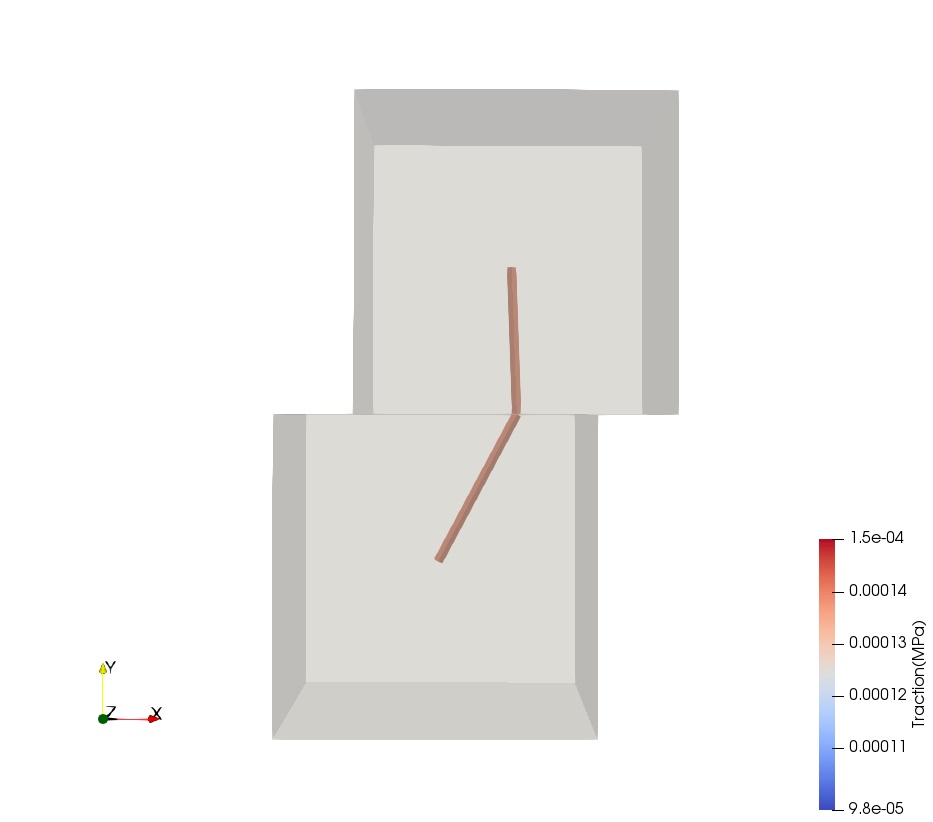
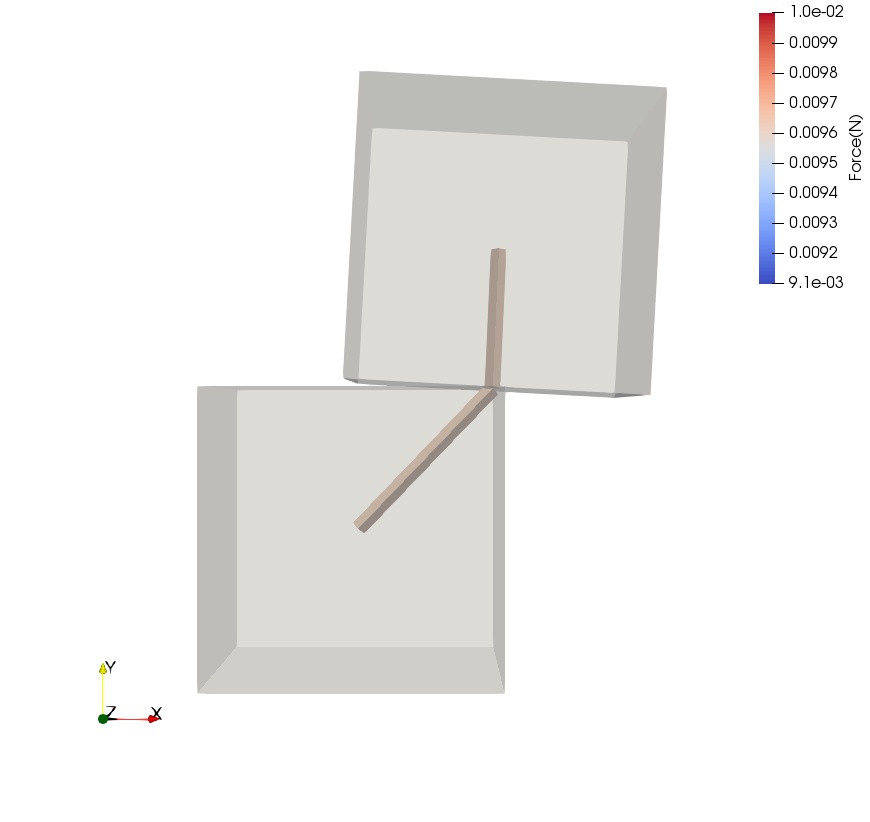
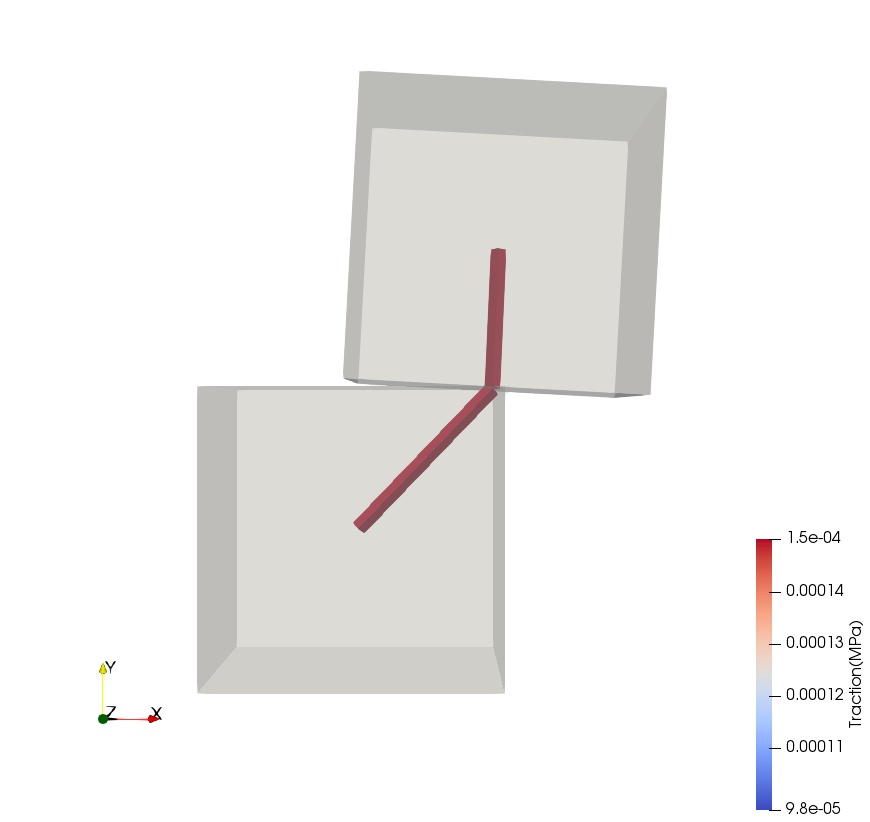
The cuboids and reference frames are shown in Figures 13-15. Each has a side length of 1 cm, a density of 1 g/cm3 subject to a conservative gravitational field of -9.81 m/s2 in the y-direction. Three stacking scenarios are considered, namely, a vertical stack (Figure 13), an overhang stack (Figure 14) and topple stack (Figure 15). The simulation were conducted with a time step of .
The particles are perfectly aligned for the vertical stack, while for the overhang stack, the top cube is shifted by 0.25cm. For the topple stack, the top cube is shifted by 0.5cm.
As a result, the quasi-static vertical reaction force magnitude is 0.00981N in all three scenarios. In turn, for the vertical stack, the average traction magnitude is 98.1 Pa (9.81MPa). For the overhang scenario, the average traction magnitude is 130.8 Pa (1.31MPa). It is above 196.2 Pa (1.96MPa) for the topple scenario as it varies with the resolved contact area, which in turn depends on the exact particle orientation and contact stiffness.
4.2.2 Septenary particle system
Next, we consider seven cubic aluminium particles weighing 3.375 N each, i,.e. a side length 50mm loaded into a 100mm by 100mm container from a height of 450mm. The particles are deposited with a -1 m/s vertical velocity subject to a conservative gravitational field of -9.81 m/s2 in the y-direction on the indicated reference frame in Figure 16.
The particle-wall static and kinetic coefficients of friction are 0.6, the coefficient of restitution is 0.4. The particle-wall normal stiffness and tangential stiffnesses are 5000 and 2500 , respectively. The particle-particle kinetic coefficients of friction are 0.0, the coefficient of restitution is 0.1. The normal stiffness is 5000 and the tangential stiffness is 2500 . The simulation were conducted with a time step of .
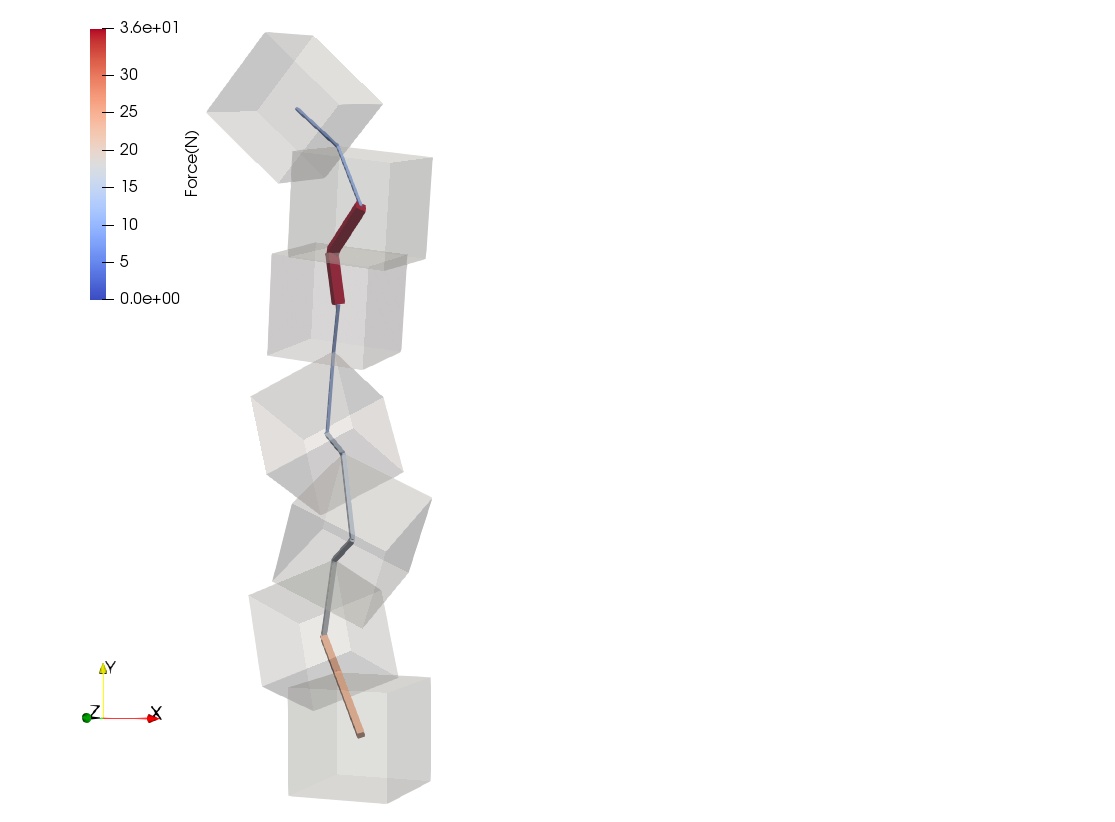
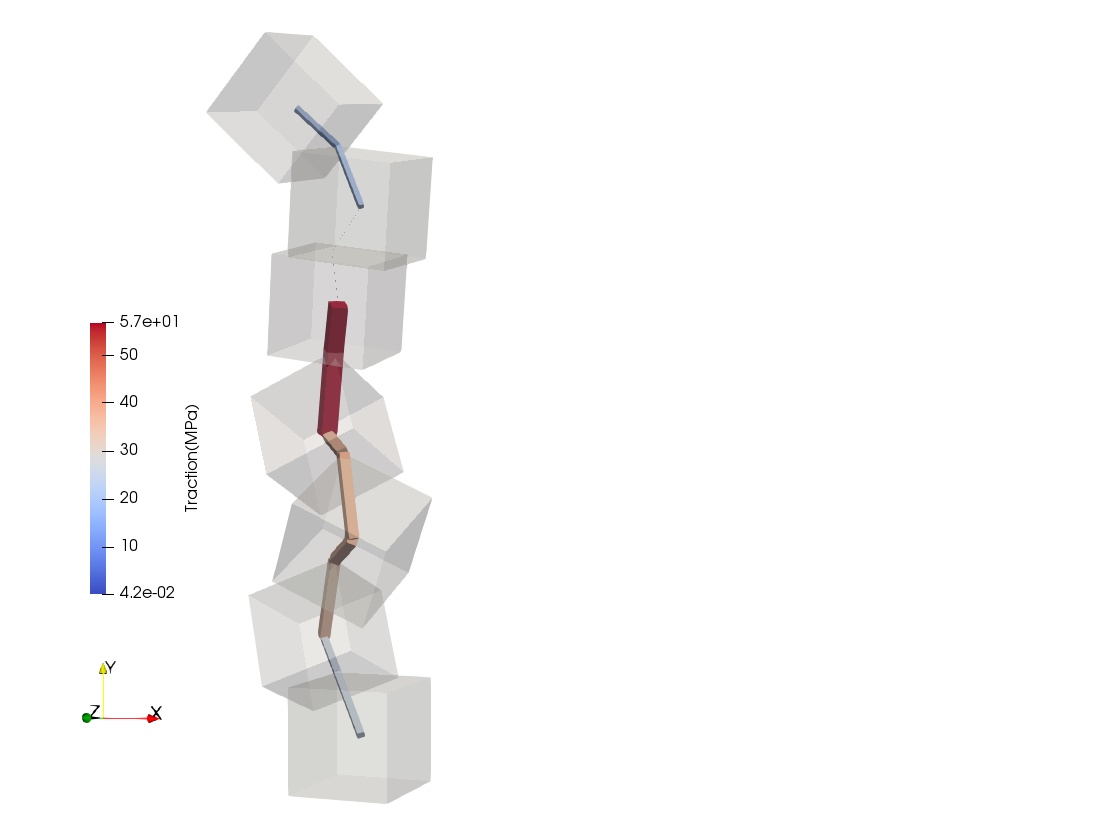
The largest force in the force chain network is distinct from the largest traction in the traction chain network, which demonstrates the complementary nature of the information contained in the two networks. The largest forces are clearly associated with large contact areas, which result in the lowest contact pressure as quantified by the traction network. Consequently, the force chain network only gives partial insight to inter-particle contact, which the traction chain network complements. Similarly, the traction chain network when viewed in isolation only partially explains inter-particle contact. This highlights the importance of considering both force chain and traction chain networks when interpreting non-spherical granular systems.
4.2.3 Large force and traction networks
Next we consider 2000 cubic particles weighing 0.0196 N each, i,.e. a side length 10mm loaded into the slide box depicted in Figure 8. The simulation after 1s, 2s, 3s, 4s, and 5s are shown in Figure 17.
The particle-wall static and kinetic coefficients of friction are 0.1, the coefficient of restitution is 0.1. The particle-wall and particle-particle normal and tangential stiffnesses are 5000 and 2500 , respectively. The particle-wall and particle-particle rolling damping is 0.1. The particle-particle kinetic coefficients of friction are 0.4, the coefficient of restitution is 0.4. The simulation is conducted with a modified inertia tensor.
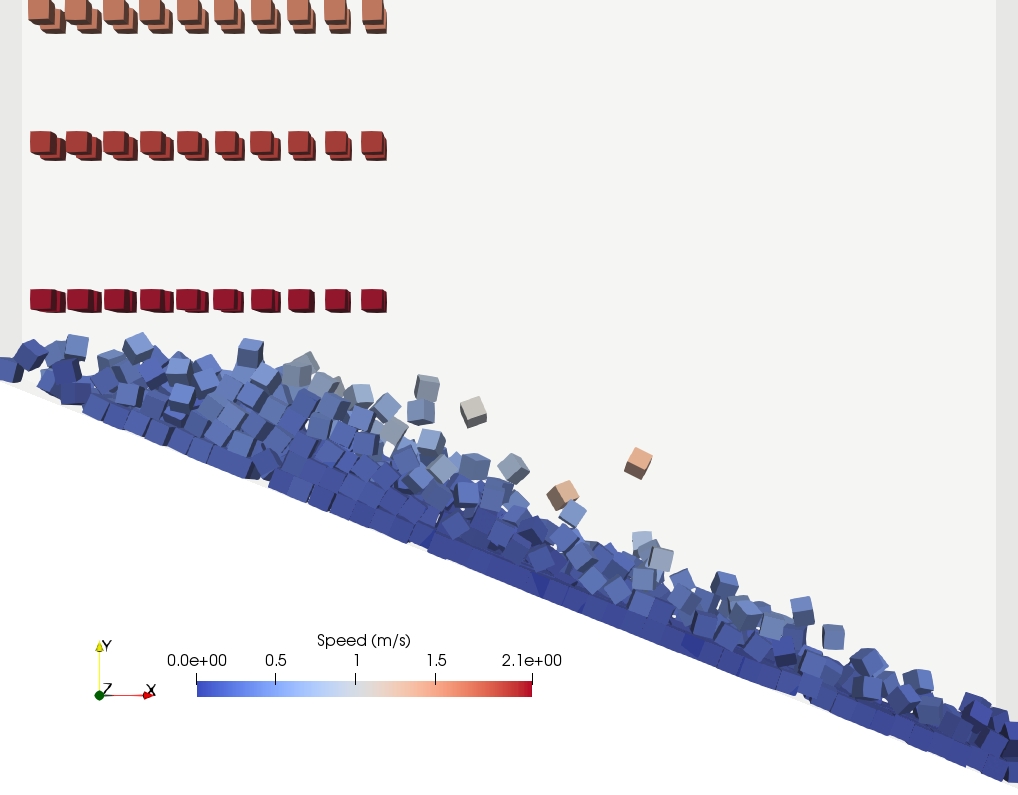
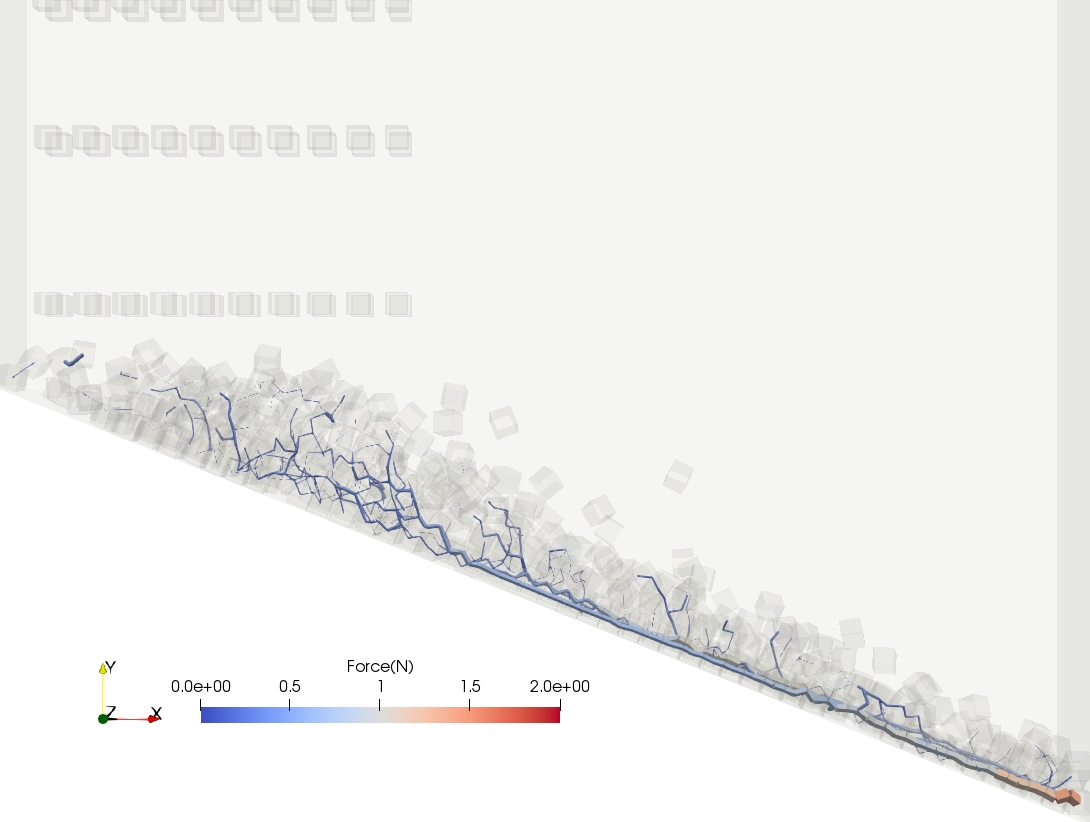
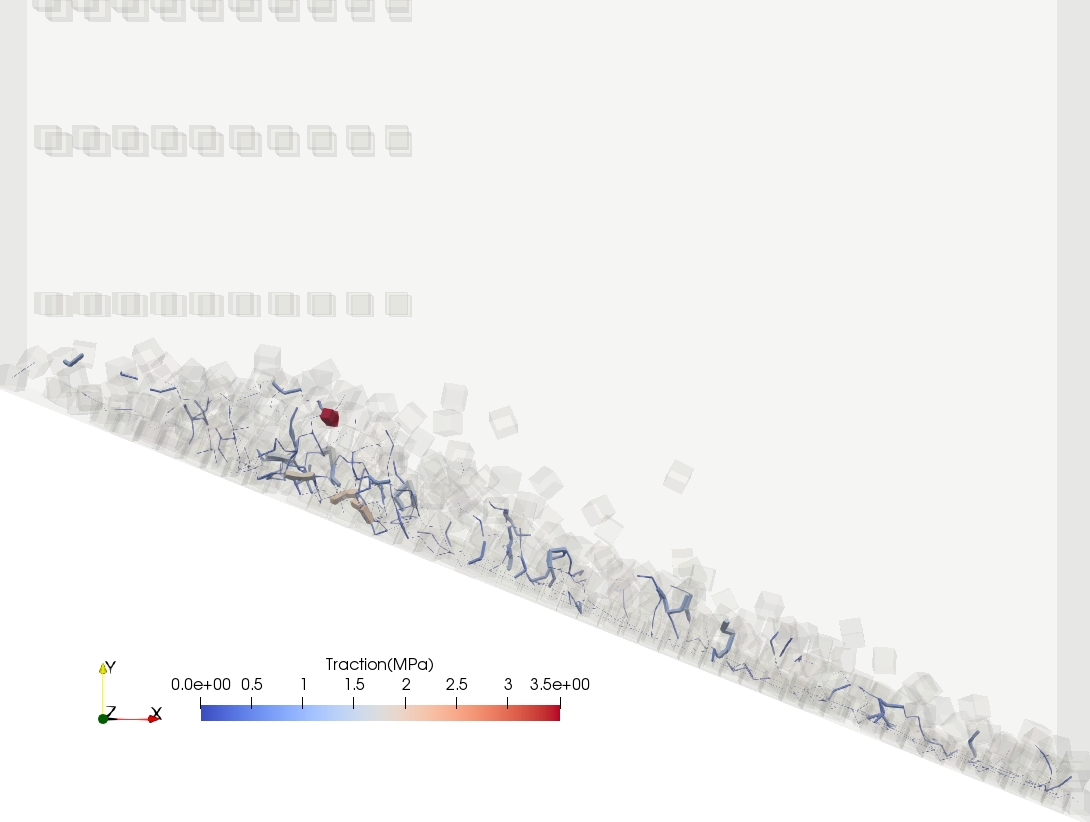
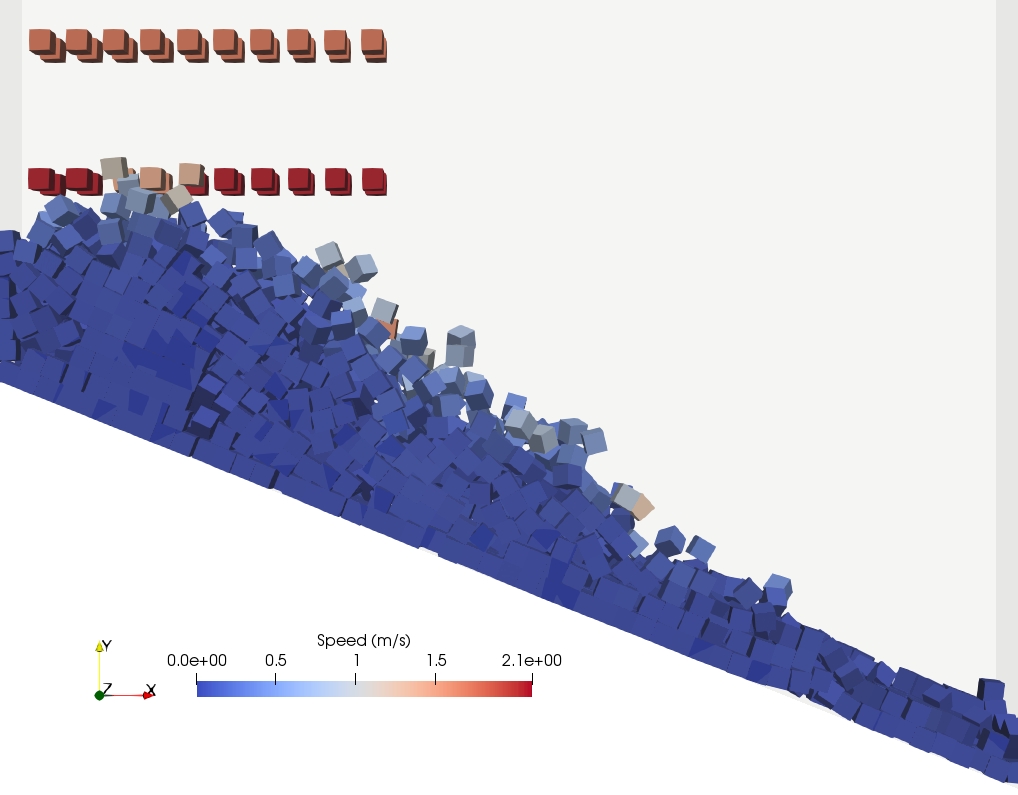
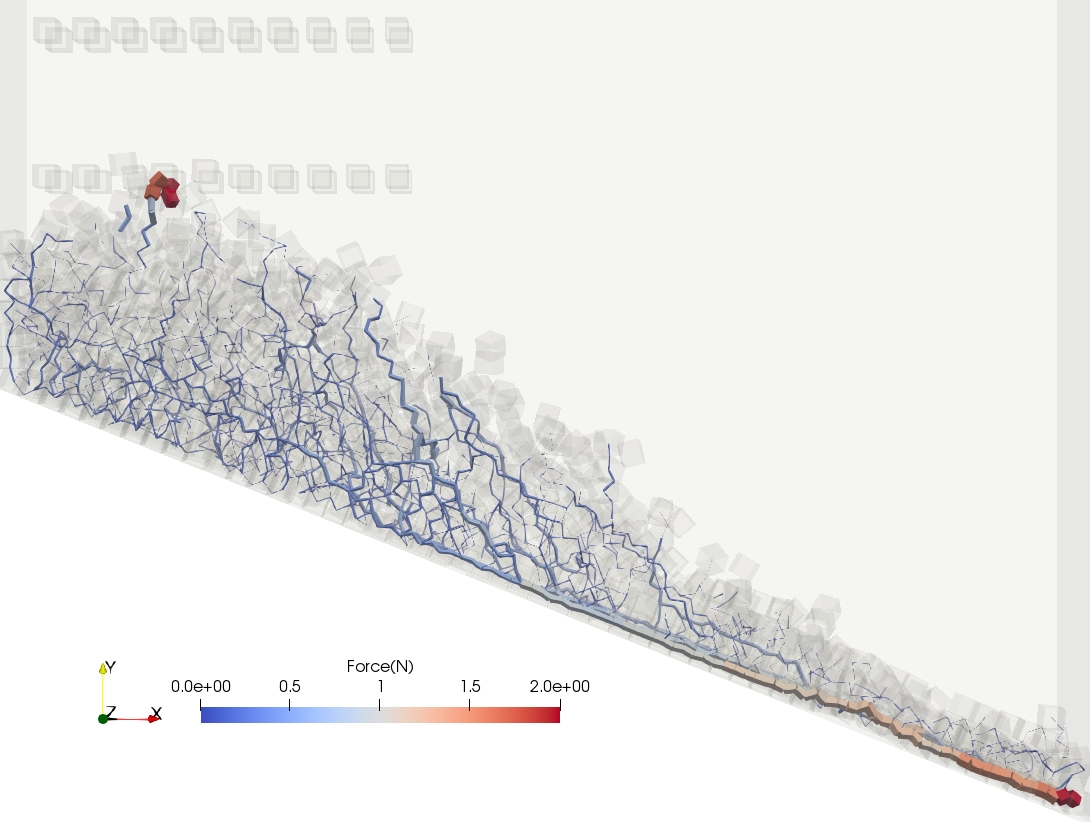
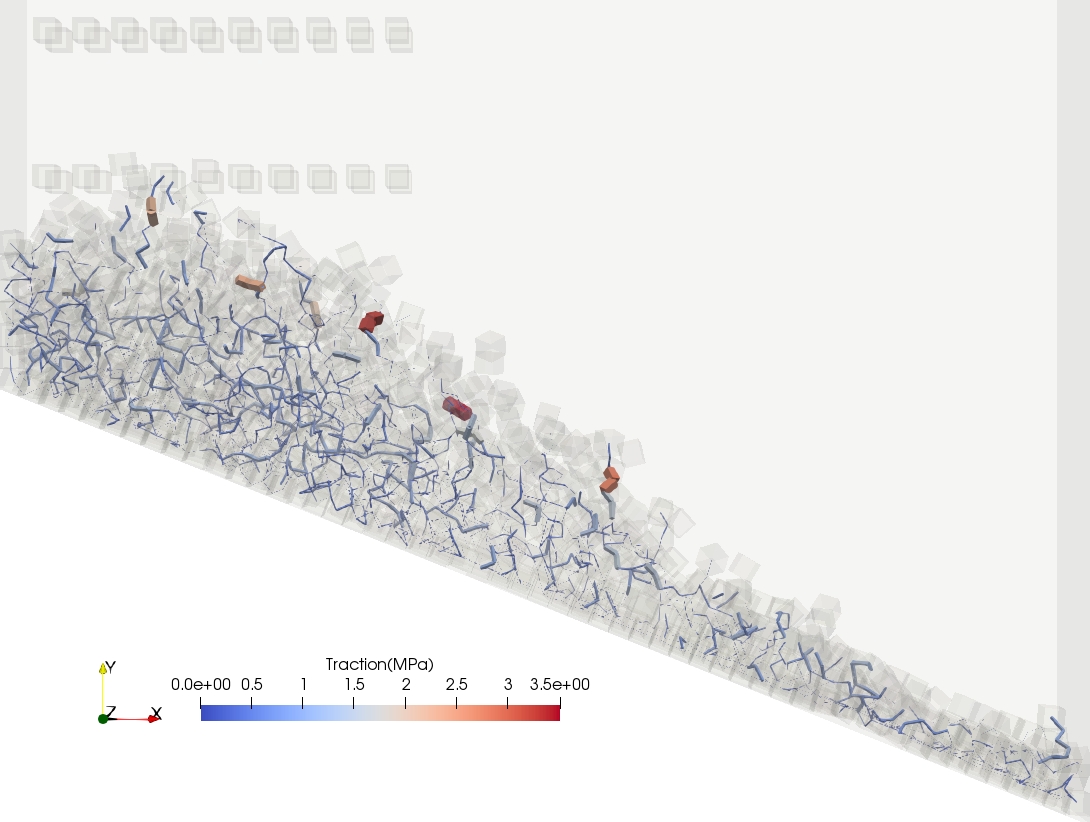
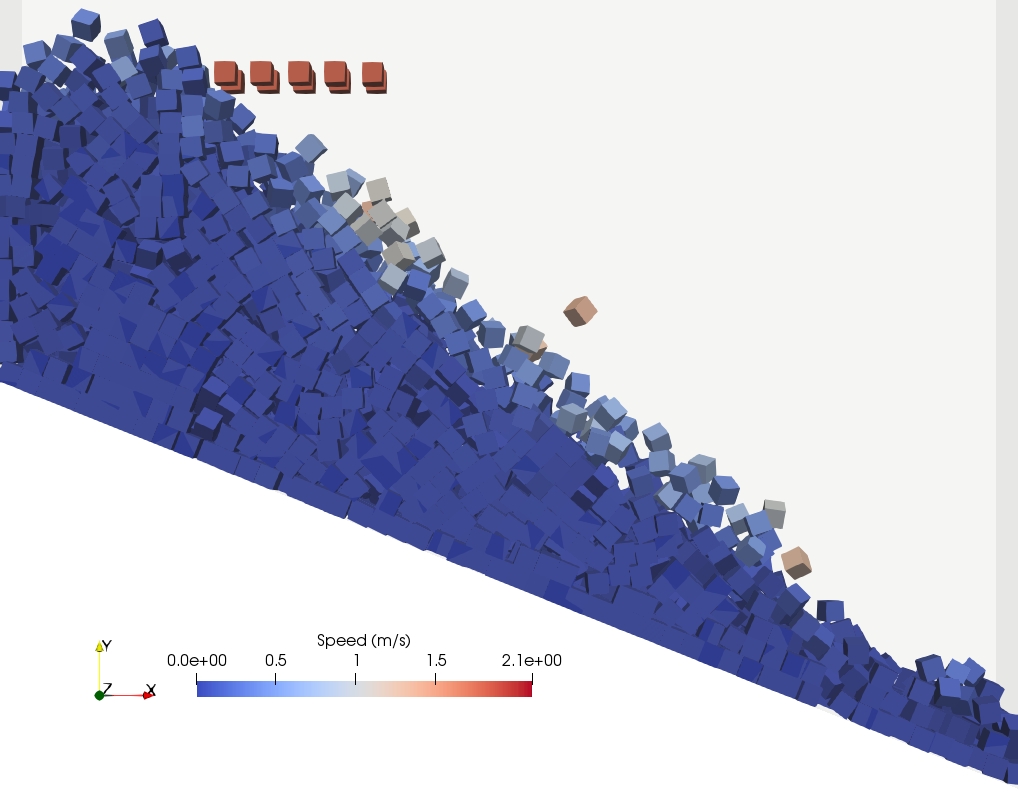
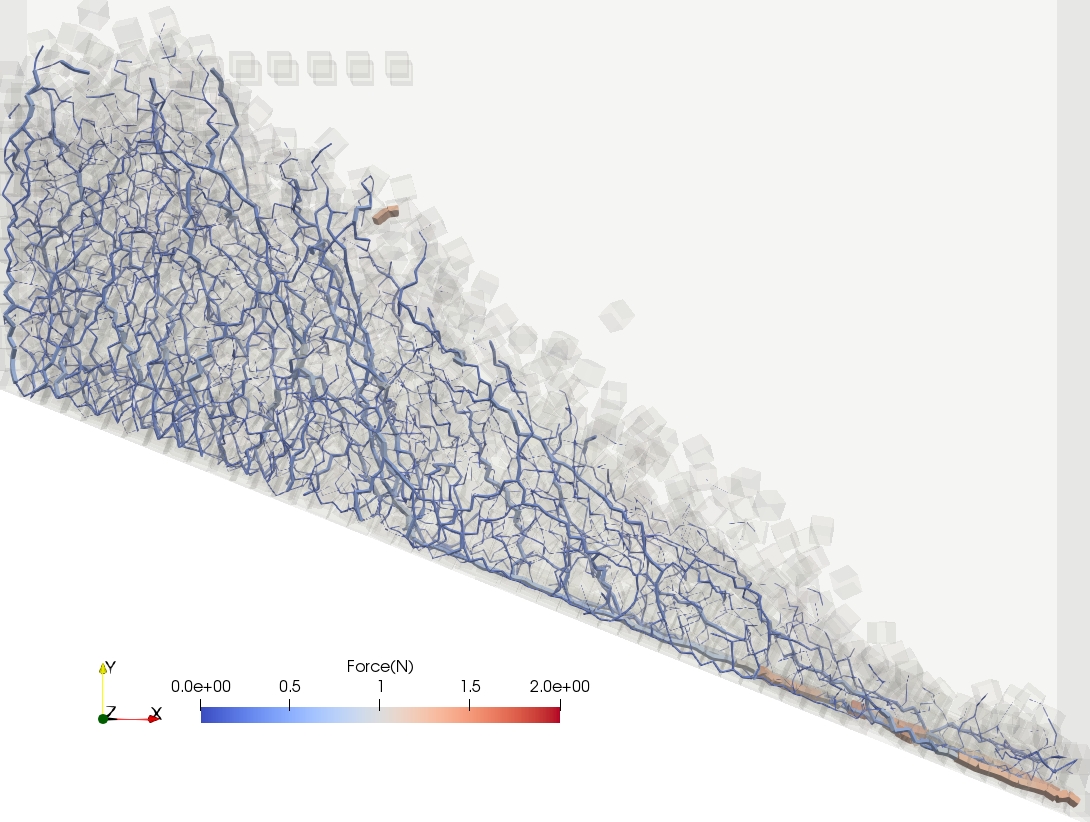
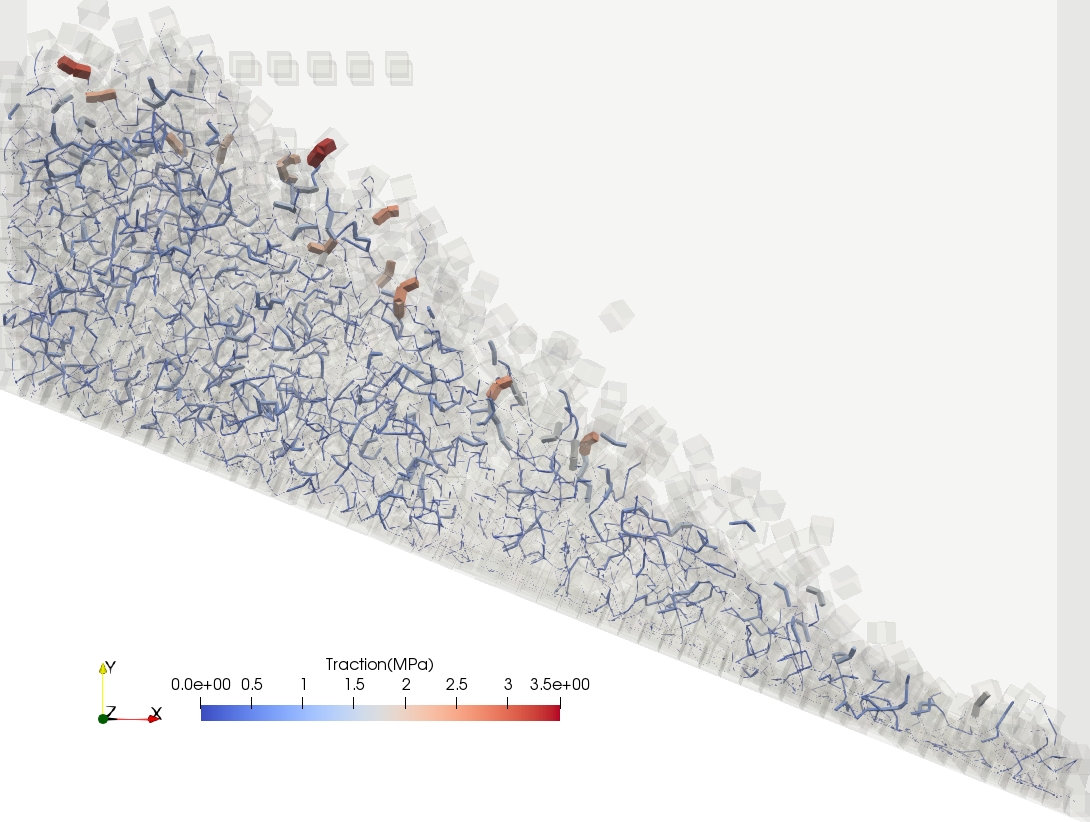
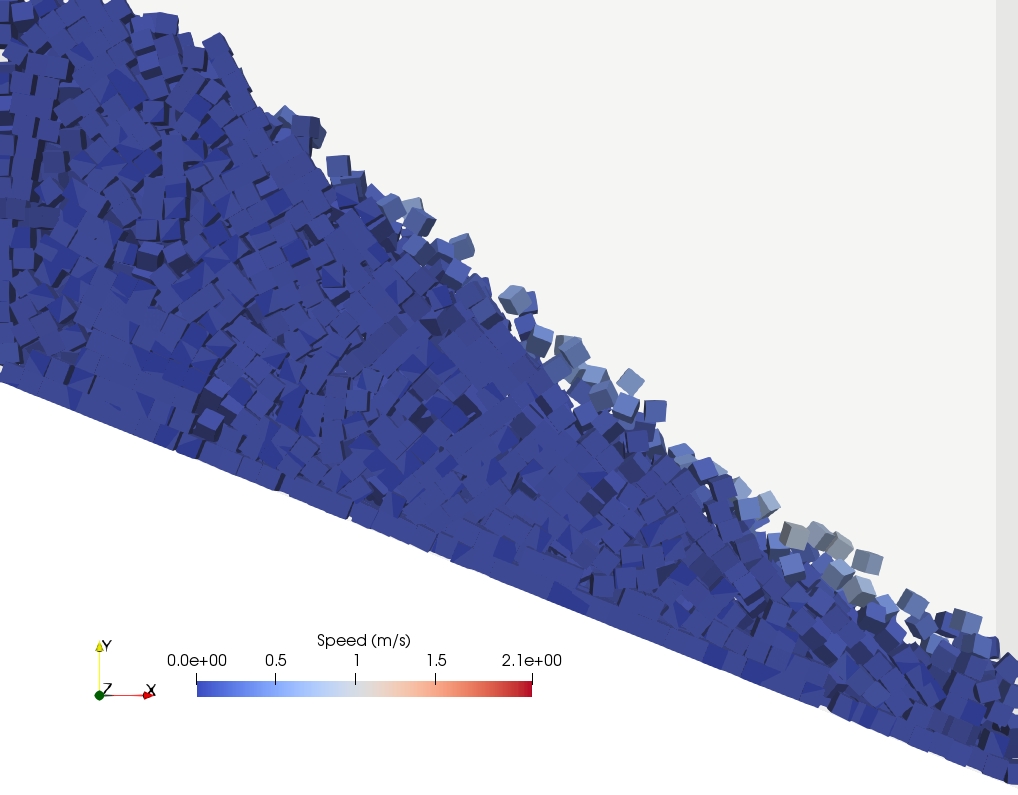
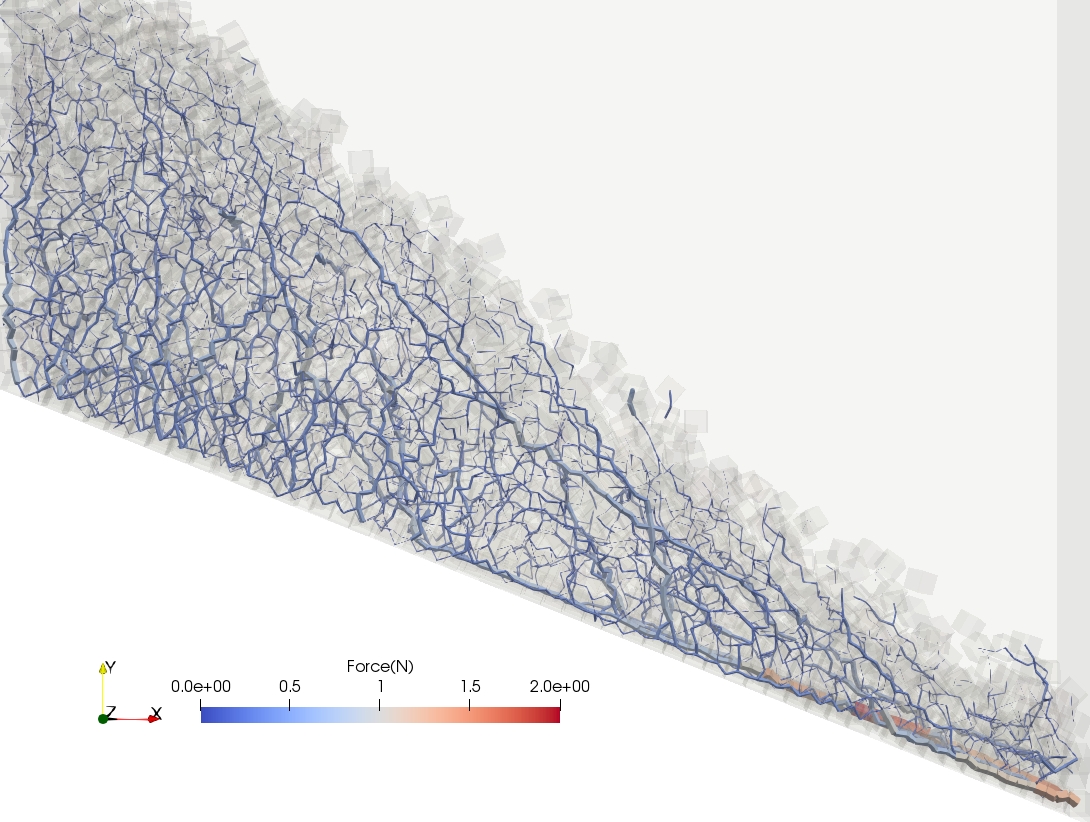
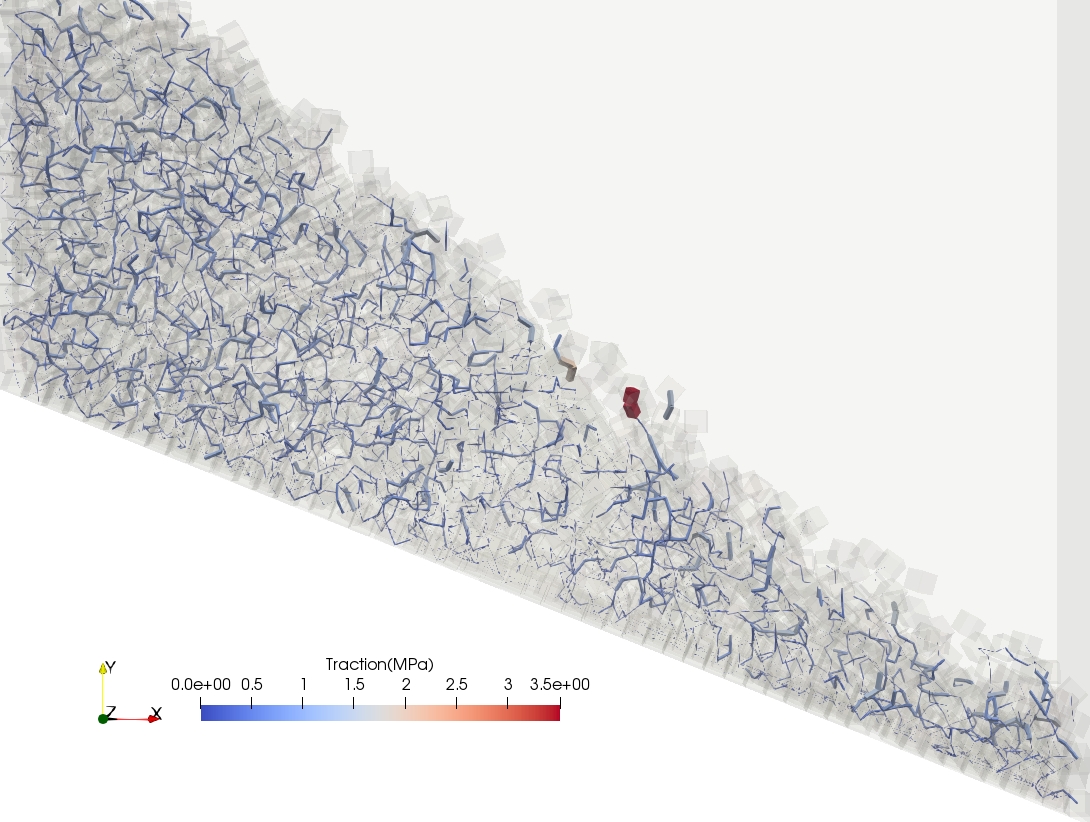
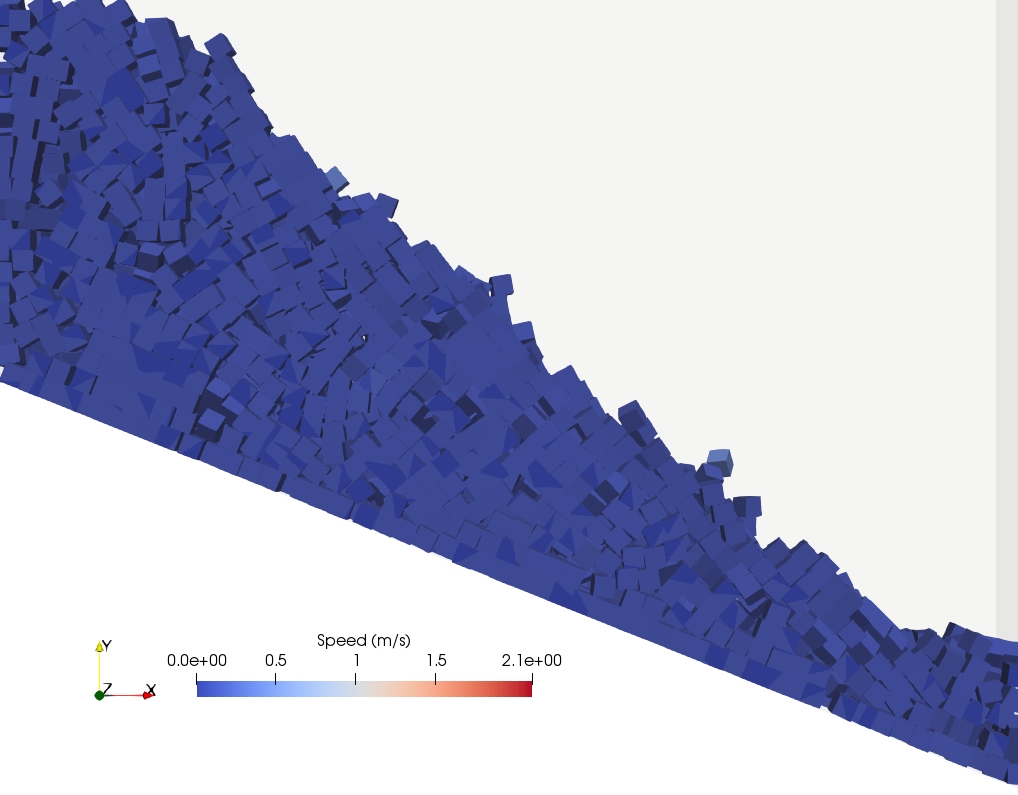
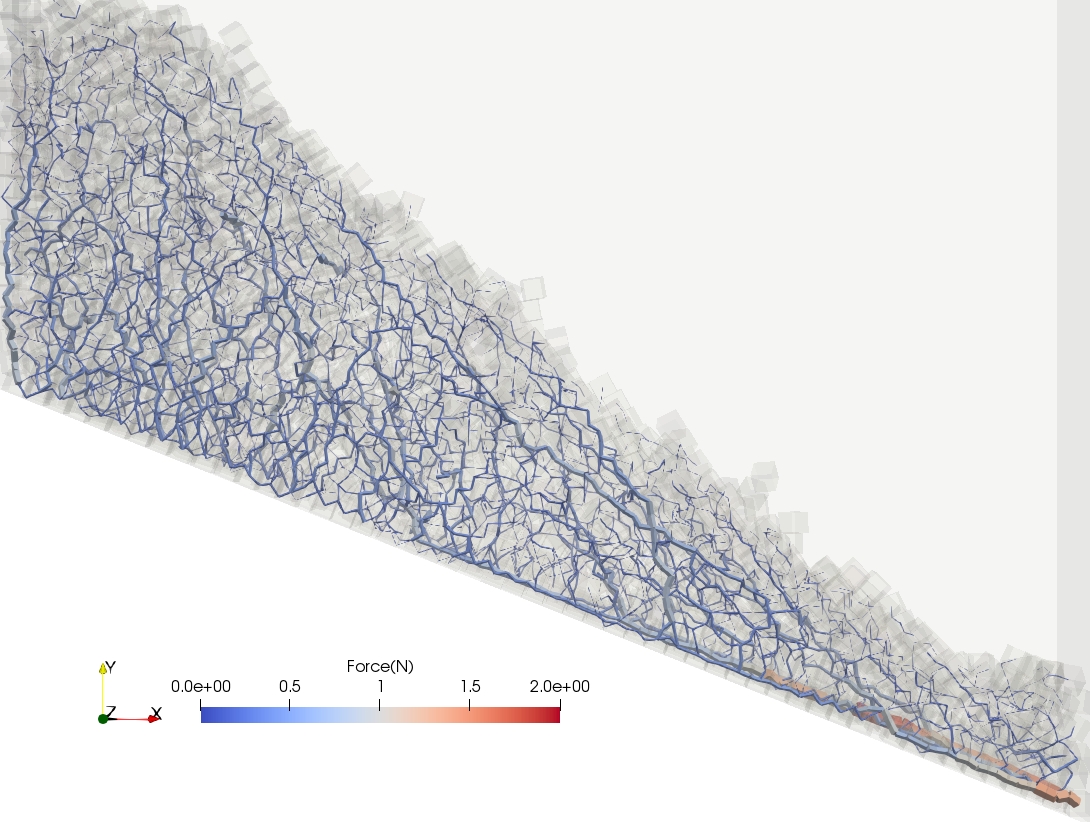
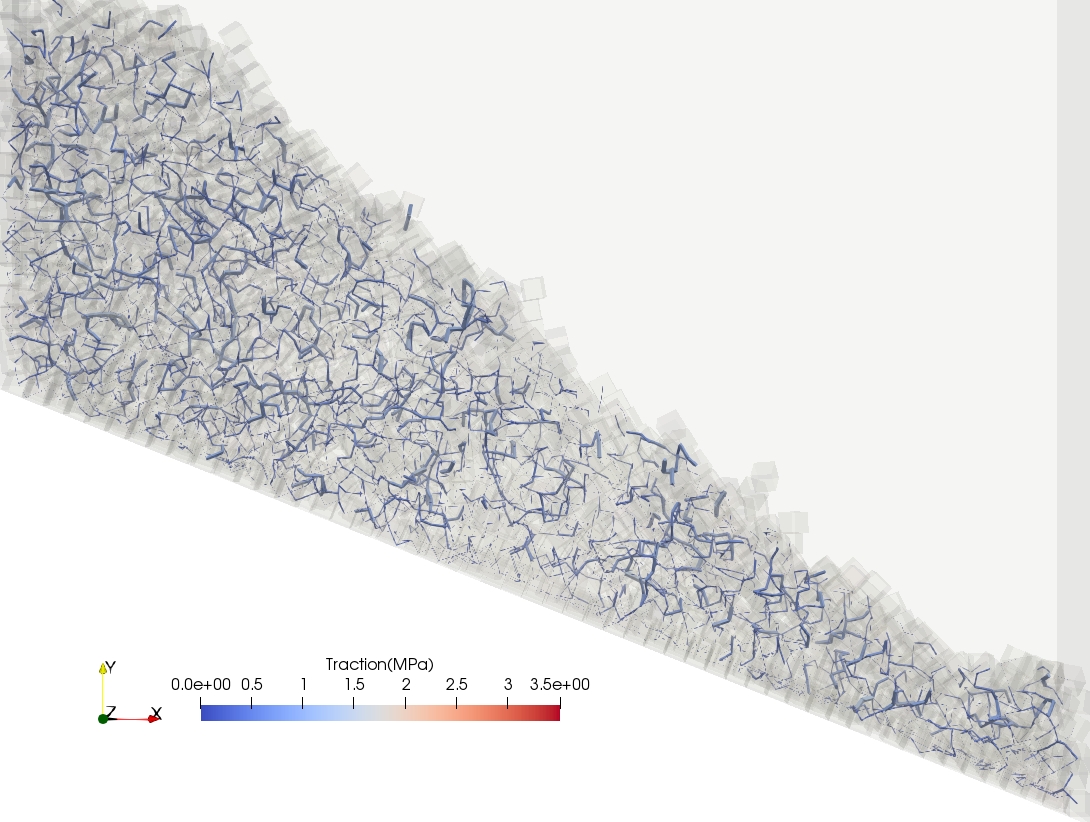
The largest forces in the force chain network are spatially distinct from the largest tractions in the traction chain network. Larger forces tend to build up in the bottom right corner of the slide box. However, reorientation of the cubic particles allows for face-face contact between particles, which reduces mean inter-particle tractions. Larger tractions tend to be isolated towards the top surface due to dynamic particle-particle interactions over edges. This demonstrates the complementary nature of the information contained in the two networks. For non-spherical particle systems, the force chain network only gives partial insight into inter-particle contact. Thus, the traction chain network complements this to give additional insight into the inter-particle contact revealing contact with high mean inter-particle tractions (mean inter-particle force intensity or mean inter-particle pressure). Similarly, the traction chain network in isolation only gives partial insight. This highlights the importance of considering both force chain and traction chain networks when interpreting non-spherical granular systems.
5 Conclusion
Force chain networks have been a cornerstone of quantitative granular material analysis, offering significant insight into inter-particle interactions through the network topology and force network evolution. In addition, the correlation between penetration distance, elastic contact force magnitude and contact area for conservative spherical particle systems render force chain networks sufficient and information complete.
Recent advances in shape accurate discrete element modeling demand a revisit of force chain networks. In this study, I first demonstrated that the elastic force magnitude and contact area for non-conservative spherical particle systems and non-spherical particle systems can be uncorrelated. The implication of this is that the force chain network is distinct from the traction chain network, with each contributing insight into the state of inter-particle contact.
The traction chain network quantifies the network topology of the tractions that exist between interacting particles, particularly when non-spherical and polyhedral shaped particles are considered. Thus, traction chain networks complement force chain networks with additional insight into the mean tractions or mean force intensity (or contact pressures) between interacting particles.
As the additional insights gained from traction chain networks mature, it will complement contact and particle degradation research for non-spherical particle systems.
Acknowledgments
Nvidia for sponsoring GPU resources to conduct this research is acknowledged.
References
- [1] D. N. Wilke, N. Govender, P. Pizette, N.-E. Abriak, Computing with non-convex polyhedra on the gpu, in: International Conference on Discrete Element Methods, Springer, 2016, pp. 1371–1377.
- [2] D. Wilke, P. Pizette, N. Govender, N.-E. Abriak, Towards reproducible experimental studies for non-convex polyhedral shaped particles, in: Powders and Grains, Montpellier, France, 2017.
- [3] N. Govender, D. N. Wilke, C.-Y. Wu, J. Khinast, P. Pizette, W. Xu, Hopper flow of irregularly shaped particles (non-convex polyhedra): Gpu-based dem simulation and experimental validation, Chemical Engineering Science 188 (2018) 34–51.
- [4] H. Hertz, Ueber die berührung fester elastischer körper., Mathematik 1882 (92) (1882) 156–171.
- [5] K. L. Johnson, K. Kendall, A. D. Roberts, D. Tabor, Surface energy and the contact of elastic solids, Proceedings of the Royal Society of London. A. Mathematical and Physical Sciences 324 (1558) (1971) 301–313.
- [6] L. E. Vallejo, S. Lobo-Guerrero, Z. Chik, A network of fractal force chains and their effect in granular materials under compression, in: J. Lévy-Véhel, E. Lutton (Eds.), Fractals in Engineering, Springer London, London, 2005, pp. 67–80.
- [7] D. M. Mueth, H. M. Jaeger, S. R. Nagel, Force distribution in a granular medium, Physical Review E 57 (3) (1998) 3164–3169.
- [8] S. Luding, Stress distribution in static two-dimensional granular model media in the absence of friction, Phys. Rev. E 55 (1997) 4720–4729.
- [9] D. S. Bassett, E. T. Owens, M. A. Porter, M. L. Manning, K. E. Daniels, Extraction of force-chain network architecture in granular materials using community detection, Soft Matter 11 (14) (2015) 2731–2744.
- [10] P. Grinchuk, S. Danilova-Tretyak, N. Stetyukevich, Force chains influence on the conductivity of granular media, Doklady of the National Academy of Sciences Belarus 57 (2018) 105–112.
- [11] E. Falcon, B. Castaing, Electrical conductivity in granular media and branly’s coherer: A simple experiment, American Journal of Physics 73 (07 2004).
- [12] J. C. Joubert, D. N. Wilke, N. Govender, P. Pizette, U. Tuzun, N.-E. Abriak, 3d gradient corrected sph for fully resolved particle-fluid interactions, Applied Mathematical Modelling 78 (2020) 816–840.
- [13] T. Pöschel, T. Schwager, Computational Granular Dynamics: Models and Algorithms, Springer-Verlag, 2005.
- [14] A. V. Potapov, Rocky dem - dem particle simulator (2011–Present).
- [15] Y. Feng, An energy-conserving contact theory for discrete element modelling of arbitrarily shaped particles: Contact volume based model and computational issues, Computer Methods in Applied Mechanics and Engineering 373 (2021) 113493.
- [16] G. Holzapfel, onlinear solid mechanics: A continuum approach for engineering science, Meccanica 37 (2002) 489–490.
- [17] J. F. Peters, M. Muthuswamy, J. Wibowo, A. Tordesillas, Characterization of force chains in granular material, Phys. Rev. E 72 (2005) 041307.
- [18] R. Arévalo, I. Zuriguel, D. Maza, Topology of the force network in the jamming transition of an isotropically compressed granular packing, Phys. Rev. E 81 (2010) 041302.
- [19] N. Govender, D. Wilke, S. Kok, Blaze-demgpu: Modular high performance dem framework for the gpu architecture, SoftwareX 5 (2016) 62–66.
- [20] N. Govender, D. Wilke, S. Kok, R. Els, Development of a convex polyhedral discrete element simulation framework for NVIDIA Kepler based GPUs, Journal of Computational and Applied Mathematics 270 (2014) 63–77.
- [21] N. Govender, D. Wilke, S. Kok, Collision detection of convex polyhedra on the NVIDIA GPU architecture for the discrete element method, Applied Mathematics and Computation 267 (2015) 810–829.
- [22] N. Govender, D. N. Wilke, P. Pizette, N.-E. Abriak, A study of shape non-uniformity and poly-dispersity in hopper discharge of spherical and polyhedral particle systems using the blaze-dem gpu code, Applied Mathematics and Computation 319 (2018) 318 – 336, recent Advances in Computing.
- [23] C. Zheng, N. Govender, L. Zhang, C.-Y. Wu, Gpu-enhanced dem analysis of flow behaviour of irregularly shaped particles in a full-scale twin screw granulator, Particuology (2021).
- [24] C. Zheng, L. Zhang, N. Govender, C.-Y. Wu, Dem analysis of residence time distribution during twin screw granulation, Powder Technology 377 (2021) 924–938.
- [25] N. Govender, Study on the effect of grain morphology on shear strength in granular materials via gpu based discrete element method simulations, Powder Technology 387 (2021) 336–347.
- [26] R. Lubbe, Investigating acceleration methods for broad-phase surface collision detection in dem, Tech. rep., University of Pretoria (12 2018).
- [27] R. Lubbe, W. Xu, D. Wilke, P. Pizette, N. Govender, Analysis of parallel spatial partitioning algorithms for gpu based dem, Computers & Geotechnics 125 (2020) 103708.
- [28] N. Govender, R. K. Rajamani, S. Kok, D. N. Wilke, Discrete element simulation of mill charge in 3d using the blaze-dem gpu framework, Minerals Engineering 79 (2015) 152 – 168.
- [29] N. Govender, D. N. Wilke, C.-Y. Wu, R. Rajamani, J. Khinast, B. J. Glasser, Large-scale gpu based dem modeling of mixing using irregularly shaped particles, Advanced Powder Technology 29 (10) (2018) 2476 – 2490.