Long-term X-ray evolution of SDSS J134244.4+053056.1:
A more than 18 year-old, long-lived IMBH-TDE candidate
SDSS J134244.4+053056 is a tidal disruption event candidate with strong temporal coronal line emitters and a long fading, mid-infrared dust echo. We present detailed analyses of X-ray emission from a Swift/XRT observation in 2009 and the most recent XMM-Newton/pn observation in 2020. The two spectra can be modeled with hard and soft components. While no significant variability is detected in the hard component above 2 keV between these two observations, the soft X-ray emission in 0.3-2 keV varies by a factor of . The luminosity of this soft component fades from to erg s-1 from the observation in Swift to that of XMM-Newton, which are 8 and 19 years after the outburst occurred, respectively. The evolution of luminosity matches with the -5/3decline law well; there is a soft X-ray peak luminosity of 1044 erg s-1 at the time of the optical flare. Furthermore, the spectra of the soft component harden slightly in the decay phase, in which the photon index varies from to , although they are consistent with each other if we consider the uncertainties. Additionally, by comparing the BH mass estimate between the correlation, the broad H emission, and the fundamental plane relation of BH accretion, we find that a value of M☉ is favored. If so, taking its X-ray spectral variation, luminosity evolution, and further support from theory into account, we suggest that SDSS J134244.4+053056 is a long-lived tidal disruption event candidate lasting more than 18 years with an intermediate-mass black hole.
Key Words.:
Accretion, accretion disk – Black hole physics – X-rays: galaxies – Galaxies: individual (SDSS J134244.4+053056.1)1 Introduction
A tidal disruption event (TDE), in which a star passing too close to a supermassive black hole (SMBH) in a galactic nucleus is torn apart by the tidal force of the hole, is of particular interest. As a result of a TDE, about half of the stellar debris is accreted by the SMBH, producing a luminous electromagnetic flare (e.g., Rees 1988; Evans & Kochanek 1989). The transient luminosity would follow the same time dependence as the mass fallback rate, which is generally assumed as -5/3. For a Schwarzschild black hole (BH) with ☉ the tidal disruption radius of a solar-type star is in the event horizon and no electromagnetic flare would be observed (Hills 1975).
The first TDE candidate was discovered in the soft X-ray band by the ROSAT all-sky survey in the 1990s and can be well interpreted by the TDE scenario (Bade et al. 1996; Komossa & Bade 1999). The general picture for soft X-ray TDEs is that at first the flare is up to several 1044 erg s-1 in soft X-ray band with an Eddington accretion rate. Then, the luminosity declines on a timescale of months to years. Finally, the hardening of X-ray spectra indicates that the disk and corona coexist on the phase with a low accretion rate (Komossa 2015; Saxton et al. 2020). Approximately 20 soft X-ray TDEs have been discovered until now (see the review in Saxton et al. 2020).
As a consequence of the rapid development of time-domain astronomy in recent years, especially large optical sky surveys, the number of TDEs has increased to . Most of these have been discovered in the optical band, and many of the optical TDEs have no or weak X-ray detection in their very early phases during the outbursts. However, X-ray emissions have been detected in three out of four optically discovered TDEs about four to nine years after the optical flares, and most TDEs have been suggested as bright X-ray sources visible for at least a decade (Jonker et al. 2020). Therefore, research in the X-ray band is still one of the most important tools for identifying and studying TDEs.
In the gas-rich environment, the extreme ultraviolet (EUV) X-ray emission from TDEs can photoionize the surrounding gas, thereby producing luminous, transient high-ionization coronal emission lines (e.g., Komossa et al. 2008; Wang et al. 2011, 2012). While in a dust-rich environment, high-energy X-ray photons from the TDEs are absorbed by dust and then reradiated in the infrared band (Lu et al. 2016). Such light echoes have been observed in the mid-infrared light curves of some TDEs (Dou et al. 2016, 2017; Jiang et al. 2016, 2017, 2019; van Velzen et al. 2016) and used as an efficient method to search for TDE candidates (Wang et al. 2018; Jiang et al. 2021).
SDSS J134244.4+053056 (hereafter J1342) is a TDE candidate with transient extreme optical coronal emission lines at a redshift of 0.0366. Strong high ionization coronal lines appeared in a SDSS spectrum (e.g., [Fe X], [Fe XI] and [Fe XIV]) on April 09, 2002, but disappeared in the following multiple mirror telescope (MMT) spectrum on December 26, 2011 (Wang et al. 2012; Yang et al. 2013). The long-fading mid-infrared emission was also detected in J1342, which was interpreted as an infrared echo from dust in the nuclear region by reprocessing the high-energy radiation of the TDE (Dou et al. 2016). Although we do not have good constraints on the date for its continuum flare, the high-ionization iron coronal lines disappeared in subsequent observations; this suggested that they must be short lived. Thus, the tidal disruption flare happened not too far from the SDSS spectroscopic observation. The peak of the flare is then roughly estimated to occur roughly one year before the SDSS optical spectral observation (see the details in Dou et al. 2016).
Soft X-ray emission was detected in J1342 with Swift/XRT observations in May 2009, and this source was classified as a veiled X-ray TDE (Auchettl et al. 2017). However, Chilingarian et al. (2018) argue that the detected X-ray emission was not from a TDE because the observations took place seven years after the time of the speculated optical flare, and these authors attributed the X-ray emission to active galactic nucleus (AGN) activity. Thus, the nature of its X-ray emission is not yet clear. In this paper, with the latest XMM-Newton observation in 2020 and the radio observation with VLA in 2016, we present a detailed X-ray and radio analysis of J1342. In section 2, we describe the observations and data reductions. In section 3, we present our results of X-ray spectral fitting and discuss the observed properties in AGN and TDE scenarios, respectively. We conclude in section 4. Throughout this paper, we adopt a standard flat cosmology with =0.3, =0.7, and a Hubble constant of H0 = 70 km s-1 Mpc-1, which results in a luminosity distance of 161.1 Mpc.
2 Data reduction and analysis
2.1 X-ray data reduction
Three observations of J1342 were taken with the X-Ray Telescope (XRT; Burrows et al. 2005) at the Neil Gehrels Swift Observatory (Swift; Gehrels et al. 2004) during May 15-20 2009. We reduced the data following the standard XRT data reduction111http://swift.gsfc.nasa.gov/analysis/xrt_swguide_v1_2.pdf with the tools in HEASOFT (v6.26.1). The cleaned events files were reprocessed using the task XRTPIPELINE. Only observations with a “photon counting” mode were used. The source spectrum was extracted from a circular region with radius of at the optical center with the tool XSELECT. The background spectrum was extracted from a larger source-free region near the source. No significant variation was detected among the observations and we stacked the three observations to increase the signal-to-noise ratio (S/N). The net count rate of the target is 0.001390.00033, 0.000160.00016, and 0.001540.00036 cts s-1 in the 0.3-2, 2-10, and 0.3-10 keV bands, respectively.
J1342 was observed with XMM-Newton on January 8, 2020 (ObsID: 0843440201; PI: Chilingarian). We reprocessed the XMM-Newton data with Science Analysis Software (SAS, v19.0) and the latest calibration files (updated to 2020 July). We only used data from the pn instrument of European Photon Imaging Camera (EPIC-pn) in our analysis considering its high sensitivity and large effective area. The events file was created by ‘epchain’. After removing the ‘bad’ (e.g., hot, dead, or flickering) pixels, the high flaring particle background time interval was created by applying a threshold rate of 0.5 cts s-1 with single events (PATTERN=0) in the 10-12 keV band for EPIC-pn. This results in a net exposure time of 12.46 ks, after removing the high flaring particle background time interval. Only single and double events (PATTERN=4, FLAG=0) were used for the following analysis. The source spectrum was extracted from a circular region with radius of centered on its optical position, and the background spectrum was extracted from a nearby source-free circular region with radius of . The net count rate is 0.00930.0011, , and 0.01090.0012 cts s-1 in the 0.2-2, 2-10, and 0.2-10 keV bands, respectively.
The logs of Swift/XRT and XMM-Newton/pn observations are listed in Table 1. The hardness ratio (HR) between 0.3-2 and 2-10 keV222The hardness ratio is defined as HR = (H-S)/(H+S), where S and H are the source counts for the soft (0.3-2 keV) and hard (2-10 keV) bands. is for the stacked Swift/XRT observation, and for the XMM-Newton/pn observation, which is calculated by the Bayesian estimation of hardness ratios code (BEHR; Park et al. 2006). The values of hardness ratios indicate a slight spectral shape variation between Swift and XMM-Newton observations, although they are consistent with each other if considering the uncertainties. The Swift/XRT stacking spectrum (Swift spectrum, hereafter) is then regrouped to have at least three counts per bin, while the XMM-Newton/pn spectrum (XMM-Newton spectrum, hereafter) is regrouped to least seven counts per bin to adopt the C-statistic for spectral fitting in XSPEC (v. 12.9.1). During the spectral fitting, the uncertainties are estimated at 68% confidence level for one interesting parameter.
2.2 X-ray spectral analysis
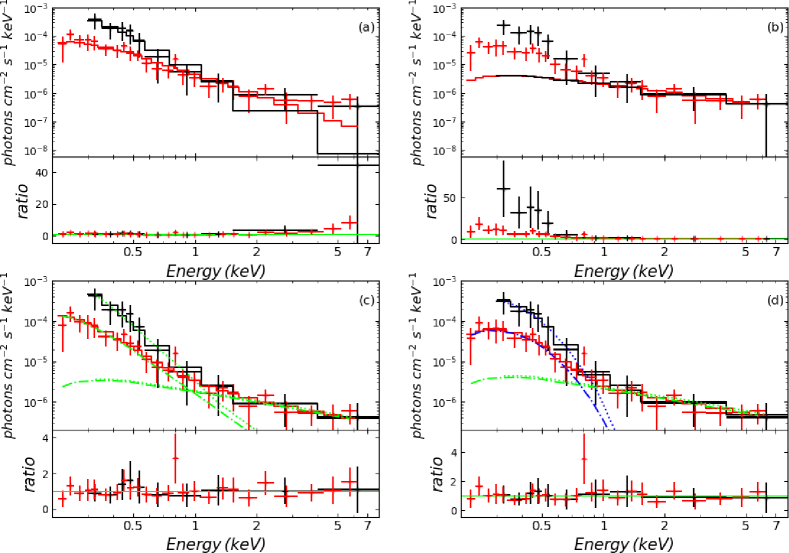
First, a simple Galactic absorbed power-law model (PL) with column density fixed at the Galactic value of 1.82 1020 cm-2 (Kalberla et al. 2005, the Galactic absorption is included in all following spectral fitting) is applied to the Swift and XMM-Newton spectrum, respectively. The inferred photon index is for Swift spectrum (C-statistic/dof=3.8/8) and for XMM-Newton spectrum (C-statistic/dof=19.5/25). However, the residuals in the hard 2-10 keV band in both of the two spectra indicate that the other component is needed to well represent the data, as shown in Fig.1(a). The PL model is then applied to the XMM-Newton 1-10 keV spectrum because the S/N is better than that of Swift. The inferred photon index is (C-statistic/dof=2.1/7). We then extrapolated this model to the whole 0.3-10 keV (0.2-10 keV) band spectrum of Swift (XMM-Newton). As shown in Fig. 1(b), there are significant excesses in soft X-ray band, especially for the Swift spectrum.
So we applied the two PL model to the spectra with one photon index fixed at 0.9. The fitting is acceptable and the inferred photon index of the soft PL component is for the XMM-Newton spectrum and for the Swift spectrum. The soft PL component for the Swift spectrum is slightly steeper than that of XMM-Newton, although there is no significant difference considering the uncertainties. But the flux is significantly different (Fig. 1c). The flux in 0.3-2 keV of the soft PL component is 10-14 and 10-14 erg cm-2 s-1, for Swift and XMM-Newton, respectively. Notably, there is no flux variation of the hard PL component between the Swift and XMM-Newton observation. The flux in 2-10 keV of the hard PL component is and 2.8010-14 erg cm-2 s-1 for Swift and XMM-Newton, respectively.
Since most of the X-ray-selected TDEs can be well fitted with a blackbody model for their soft X-ray band, we used a blackbody (BB) component instead of the soft PL component fitting the spectra (Fig. 1d). The inferred temperature is and eV for Swift and XMM-Newton spectrum, respectively. The best fitting parameters, including the total fluxes and luminosities in 0.3-2 and 2-10 keV for each model, are listed in Table 2.
| (1) | (2) | (3) | (4) | (5) | (6) |
| Tel./instr. | Obs. ID | Obs. date | Exp. time | Count rate | Count rate |
| (soft band) | (full band) | ||||
| [ks] | [10-3 ct s-1] | [10-3 ct s-1] | |||
| Swift/XRT | 00090102001 | 2009 May 15 | 6.73 | 0.80 | 1.16 |
| Swift/XRT | 00090102002 | 2009 May 17 | 6.60 | 2.38 | 2.61 |
| Swift/XRT | 00090102003 | 2009 May 20 | 3.26 | 0.56 | 0.560.53 |
| Swift/XRT | stacking | 2009 May 15-20 | 16.60 | 1.380.32 | 1.54 |
| XMM-Newton/pn | 0843440201 | 2020 January 8 | 12.46 | 9.31.1 | 10.91.2 |
| (1) | (2) | (3) | (4) | (5) | (6) | (7) | (8) | (9) |
| Model | kT | C-s/dof | ||||||
| 10-14 | 10-14 | 1041 | 1041 | |||||
| [eV] | [erg cm-2 s-1] | [erg cm-2 s-1] | [erg s-1] | [erg s-1] | ||||
| Swift/XRT (0.3-10 keV) | ||||||||
| PL | 3.9 | 3.81/8 | 5.23 | 0.14 | 1.74 | 0.05 | ||
| PL+PL | 4.8 | 0.9(fix) | 1.17/6 | 5.65 | 3.01 | 1.92 | 0.90 | |
| PL+BB | 0.9(fix) | 78 | 0.75/6 | 5.11 | 3.71 | 1.67 | 1.11 | |
| XMM-Newton/pn (1-10 keV) | ||||||||
| PL | 0.9 | 2.12/7 | 3.32 | 0.94 | ||||
| XMM-Newton/pn (0.2-10 keV) | ||||||||
| PL | 2.4 | 19.54/25 | 1.65 | 0.67 | 0.52 | 0.22 | ||
| PL+PL | 3.7 | 0.9(fix) | 8.57/22 | 1.64 | 2.84 | 0.52 | 0.85 | |
| PL+BB | 0.9(fix) | 90 | 9.13/22 | 1.59 | 3.35 | 0.50 | 1.00 | |
2.3 Radio data reduction
J1342 was observed at C band (central frequency of 5.5 GHz) with the VLA in its moderately compact C configuration on March 12, 2016 (program code, 15B-247; PI: Zauderer). The data were reduced following standard procedures with the CASA package. Flux density calibration was conducted using 3C286, whereas the nearby source J1347+1217 was used to determine the complex gain solutions, which were interpolated to J1342. After removing the radio frequency interference, the data were imaged using the CLEAN algorithm with Briggs weighting and ROBUST parameter of 0. The final cleaned map has a synthesized beam of 3.2″2.4″. J1342 is clearly detected as a compact source, with an integrated flux density of Jy, which was measured using the CASA task IMFIT.
3 Discussion
3.1 X-ray origin
The two X-ray spectra can be well described with a two-component model: one component is a hard PL component with photon index of , dominated in the 2-10 keV band; the other is a very soft component as a steep PL with photon index of for Swift (or 3.70.5 for XMM-Newton) or a blackbody with temperature of eV, dominated in the 0.2-2 keV band. In the Swift observation, the luminosity of the hard component is 1.6 and 8.9 erg s-1 in 0.3-2 and 2-10 keV, respectively; the soft component is 1.8 and 0.008 erg s-1 in 0.3-2 and 2-10 keV, respectively. In the XMM-Newton observation, the luminosity of the hard component is and 8.4 erg s-1 in 0.3-2 and 2-10 keV, respectively; the soft component is 3.7 and erg s-1 in 0.3-2 and 2-10 keV, respectively.
The host galaxy of J1342 is a star-forming galaxy of which the hot interstellar medium could contribute to X-ray emission. The estimated X-ray emission from its host galaxy is erg s-1 in 0.3-10 keV using the correlation between the star formation rate (SFR) and the X-ray luminosity (e.g., Mineo et al. 2012), if adopting its SFR of 0.07 ☉ yr-1 (French et al. 2020). This is more than two orders of magnitude lower than the luminosity observed by Swift or XMM-Newton. Thus, the host galaxy origin for the observed X-ray emission could be ruled out.
The 0.3-2 keV band luminosity of Swift observation is times brighter than that of XMM-Newton. If only considering the soft PL component, the luminosity of Swift would be times brighter than that of XMM-Newton. However, there is no significant difference in the 2-10 keV band luminosity between Swift and XMM-Newton. This indicates that the emissions of the soft and hard component may have different origins for J1342.
As the luminosity of the hard component in 0.3-10 keV is erg s-1 and no significant variation is detected in between the Swift and XMM-Newton observations, we speculate this component has always existed. The origin of this hard component is unclear. One possibility is that J1342 has some low level of AGN activity. Using the luminosity correlation between and in AGNs (e.g., Lamastra et al. 2009), we can also estimate the X-ray contribution of AGN activity from its narrow emission line. Adopting the flux of 1.8 erg cms-1 (Yang et al. 2013), the estimated 2-10 keV luminosity is erg s-1, which is consistent with the observed 2-10 keV luminosity of the hard component. This probability is similar to the speculation of Chilingarian et al. (2018).
Soft X-ray excess is a common feature in some AGNs, which is also usually modeled with a blackbody or a steep power law. However, such a steep soft X-ray spectrum is usually detected in X-ray bright AGNs, especially, in NLS1ys (e.g., Ai et al. 2010; Gliozzi & Williams 2020). Additionally, the variability of soft excess is generally concurrent with its disk-coronal emissions in the hard X-ray band. For J1342, the variability is only detected in the soft X-ray band and the observed luminosity is relatively lower than such bright AGNs.
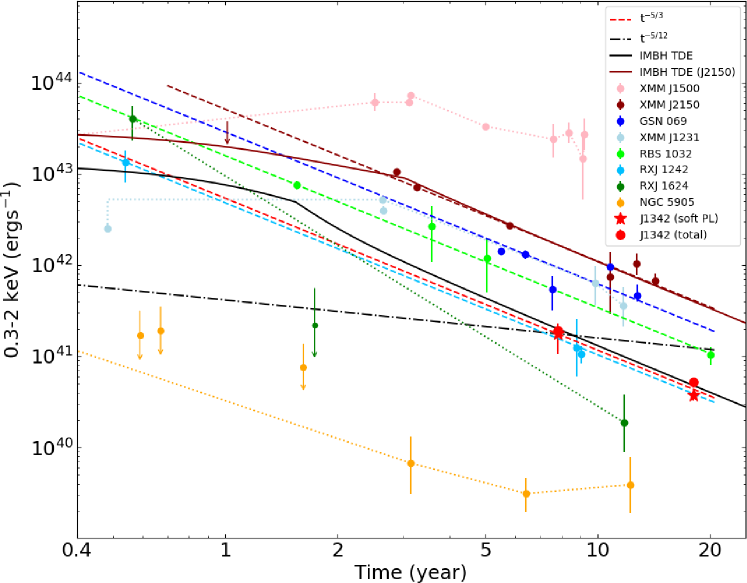
As a TDE candidate with transient coronal lines, variability in the soft X-ray band is expected in J1342. The light curve of 0.3-2 keV band luminosity is shown in Fig. 2. We apply a declined power-law function to fit the light curve as follows:
where is time since the date of the X-ray peak of the tidal disruption flare in unit of year. Here, we adopt the peak of the X-ray flare occurred about one year prior to the SDSS optical spectral observation as estimated in Dou et al. (2016). If we adopt the total X-ray luminosities in 0.3-2 keV band, we obtain a power-law index of . Fitting to the X-ray luminosity evolution of the soft component in 0.3-2 keV band, we obtain a power-law index of . Interestingly, we find the observed X-ray luminosities in 0.3-2 keV well matched the theoretical canonical decline of in the fallback model (Rees 1988; Phinney 1989) within errors, although X-ray observations are 8 (Swift) and 19 (XMM-Newton) years after the outburst (as shown in Figure 2). In constrat, declined power law, predicted with the assumption that the X-ray emissions are from the disk of TDE (e.g., Cannizzo & Gehrels 2009; Lodato & Rossi 2011), deviates from the data. Furthermore, the expected 0.3-2 keV band luminosity peak is at erg s-1, which is also consistent with the luminosity peak in other soft X-ray discovered TDEs (Komossa 2015; Saxton et al. 2020). Additionally, the spectral slope of the soft component of J1342 is for Swift and for XMM-Newton, or eV for Swift, and eV for XMM-Newton if modeling with a blackbody.
3.2 Radio origin
J1342 is clearly detected as a compact radio source, with an integrated flux density of Jy at 5.5 GHz. There are three possible origins for the radio emission: star formation, AGN, and/or TDE. If assuming the radio-derived SFR () equal to the optical SFR of 0.07 yr-1, we can estimate the radio contribution from star formation, using the relation between the SFR and radio flux (e.g., the expression in Section 3.2 in Greiner et al. 2016). After subtracting the star formation contribution, the radio emission from the AGN and/or TDE is obtained at a level of 31 Jy. As discussed in Section 3.1, a persistent harder component from AGN and a variable soft component from TDE are present in the X-ray spectra of J1342. Since only a single-epoch radio observation is available, we cannot tell whether there is a similar radio variability as observed in soft X-rays, which is helpful to identify the radio origin from a TDE. Further observations at radio bands are encouraged to determine whether the radio emission is stable or declining in flux.
3.3 Black hole mass
The BH mass of J1342 is estimated to be with an uncertainty of 0.5 dex using the correlation (French et al. 2020). However, Chilingarian et al. (2018) measured its virial BH mass as using the flux and width of the broad H emission from the Magellan/MagE optical spectrum taken on May 30, 2017, which is years after the flare. Assuming the host-subtracted radio emission originates from a persistent AGN, we can also estimate the BH mass, using the fundamental plane of BH accretion, an empirical correlation of the mass of a BH, its radio luminosity, and its 2-10 band power-law continuum luminosity (Gültekin et al. 2014). The BH mass estimated from this correlation is 4.3105 , with an uncertainty of 0.8 dex. Besides the intrinsic scatter, the low luminosity of J1342 makes the correction for radio contamination from host emission uncertain. Therefore, BH mass estimation from the fundamental plane should be treated with caution.
Considering the scatter of correlation at low BH mass ( ) is very large (Kormendy & Ho 2013), the estimated BH mass of J1342 based on this correlation may have large intrinsic uncertainty. The estimation from a fundamental plane correlation has an even large scatter and whether such a correlation is applicable to SMBHs is still under debate (Gültekin et al. 2019). The systematic uncertainty of the broad H-based virial estimation for the BH mass is usually within 0.3 dex (Xiao et al. 2011; Dong et al. 2012). Furthermore, the Magellan/MagE spectrum is obtained 16 years after the flare, and it would scarcely be affected by the flare. Based on these reasons, we prefer the BH mass of ☉ from the broad H-based virial estimation, and we consider the values obtained from the other two methods only for a consistency check; these checks support the presence of an intermediate mass BH (IMBH; BH mass ) in J1342.
3.4 IMBH-TDE
The X-ray spectral slope and long-term spectral evolution is similar to other thermal X-ray TDEs, for example, RBS 1032. The luminosity decline of RBS 1032 also follows the approximation and has a super-soft spectrum () at its early phase and remains still very soft () 20 years after the discovery (Maksym et al. 2014). The similar X-ray evolution behavior of J1342 suggests it is also a TDE, which is consistent with the previous studies from its transient coronal lines (Wang et al. 2012; Yang et al. 2013) and mid-infrared dust echo (Dou et al. 2016). If so, it would make J1342 one of the long-lived TDEs lasting more than ten years.
The long-lived TDEs have been discovered in several individuals, including RX J1242.6-1119, RX J1624.9+7554, NGC5905 (Vaughan et al. 2004), RBS 1032 (Maksym et al. 2014), 3XMM J1500+0154 (Lin et al. 2017a), 3XMM J2150-0551 (Lin et al. 2018, 2020), 2XMM J1231+1106 (Lin et al. 2017b), and GSN 069 (Shu et al. 2018), although the later two source is a TDE occurring in an AGN. We collected their X-ray light curves and plotted these in Figure 2. We note that the declines in their very later phase are also discovered in XMM J2150-0551, GSN069, RX J1242.6-1119, and RBS 1032.
Several theoretical models could explain the long-lived TDEs, for example, a long super-Eddington accretion phase, perhaps involving a disrupted object with a large mass (e.g., Lin et al. 2017a), a partially stripped evolved star atmosphere (MacLeod et al. 2012), or later distant circularization (Guillochon & Ramirez-Ruiz 2015; Shiokawa et al. 2015, see also Saxton et al. 2020). For J1342, if adopted the virial BH mass of ☉, the X-ray luminosity peak of J1342 estimated from the power-law decline of would be one magnitude order larger than its Eddington luminosity (LEdd = 1.26 1038 (/) erg s-1). Additionally, these would also have a super-Eddington stage lasting roughly one year in the early stage of outburst.
Chen & Shen (2018) suggest an IMBH-TDE model explains the more than 13 year long-lived TDE 3XMM J2150-0551. These authors predicted that the tidal disruption of a main-sequence star by an IMBH could always be a long-term circularization process, leading a light curve as long as two decades, which still follows the decline in a very later phase. We can also explain the later-time X-ray evolution of J1342 with this IMBH-TDE model, as shown in Figure 2, for example, the tidal disruption of a main-sequence star with mass of 0.1 , adopting the virial BH mass of .
4 Conclusion
X-ray emission was detected in the TDE J1342 from Swift/XRT and XMM-Newton/pn observations, which is and 19 years after the flare. The luminosity of the XMM-Newton observation is fainter at erg s-1, compared to the value, erg s-1 of Swift. We find, however, that the variation is mostly from the emission in soft X-ray: erg s-1 in XMM-Newton observation and erg s-1 in Swift. The emission in hard 2-10 keV band is consistent between the two observations.
To infer the nature of the variation we modeled the spectra with two-component models, including one flat hard power law plus one steep power law, or a blackbody component. The flat, hard power-law component could be explained as the persistent AGN activity. We find some TDE evidence as follows:
-
•
The soft component can be well fitted with a steep power law or blackbody model. The spectra is somewhat harder at fading phase of duration years with as obtained from XMM-Newton, compared to as obtained with Swift, although the spectral slopes are consistent with each other if we consider the uncertainties. In a blackbody modeling the inferred temperature is eV, and eV in the spectra of Swift and XMM-Newton, separately.
-
•
The 0.3-2 keV band luminosity of the soft component fades from 1.8 to 3.7 erg s-1 in years. The declination of the luminosity is well fitted with model.
-
•
The estimated peak luminosity of the flare is erg s-1 with an assumption of declination.
Therefore, the soft X-ray spectral shape and luminosity evolution further support that J1342 is a TDE candidate, which justifies the previous studies with transient coronal lines (Wang et al. 2012; Yang et al. 2013) and mid-infrared dust echo (Dou et al. 2016). Furthermore, if the BH mass of estimated from the H emission in the 16 year later-time optical spectrum is reliable, J1342 would be a long-lived IMBH-TDE candidate.
Acknowledgements.
We would like to thank the anonymous referee and the editor Prof. Sergio Campana for the suggestions and comments that greatly improved the paper. This work is supported by Joint Research Foundation in Astronomy (U1731104, U1731109, U2031106) under cooperative agreement between the NSFC and the CAS, Chinese Science Foundation (NSFC-11833007, 11822301, 11733001). L.M.D. and J.S.H. also acknowledge the support from the Key Laboratory for Astronomical Observation and Technology of Guangzhou, the Astronomy Science and Technology Research Laboratory of Department of Education of Guangdong Province, the opening fund of CAS Key Laboratory of Galaxy Cosmology (No.18010201).References
- Ai et al. (2010) Ai, Y., Yuan, W., Zhou, H., Wang, T., & Zhang, S. 2010, ApJ, 727, 31
- Auchettl et al. (2017) Auchettl, K., Guillochon, J., & Ramirez-Ruiz, E. 2017, ApJ, 838, 149
- Bade et al. (1996) Bade, N., Komossa, S., & Dahlem, M. 1996, A&A, 309, L35
- Burrows et al. (2005) Burrows, D. N., Hill, J., Nousek, J. A., et al. 2005, Space Sci. Rev., 120, 165
- Cannizzo & Gehrels (2009) Cannizzo, J. & Gehrels, N. 2009, ApJ, 700, 1047
- Chen & Shen (2018) Chen, J.-H. & Shen, R.-F. 2018, ApJ, 867, 20
- Chilingarian et al. (2018) Chilingarian, I. V., Katkov, I. Y., Zolotukhin, I. Y., et al. 2018, ApJ, 863, 1
- Dong et al. (2012) Dong, X.-B., Ho, L. C., Yuan, W., et al. 2012, ApJ, 755, 167
- Dou et al. (2016) Dou, L., Wang, T.-g., Jiang, N., et al. 2016, ApJ, 832, 188
- Dou et al. (2017) Dou, L., Wang, T., Yan, L., et al. 2017, ApJ, 841, L8
- Evans & Kochanek (1989) Evans, C. R. & Kochanek, C. S. 1989, ApJ, 346
- French et al. (2020) French, K. D., Wevers, T., Law-Smith, J., Graur, O., & Zabludoff, A. I. 2020, Space Sci. Rev., 216, 1
- Gehrels et al. (2004) Gehrels, N., Chincarini, G., Giommi, P., et al. 2004, ApJ, 611, 1005
- Gliozzi & Williams (2020) Gliozzi, M. & Williams, J. K. 2020, MNRAS, 491, 532
- Greiner et al. (2016) Greiner, J., Michałowski, M. J., Klose, S., et al. 2016, A&A, 593, A17
- Guillochon & Ramirez-Ruiz (2015) Guillochon, J. & Ramirez-Ruiz, E. 2015, ApJ, 809, 166
- Gültekin et al. (2014) Gültekin, K., Cackett, E. M., King, A. L., et al. 2014, ApJ, 788, L22
- Gültekin et al. (2019) Gültekin, K., King, A. L., Cackett, E. M., et al. 2019, ApJ, 871, 80
- Hills (1975) Hills, J. G. 1975, Nature, 254, 295
- Jiang et al. (2016) Jiang, N., Dou, L., Wang, T., et al. 2016, ApJ, 828, L14
- Jiang et al. (2017) Jiang, N., Wang, T., Yan, L., et al. 2017, ApJ, 850, 63
- Jiang et al. (2019) Jiang, N., Wang, T., Mou, G., et al. 2019, ApJ, 871, 15
- Jiang et al. (2021) Jiang, N., Wang, T., Dou, L., et al. 2021, ApJS, 252, 32.
- Jonker et al. (2020) Jonker, P., Stone, N., Generozov, A., van Velzen, S., & Metzger, B. 2020, ApJ, 889, 166
- Kalberla et al. (2005) Kalberla, P. M., Burton, W., Hartmann, D., et al. 2005,A&A, 440, 775
- Komossa & Bade (1999) Komossa, S. & Bade, N. 1999,A&A, 343, 775
- Komossa et al. (2008) Komossa, S., Zhou, H., Wang, T. G., et al. 2008, ApJ, 678
- Komossa (2015) Komossa, S. 2015, Journal of High Energy Astrophysics, 7, 148
- Kormendy & Ho (2013) Kormendy, J. & Ho, L. C. 2013, ARA&A, 51, 511
- Lamastra et al. (2009) Lamastra, A., Bianchi, S., Matt, G., et al. 2009, A&A, 504, 73.
- Lin et al. (2017a) Lin, D., Godet, O., Ho, L. C., et al. 2017a, MNRAS, 468, 783
- Lin et al. (2017b) Lin, D., Guillochon, J., Komossa, S., et al. 2017b, Nature Astronomy, 1, 0033
- Lin et al. (2018) Lin, D., Strader, J., Carrasco, E. R., et al. 2018, Nature Astronomy, 2, 656
- Lin et al. (2020) Lin, D., Strader, J., Romanowsky, A. J., et al. 2020, ApJ, 892, L25.
- Lu et al. (2016) Lu, W., Kumar, P., & Evans, N. J. 2016, MNRAS, 458, 575
- Lodato & Rossi (2011) Lodato, G. & Rossi, E. M. 2011, MNRAS, 410, 359
- MacLeod et al. (2012) MacLeod, M., Guillochon, J., & Ramirez-Ruiz, E. 2012, ApJ, 757, 134
- Maksym et al. (2014) Maksym, W. P., Lin, D., & Irwin, J. A. 2014, ApJ, 792, L29
- Mineo et al. (2012) Mineo, S., Gilfanov, M., & Sunyaev, R. 2012,MNRAS, 426, 1870
- Park et al. (2006) Park, T., Kashyap, V., Siemiginowska, A., et al. 2006, ApJ, 652, 610
- Phinney (1989) Phinney E. S., 1989, in Morris M., ed., IAU Symp. Vol. 136, Manifestationsof a Massive Black Hole in the Galactic Center. Kluwer, Dordrecht, p. 543
- Rees (1988) Rees, M. J. 1988, Nature, 333, 523
- Saxton et al. (2020) Saxton, R., Komossa, S., Auchettl, K., & Jonker, P. 2020, Space Sci. Rev., 216, 1
- Shiokawa et al. (2015) Shiokawa, H., Krolik, J. H., Cheng, R. M., et al. 2015, ApJ, 804, 85.
- Shu et al. (2018) Shu, X., Wang, S. S., Dou, L., et al. 2018, ApJ, 857
- Vaughan et al. (2004) Vaughan, S., Edelson, R., & Warwick, R. 2004, MNRAS, 349, L1
- van Velzen et al. (2016) van Velzen, S., Mendez, A. J., Krolik, J. H., & Gorjian, V. 2016, ApJ, 829, 19
- Wang et al. (2011) Wang, T.-G., Zhou, H.-Y., Wang, L.-F., Lu, H.-L., & Xu, D. 2011, ApJ, 740, 85
- Wang et al. (2012) Wang, T.-G., Zhou, H.-Y., Komossa, S., et al. 2012, ApJ, 749, 115
- Wang et al. (2018) Wang, T., Yan, L., Dou, L., et al. 2018, MNRAS, 477, 2943
- Xiao et al. (2011) Xiao, T., Barth, A. J., Greene, J. E., et al. 2011, ApJ, 739, 28
- Yang et al. (2013) Yang, C.-W., Wang, T.-G., Ferland, G., et al. 2013, ApJ, 774, 46