Electron temperature fluctuations in Seyfert galaxies
Abstract
We use Gemini GMOS-IFU observations of three luminous nearby Seyfert galaxies (Mrk 79, Mrk 348 and Mrk 607) to estimate the electron temperature () fluctuations in the inner 0.4–1.1 kpc region of these galaxies. Based on determinations through the [O iii]/ emission line ratio of each spaxel, temperature variations are quantified by computing the integrated value of the temperature fluctuation parameter () projected in the plane of the sky , for the first time in Active Galactic Nuclei. We find values of 0.135, 0.039, and 0.015 for Mrk 79, Mrk 348, and Mrk 607, respectively, which are of the same order or larger than the maximum values reported in star-forming regions and planetary nebulae. Taking into account that should be considered a lower limit of the total in the nebular volume, the results suggest that the impact of such fluctuations on chemical abundance determinations can be important in some AGNs.
keywords:
galaxies: Seyfert – galaxies: active – galaxies: abundances – galaxies: ISM1 Introduction
Metal abundance determinations in the gas phase of line emitting objects, such as star-forming regions (SFs), Planetary Nebulae (PNs) and Active Galactic Nuclei (AGNs), play a key role in the studies of chemical enrichment of the interstellar medium (ISM) and of the cosmic evolution of the Universe. Therefore, along decades several efforts have been made in developing methods to derive the chemical abundance and metallicity in these objects.
There is consensus that, for SFs and PNs, reliable metal abundance determinations are those based on direct determination of the electron temperature (), which is obtained through the measurements of auroral lines sensitive to , for instance, [O iii]4363, [N ii]5755 and [S iii]6312. This approach is called the -method (for a review see Peimbert et al. 2017; Pérez-Montero 2017) and it has been used to directly determine the chemical abundance of thousands of local SFs (e.g. Smith 1975; Torres-Peimbert et al. 1989; van Zee et al. 1998; Kennicutt et al. 2003; Hägele et al. 2008; Zurita & Bresolin 2012; Berg et al. 2020, among others) as well as for some objects at high redshifts (; e.g. Sanders et al. 2016, 2020; Gburek et al. 2019). There is considerable observational evidence that supports the reliability of -method, such as, for example, the agreement between oxygen abundances obtained for SFs located in the solar neighborhood and those obtained from observations of the weak interstellar O i1356 line towards stars (see Pilyugin 2003 and references therein), as well as between oxygen abundances obtained for SFs and B-type stars in the Milky Way and other nearby galaxies (see Toribio San Cipriano et al. 2017 and references therein).
However, abundance determinations using the -method are subject to some caveats. It is worth to state from the onset that, Peimbert (1967) proposed the presence of electron temperature fluctuations in H ii regions. In that work, temperatures based on collisionally excited lines (CELs), i.e. [O iii](4949+5007)/4363, from the SFs M 8, M 17 and Orion Nebulae were found to be 2000-4000 K higher than those determined from the Balmer continuum and radio observations (see also García-Rojas & Esteban 2007). Thereafter, Peimbert & Costero (1969) reported that temperature variations over the observed volume of the nebula, if not taken into account, produce underestimated gaseous abundances derived through intensity ratios of CELs using the -method.
In fact, carbon and oxygen abundances derived from faint optical recombination lines (ORLs) (almost independent from ) of SFs are higher by a factor of 0.2-0.4 dex than those derived from the -method (e.g. Tsamis et al. 2003; Esteban et al. 2004; Peimbert et al. 2005; García-Rojas et al. 2006). This is known as the abundance discrepancy problem and several scenarios have been proposed to explain it (for a review see García-Rojas & Esteban 2007). If this discrepancy is due to presence of electron temperature fluctuations (quantified by the parameter), as suggested by Peimbert & Costero (1969), large variations of along gaseous nebulae could be derived to a level of (e.g. García-Rojas & Esteban 2007). However, observations of SFs over decades have failed to find direct evidence for such high levels of electron temperature fluctuations. A discrete estimation of in the plane of the sky, , can be obtained when one has point-to-point determinations of of a given nebula. Strictly speaking, should be considered a lower limit to because this last parameter, by definition, is integrated over the volume of the considered region (see further argumentation given by Rubin et al. 2003 and Mesa-Delgado et al. 2008). Using this approximation and temperature measurements based on the [O iii](4959+ line ratio, Krabbe & Copetti (2002) found , or equivalently a temperature dispersion of only 5 % in the 30 Doradus Nebula. Other estimates of for extragalactic SFs have derived similar low values of this parameter (Tsamis et al., 2003; Oliveira et al., 2008). Rubin et al. (2003), by using Hubble Space Telescope (HST/STIS) long-slit spectroscopy of the Orion Nebula, found varying from 0.006 to 0.018. Recent radio observations in different zones of the Orion Nebula by Wilson et al. (2015) revealed only spatial variations in of the order of 13 %. Moreover, a low value of 0.005 was found from photoionization model simulations for SFs by Copetti (2006).
Hitherto, the -method has been used to estimate the elemental abundances of oxygen and nitrogen for few AGNs (see Alloin et al. 1992; Izotov & Thuan 2008; Dors et al. 2015; Dors et al. 2017; Flury & Moran 2020; Dors et al. 2020b), which are mostly based on photoionization models (see Dors et al. 2020a and references therein). Gaseous abundance determinations in AGNs through ORLs are not available in the literature, mainly because these lines are extremely faint and are only accessible in nearby objects. In particular, Dors et al. (2020b) showed that O/H estimates based on -method in the Narrow Line Regions (NLRs) of AGNs are underestimated by an average factor of about 0.2 dex in comparison with those derived from detailed photoionization models, where the discrepancy is more pronounced (reaching dex) for the low metallicity regime [ or ].
In contrast to SFs, only a few studies have addressed the electron temperature structure in AGNs. For example, Revalski et al. (2018a); Revalski et al. (2018b) found no systematic electron temperature variation along the radius of three nearby AGNs using long slit spectroscopy. On the other hand, electron temperature maps for the inner kpc of luminous Seyfert galaxies, derived using the [O iii](4959+ line ratio measured from integral field spectroscopy, show values varying from 8 000 to 30 000 K (Riffel et al., 2021). These findings demonstrate – for the first time – that large spatial variations of are present in AGNs, providing a unique opportunity to explore the effects of on abundance determinations in this object class, which is a benchmark to study the properties of distant galaxies and the high-redshift Universe.
Although temperature fluctuations have been quantified for SFs and PNs, this is the first study aimed at studying such fluctuations in AGNs. We present a study on the electron temperature fluctuations in three Seyfert galaxies (Mrk 79, Mrk 348 and Mrk 607) using 2D spectroscopy data presented by Riffel et al. (2021). The data present high-spatial and spectral resolution spectra and will provide detailed information about the spatial distribution of the physical properties of these galaxies. In Section 2, we describe the data and methodology, in Sect. 3 we present our results and Sect. 4 is aimed to evaluate the electron temperature fluctuations. Finally, the conclusions are presented in Sect. 5.
2 Observational data
We use optical emission-line flux distributions to map the electron density and electron temperature in the kpc inner central region of Mrk 79, Mrk 348 and Mrk 607, three luminous nearby Seyfert galaxies. These objects were selected from Freitas et al. (2018) by presenting extended [O iii]4363 emission (see Riffel et al., 2021).
The data were obtained with the Gemini Multi-Object Spectrograph (GMOS, Allington-Smith et al., 2002) Integral Field Unit (IFU), covering the spectral range from 4300 to 7100 Å with a velocity resolution of 90 km s-1 (estimated by measuring the full width at half-maximum, FWHM, of emission-line profiles of the CuAr calibration lamp, used to wavelength calibrate the data) and spatial resolutions of 110–280 pc (estimated as the FWHM of the continuum flux distribution of field stars from the acquisition images). The data reduction procedure is described in Freitas et al. (2018) whereby the standard procedures using the gemini.iraf package were followed. Here, we use the emission-line flux distributions measured by Riffel et al. (2021), who used the ifscube python package (Ruschel-Dutra, 2020) to investigate the variations of the electron temperature in the NLRs of the three Seyfert galaxies. Table 1 presents the basic information of the three galaxies.
| Object | Nuc. Act. | log | Exp. Time | Spat. Res. | |
|---|---|---|---|---|---|
| (erg s-1) | (sec) | (pc) | |||
| Mrk 79 | 0.0222 | Sy 1 | 45.0 | 6810 | 28030 |
| Mrk 348 | 0.0150 | Sy 2 | 45.3 | 6810 | 19025 |
| Mrk 607 | 0.0089 | Sy 2 | 43.4 | 7810 | 11014 |
We recompute the electron temperatures using the PyNeb routine (Luridiana et al., 2015) and the and emission-line intensity ratios from Riffel et al. (2021). For the highest temperatures ( K), the PyNeb based measurements are expected to be more accurate than those based on the equation from Hägele et al. (2008) assumed in Riffel et al. (2021), as the range of temperatures used to derive this equation originally does not include high temperatures. First, we compute the electron density () values for each spaxel using the [S ii] line ratio and assuming K; then we calculate the electron temperature assuming the values obtained for each spaxel. Although the [S ii] emission arises from low ionization degree and partially-ionized zones and the [O iii] emission traces fully ionized and perhaps higher density zones, the dependence of on the adopted appears to be negligible.

3 Results
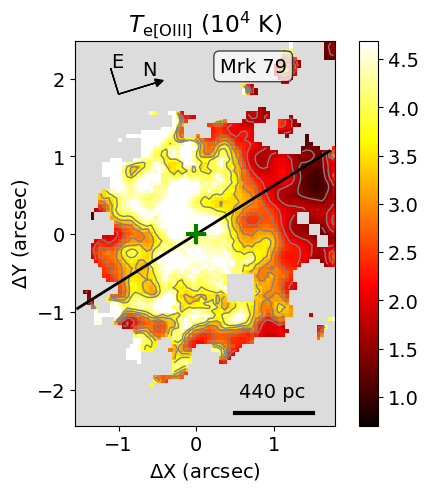
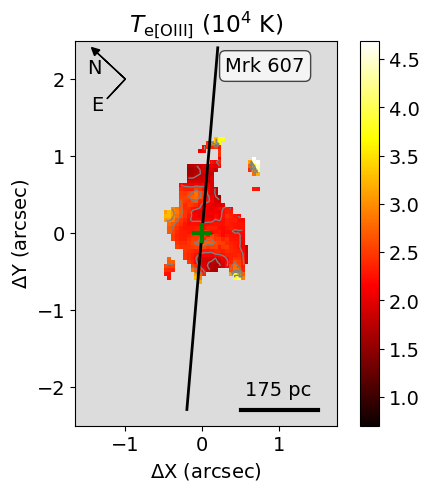
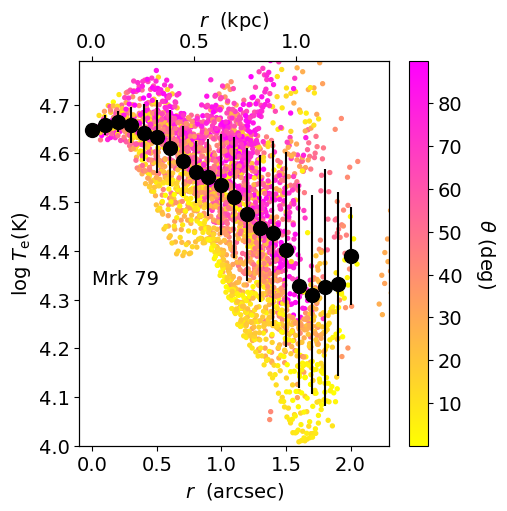
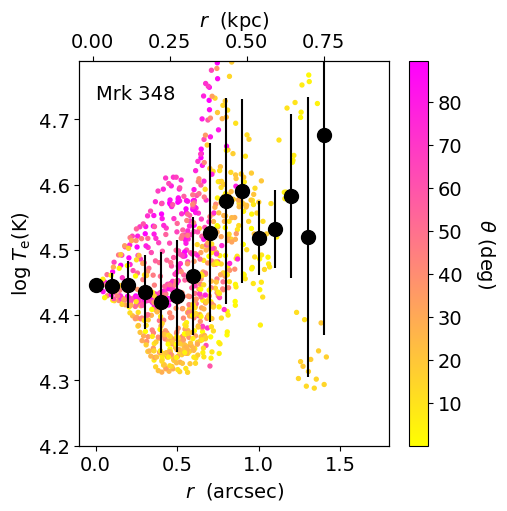
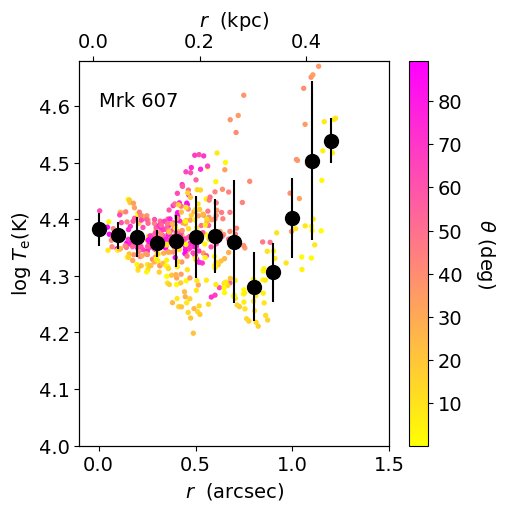
The electron density maps for Mrk 79, Mrk 348 and Mrk 607 were already shown in Riffel et al. (2021). The values range from 100 cm-3 to cm-3. These values are in the range of densities reported for the central region of nearby active galaxies (e.g. Kakkad et al., 2018; Freitas et al., 2018). The electron temperature maps for Mrk 79, Mrk 348 and Mrk 607 are shown in Fig. 1. These maps are consistent with those presented in Riffel et al. (2021) based on the equation from Hägele et al. (2008), but as pointed out in Sec. 2, the PyNeb based values are more accurate for the highest temperature values. The values in these galaxies are notably higher than those found in SFs (e.g. Kennicutt et al. 2003; Hägele et al. 2008) and in PNs (e.g. Krabbe & Copetti 2005; Sandin et al. 2008; Rauber et al. 2014; Monreal-Ibero & Walsh 2020), which are in the order of 10 000-15 000 K. The highest values are derived in regions away from the AGN ionization axis in all galaxies. This behaviour is clearly seen in Fig. 2, a plot of versus the distance to the nucleus, where the points are color coded in according to the angle () between the position of each spaxel and the orientation of the AGN ionization axis (indicated in Fig. 1). The values along the AGN ionization axis are similar to those obtained using long slit spectroscopy and predicted by photoionization models, i.e. in the range 10 000 – 25 000 K (Revalski et al., 2018a; Revalski et al., 2018b, 2021). However, the highest values ( K) are derived outside the AGN ionization axis, originated probably by shock ionization rather than photoionization (Riffel et al., 2021). The wide range of temperature variations derived in the galaxies studied here is consistent with the [O iii]4363/[O iii]5007 map for NGC 1068 shown by D’Agostino et al. (2019), which presents values in the range , corresponding to temperatures of 15 000 – 40 000 K, as obtained using the PyNeb routine and assuming cm-3. Our results indicate the presence of large spatial variations of electron temperature in the gas phase of AGNs, not observed in SFs and PNs.
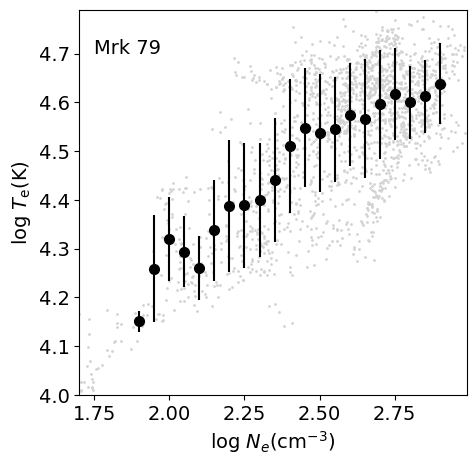
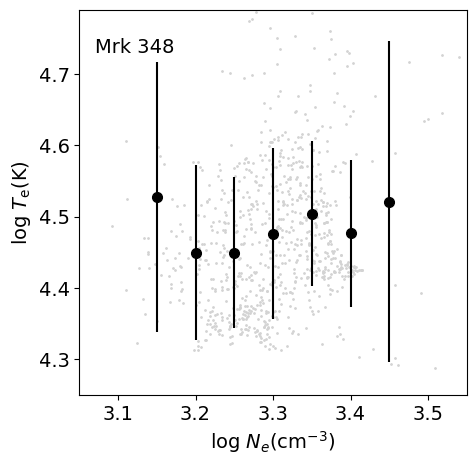
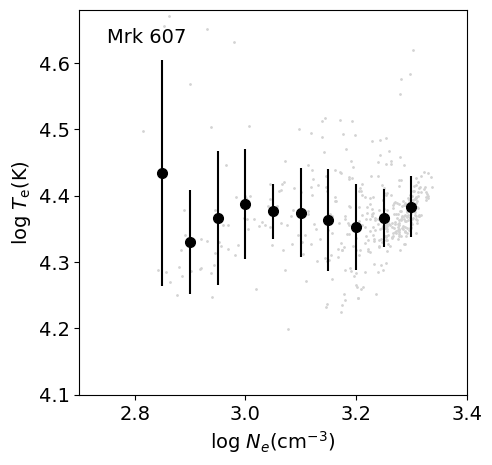
In Fig. 3 we show plots of versus for Mrk 79 (left), Mrk 348 (middle) and Mrk 607 (right). The filled circles show the values within bins of . A clear correlation between and is observed for Mrk 79, while no correlations are seen for Mrk 348 and Mrk 607. Similar correlations are found in ring-shaped PNs by Krabbe & Copetti (2005). A possible interpretation for the correlation seen in Mrk 79 is that the lower and , seen along the AGN ionization axis, are mainly due to photoionization by the AGN radiation, while the increase of the values of these properties with the distance to the ionization axis indicates a larger contribution of emission of compressed shock-ionized gas.
4 Electron temperature fluctuations and implications
According to Peimbert & Costero (1969), the temperature fluctuations over the observed gas phase volume () of a nebula can be quantified in terms of the mean electron temperature () and the parameter, which are defined as
| (1) |
and
| (2) |
where is the density of the ion used to measure the temperature. A direct estimate of along the line-of-sight can not be obtained from our data, but we can estimate projected in the plane of the sky () – as well as its associated – using the equations given by:
| (3) |
and
| (4) |
where and are the electron temperature and its uncertainty in each spaxel, respectively. We use 1/ as a weighting factor of the point-to-point temperature instead of (as in Rubin et al. 2003 or Mesa-Delgado et al. 2008) for various reasons. Firstly, because is determined from a [S ii] line ratio, and this indicator may not be representing well the density – and density variations – within the O++ zone in a huge and complex object as an AGN host. Secondly, as it has been seen in Sect. 3, the spaxels with higher values – and with a larger contribution of shock excitation – tend to be located in the regions away from the AGN ionization axis in all galaxies, and these correspond to the faintest zones. Since the emissivity of recombination or collisionally excited lines of typical ionized nebulae are proportional to the factor, lines affected by shock excitation are very much dependent on shock velocity and other geometrical and physical aspects of the interaction. The factor 1/ is basically proportional to the signal-to-noise ratio of the auroral [O iii]4363 line, therefore, in this case, we think it is a better choice for weighting the contribution of each spaxel to define .
The and values derived for the three galaxies are listed in the third and fourth columns of Table 2. These parameters are calculated assuming the full area with [O iii]4363 line detected above a 3 level. The electron temperature calculated by summing up the fluxes of all spaxels where the [O iii]4363 is detected – – is also included in the second column of Table 2. These quantities may be considered as representative of each entire object. The values we find are 0.135, 0.039, and 0.015 for Mrk 79, Mrk 348, and Mrk 607, respectively, implying spatial variations of between 12 and 37%. The found in the AGNs studied here are of the order or even much higher (up to a factor about 7) than the maximum values derived in observational studies of extragalactic SFs (e.g. Krabbe & Copetti, 2002; Oliveira et al., 2008), the Orion Nebula (e.g. Rubin et al., 2003; Mesa-Delgado et al., 2008) or PNe (e.g. Krabbe & Copetti, 2005; Rauber et al., 2014). Our results suggest that the potential impact of on abundance determinations based on the -method may be important for some AGN hosts.
| Object | |||
|---|---|---|---|
| ( K) | ( K) | ||
| Mrk 79 | 3.74 | 3.00 | 0.135 |
| Mrk 348 | 2.88 | 2.79 | 0.039 |
| Mrk 607 | 2.40 | 2.36 | 0.015 |
5 Conclusions
We have studied the temperature fluctuations in the inner 0.4–1.1 kpc region of three nearby Seyfert galaxies: Mrk 79, Mrk 348, and Mrk 607. In particular, for Mrk 79, an AGN with strong ionized outflows, we derive a direct relation between electron temperature and electron density, possibly caused by compressed shock-ionized gas. The temperature fluctuations are quantified by the parameter, which is derived in the range of 0.015 – 0.135, of the order or even larger than the maximum values obtained for galactic and extragalactic star forming regions (H ii regions) and for planetary nebulae. Therefore, the effect of temperature fluctuations may be important in gas phase abundance estimates in AGNs based on -method.
Acknowledgements
We thank an anonymous referee for their critical reading and suggestions that helped us to improve our paper. R.A.R. acknowledges support from Conselho Nacional de Desenvolvimento Científico e Tecnológico (CNPq) and Fundação de Amparo à Pesquisa do Estado do Rio Grande do Sul (FAPERGS). O.L.D. and A.K. acknowledge support from CNPq and Fundação de Amparo à Pesquisa do Estado de São Paulo (FAPESP). C.E. acknowledges support from the Agencia Estatal de Investigación del Ministerio de Ciencia e Innovación (AEI-MCINN) under grant Espectroscopía de campo integral de regiones H ii locales. Modelos para el estudio de regiones H ii extragalácticas with reference 10.13039/501100011033. Based on observations obtained at the Gemini Observatory, which is operated by the Association of Universities for Research in Astronomy, Inc., under a cooperative agreement with the NSF on behalf of the Gemini partnership: the National Science Foundation (United States), National Research Council (Canada), CONICYT (Chile), Ministerio de Ciencia, Tecnología e Innovación Productiva (Argentina), Ministério da Ciência, Tecnologia e Inovação (Brazil), and Korea Astronomy and Space Science Institute (Republic of Korea).
Data Availability
The data used in this paper is available in the Gemini Science Archive under the project code GN-2014B-Q-87.
References
- Allington-Smith et al. (2002) Allington-Smith J., et al., 2002, PASP, 114, 892
- Alloin et al. (1992) Alloin D., Bica E., Bonatto C., Prugniel P., 1992, A&A, 266, 117
- Berg et al. (2020) Berg D. A., Pogge R. W., Skillman E. D., Croxall K. V., Moustakas J., Rogers N. S. J., Sun J., 2020, ApJ, 893, 96
- Copetti (2006) Copetti M. V. F., 2006, A&A, 453, 943
- D’Agostino et al. (2019) D’Agostino J. J., et al., 2019, MNRAS, 487, 4153
- Dors et al. (2015) Dors O. L., Cardaci M. V., Hägele G. F., Rodrigues I., Grebel E. K., Pilyugin L. S., Freitas-Lemes P., Krabbe A. C., 2015, MNRAS, 453, 4102
- Dors et al. (2017) Dors O. L. J., Arellano-Córdova K. Z., Cardaci M. V., Hägele G. F., 2017, MNRAS, 468, L113
- Dors et al. (2020a) Dors O. L., et al., 2020a, MNRAS, 492, 468
- Dors et al. (2020b) Dors O. L., Maiolino R., Cardaci M. V., Hägele G. F., Krabbe A. C., Pérez-Montero E., Armah M., 2020b, MNRAS, 496, 3209
- Esteban et al. (2004) Esteban C., Peimbert M., García-Rojas J., Ruiz M. T., Peimbert A., Rodríguez M., 2004, MNRAS, 355, 229
- Flury & Moran (2020) Flury S. R., Moran E. C., 2020, MNRAS, 496, 2191
- Freitas et al. (2018) Freitas I. C., et al., 2018, MNRAS, 476, 2760
- García-Rojas & Esteban (2007) García-Rojas J., Esteban C., 2007, ApJ, 670, 457
- García-Rojas et al. (2006) García-Rojas J., Esteban C., Peimbert M., Costado M. T., Rodríguez M., Peimbert A., Ruiz M. T., 2006, MNRAS, 368, 253
- Gburek et al. (2019) Gburek T., et al., 2019, ApJ, 887, 168
- Hägele et al. (2008) Hägele G. F., Díaz Á. I., Terlevich E., Terlevich R., Pérez-Montero E., Cardaci M. V., 2008, MNRAS, 383, 209
- Ichikawa et al. (2017) Ichikawa K., Ricci C., Ueda Y., Matsuoka K., Toba Y., Kawamuro T., Trakhtenbrot B., Koss M. J., 2017, ApJ, 835, 74
- Izotov & Thuan (2008) Izotov Y. I., Thuan T. X., 2008, ApJ, 687, 133
- Kakkad et al. (2018) Kakkad D., et al., 2018, A&A, 618, A6
- Kennicutt et al. (2003) Kennicutt Robert C. J., Bresolin F., Garnett D. R., 2003, ApJ, 591, 801
- Krabbe & Copetti (2002) Krabbe A. C., Copetti M. V. F., 2002, A&A, 387, 295
- Krabbe & Copetti (2005) Krabbe A. C., Copetti M. V. F., 2005, A&A, 443, 981
- Luridiana et al. (2015) Luridiana V., Morisset C., Shaw R. A., 2015, A&A, 573, A42
- Mesa-Delgado et al. (2008) Mesa-Delgado A., Esteban C., García-Rojas J., 2008, ApJ, 675, 389
- Monreal-Ibero & Walsh (2020) Monreal-Ibero A., Walsh J. R., 2020, A&A, 634, A47
- Oh et al. (2018) Oh K., et al., 2018, ApJS, 235, 4
- Oliveira et al. (2008) Oliveira V. A., Copetti M. V. F., Krabbe A. C., 2008, A&A, 492, 463
- Peimbert (1967) Peimbert M., 1967, ApJ, 150, 825
- Peimbert & Costero (1969) Peimbert M., Costero R., 1969, Boletin de los Observatorios Tonantzintla y Tacubaya, 5, 3
- Peimbert et al. (2005) Peimbert A., Peimbert M., Ruiz M. T., 2005, ApJ, 634, 1056
- Peimbert et al. (2017) Peimbert M., Peimbert A., Delgado-Inglada G., 2017, PASP, 129, 082001
- Pérez-Montero (2017) Pérez-Montero E., 2017, PASP, 129, 043001
- Pilyugin (2003) Pilyugin L. S., 2003, A&A, 399, 1003
- Rauber et al. (2014) Rauber A. B., Copetti M. V. F., Krabbe A. C., 2014, A&A, 563, A42
- Revalski et al. (2018a) Revalski M., Crenshaw D. M., Kraemer S. B., Fischer T. C., Schmitt H. R., Machuca C., 2018a, ApJ, 856, 46
- Revalski et al. (2018b) Revalski M., et al., 2018b, ApJ, 867, 88
- Revalski et al. (2021) Revalski M., et al., 2021, arXiv e-prints, p. arXiv:2101.06270
- Riffel et al. (2021) Riffel R. A., et al., 2021, MNRAS, 501, L54
- Rubin et al. (2003) Rubin R. H., Martin P. G., Dufour R. J., Ferland G. J., Blagrave K. P. M., Liu X. W., Nguyen J. F., Baldwin J. A., 2003, MNRAS, 340, 362
- Ruschel-Dutra (2020) Ruschel-Dutra D., 2020, danielrd6/ifscube v1.0, doi:10.5281/zenodo.3945237, https://doi.org/10.5281/zenodo.3945237
- Sanders et al. (2016) Sanders R. L., et al., 2016, ApJ, 825, L23
- Sanders et al. (2020) Sanders R. L., et al., 2020, MNRAS, 491, 1427
- Sandin et al. (2008) Sandin C., Schönberner D., Roth M. M., Steffen M., Böhm P., Monreal-Ibero A., 2008, A&A, 486, 545
- Schmitt et al. (2003) Schmitt H. R., Donley J. L., Antonucci R. R. J., Hutchings J. B., Kinney A. L., 2003, ApJS, 148, 327
- Smith (1975) Smith H. E., 1975, ApJ, 199, 591
- Toribio San Cipriano et al. (2017) Toribio San Cipriano L., Domínguez-Guzmán G., Esteban C., García-Rojas J., Mesa-Delgado A., Bresolin F., Rodríguez M., Simón-Díaz S., 2017, MNRAS, 467, 3759
- Torres-Peimbert et al. (1989) Torres-Peimbert S., Peimbert M., Fierro J., 1989, ApJ, 345, 186
- Tsamis et al. (2003) Tsamis Y. G., Barlow M. J., Liu X. W., Danziger I. J., Storey P. J., 2003, MNRAS, 338, 687
- Wilson et al. (2015) Wilson T. L., Bania T. M., Balser D. S., 2015, ApJ, 812, 45
- Zurita & Bresolin (2012) Zurita A., Bresolin F., 2012, MNRAS, 427, 1463
- van Zee et al. (1998) van Zee L., Salzer J. J., Haynes M. P., O’Donoghue A. A., Balonek T. J., 1998, AJ, 116, 2805