Supporting Information for Crystal growth in confinement
Abstract
This PDF file includes:
Captions for Movies S1 to S6
Materials and Methods
Supplementary Text
Figs. S1 to S7
Other Supplementary Materials for this manuscript include the following:
Movies S1 to S6
Movies
Movie S1
Single molecular layers nucleated and propagating over crystal surface at low supersaturation () and low nucleation rate. Timelapse movie of average subtracted RICM images at 0.1 s interval. The dark areas correspond to a smaller distance to the confining glass and thus to the newly formed single molecular layer 0.33 nm thick. The four nucleation events originate at different locations. The crystal is m.
Movie S2
Single atomic layers nucleated and propagating over crystal surface creating concentration gradient and tending towards cavity formation. Timelapse movie of average subtracted RICM images at 0.1 s interval. The dark areas correspond to a smaller distance to the confining glass and thus to the newly formed single molecular layer 0.33 nm thick. Same crystal as in Movie S1 and Fig. S4 with . Due to higher nucleation rate than in Movie S1 the diffusion of ions does not replenish ion concentration at the centre resulting in a concentration gradient from edge to centre. Due to the concentration gradient nucleation centres are located at the crystal edge and the molecular layer step flow is slower towards the centre than along the edges. Fluctuations in nucleation frequency causes fluctuations in concentration gradient and stability of cavity.
Movie S3
Fluctuations in nucleation and cavity formation. Timelapse movie of average subtracted RICM images at 1 m interval. Same crystal as in Movies S1 and S2 and Fig. S4 A and B at . The crystal size increases during the movie thus increasing the diffusion time and the criterium for cavity formation is fulfilled: . Fluctuations in nucleation frequency causes fluctuations in the stability of the cavity. A cross-section versus time of this movie is displayed in Fig S4.
Movie S4
Step front instability. Timelapse movie of average subtracted RICM images of corner of a 700x700 m2 large crystal with =0.053 and =22 nm. The dark areas correspond to a smaller distance to the confining glass and thus to the newly formed single molecular layer 0.33 nm thick, showing instabilities at the front. The four instable fronts propagate in the fast direction and display fingers that do not cover the entire surface move at constant velocity while a slow (and slowing down), diffusion controlled front fills the layer between the fingers. Some images from this movie are shown in Figs. 4 and S5.
Movie S5
Spiral growth on a nanoconfined growth rim. Timelapse movie of average subtracted RICM images at 1 s interval. The oval regions of different intensity are molecular layers 0.33 nm in height each. Images in this movie are also displayed in Fig. 3. The top and right hand side of the movie is the crystal edge and trhe grey area at bottom left is the cavity inside the growth rim. One observes that every second layer has different propagation velocity and shape due to the different (rotated 180 degrees) kinetic anisotropy ratios of the two half layers constituting a unit cell of the crystal.
Movie S6
Corner of calcite crystal 30 nm above confining glass surface in water with 0.8 mM CaCO3 concentration () imaged once every minute for 90 minutes. The waves moving from bottom left to top right are interference contrast of growth steps propagating on the confined surface.
Estimation of disjoining pressure in crystal-spacer contacts
When two surfaces approach each other the liquid film between the surfaces can support a normal stress without being squeezed out Israelachvili (2011). This is termed the disjoining pressure of the fluid film on the solid surfaces. In the nanometer range where the disjoining pressure is probed in our experiments, van der Waals forces are negligible. The electric double layer contribution dominates and scales with the Debye length and at small fluid film thickness (1-5 molecular layers) there are so-called steric repulsive forces that increase rapidly with decreasing distance . In order to squeeze out the last 2-3 molecular layers of water, pressures of the order 1 GPa are required Israelachvili (2011). Thus at high ion concentration one expects the fluid film thickness to be in the range 0.8-1.6 nm for all pressures in the range 0.1 MPa to 1 GPa. Even though the liquid can support a normal pressure it still behaves like a fluid in the sense that diffusion is almost as fast as in bulk until the liquid film thickness is reduced to 2 molecular layers Mutisya et al. (2017).
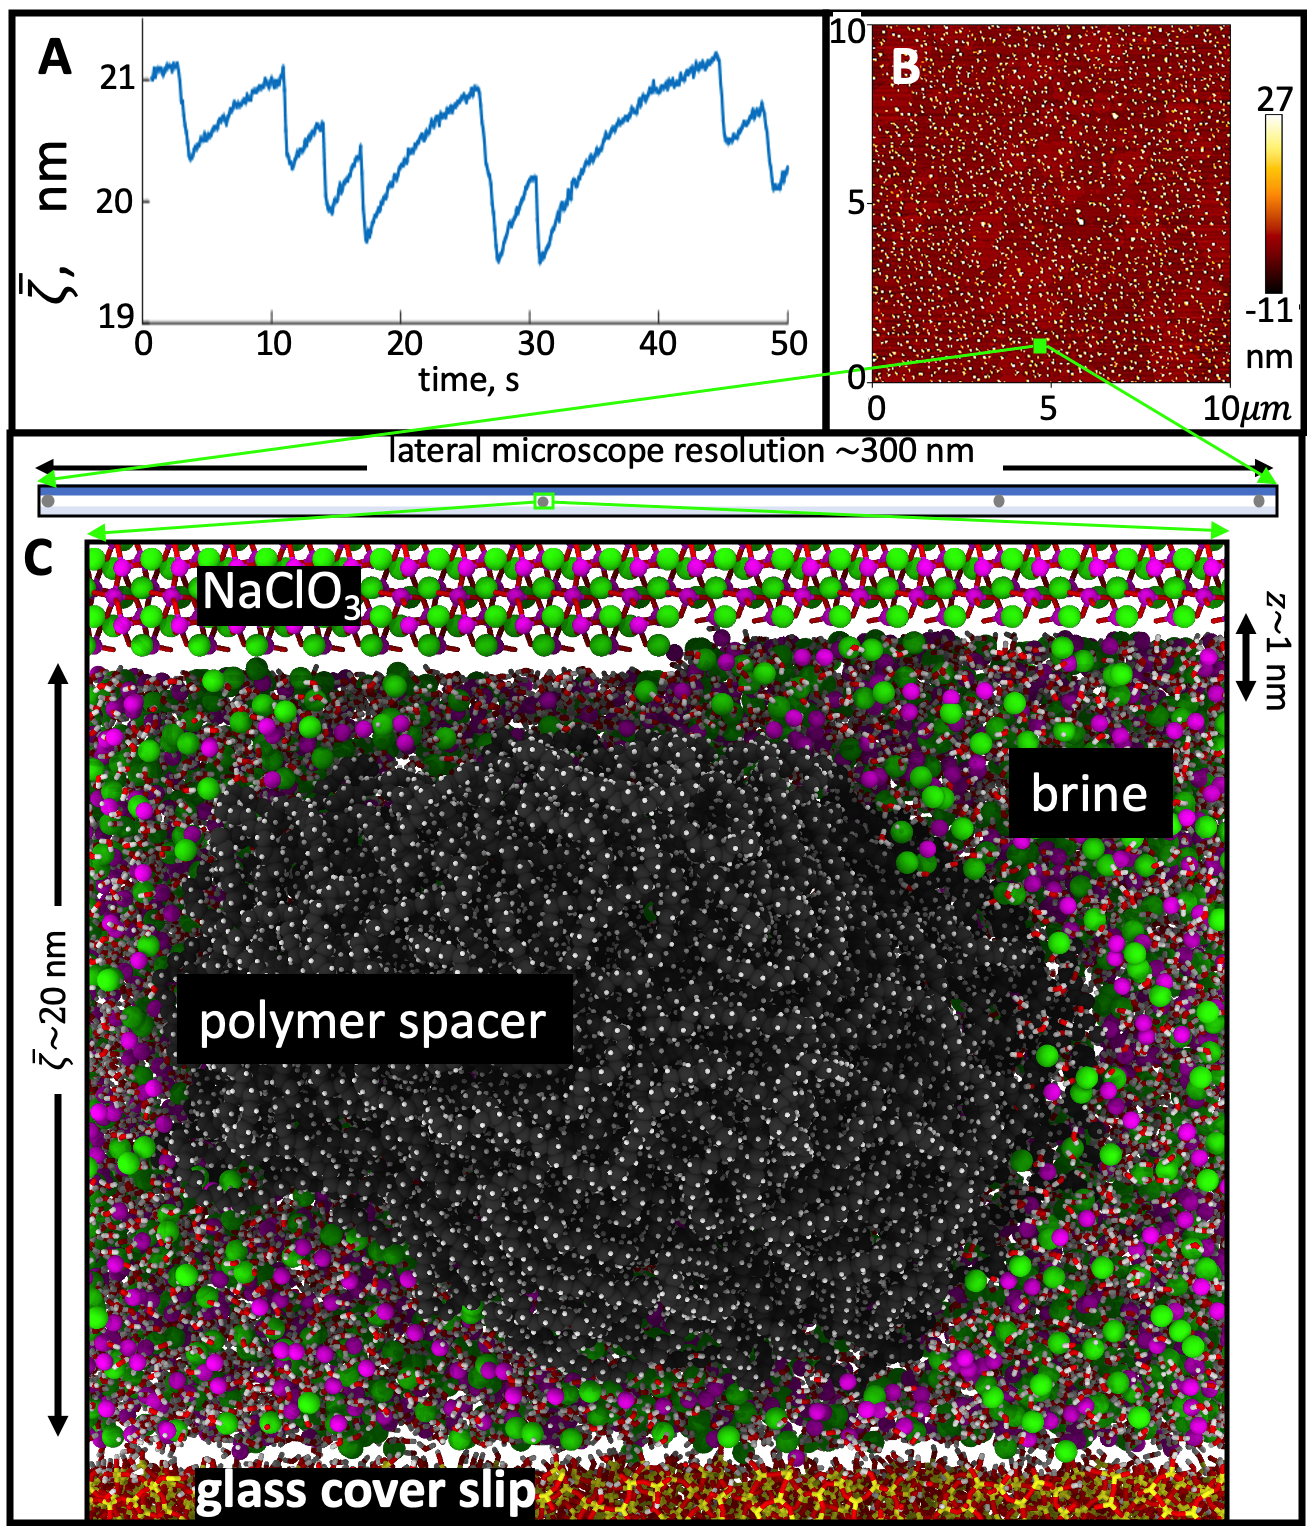
In our experiments the growing crystals are resting on small spacers that keep the distance between the growing crystal and the supporting glass surface between 10 and 130 nm. If there were no spacers the equilibrium distance would be of the order 1 nm. This would make the optical contrast of the RICM technique too low to accurately measure height differences and the rate of ion transport by diffusion would be a factor 30-1000 lower, thus halting the process we wish to study. Figure S2 shows the distribution and height of spacers measured by AFM, the change of when a molecular layer is grown and the relaxation back to the equilibrium distance and an illustration of the step flow through the contact between a spacer and the crystal. The relaxation back to the equilibrium distance demonstrates clearly that the crystal is supported by the disjoining pressure in the fluid film in the contacts with the spacers.
The contact (disjoining) pressure can be estimated by noting that a cap of about 1 nm height of the spacer will contribute as support for the fluid film. Thus for an average spacer size of assumed spherical shape of diameter 20 nm the supporting area is m2. The NaClO3 crystals of linear size are typically half as high as wide, thus their volume are . The density difference of the crystal and the saturated solution is 1100 kg/m3. The equilibrium pressure in the contact can then be estimated as
| (1) |
where is the ratio of crystal area to contact area. This ratio can be estimated from Figure S2 B where m m2 and there are 1848 spacer particles. The real, unknown number of contacts depends on the size distribution and stiffness of the spacer particles. The area ratio is then . It follows that for a typical crystal size used in our experiments, m the disjoining pressure in the spacer-crystal contacts are in the range Pa. This indicates that even if the crystal is supported by only 3 spacer particles the contact pressure is only about one atmosphere, well below the pressure necessary to squeeze the fluid film thickness to only 1-2 molecular layers.
We may use the relaxation of the fluid film thickness between the top of particles and the crystal towards the equilibrium distance to probe the disjoining pressure further. Growth of a new layer reduces the fluid film thickness by 0.66 nm. Excess disjoining pressure , pushes the crystal back towards the equilibrium distance, while viscous drag of fluid flowing between the crystal and the support opposes the vertical motion. We may assume that the disjoining pressure, , at these distances is an exponential function of distance:
| (2) |
where is the Debye length. Since the crystal moves as a whole, the change of the average distance between the crystal and the glass substrate is equal to the change in the film thickness at the top of particles: . A circular plate of radius at distance from another surface that is subjected to a disjoining pressure at the contacts will have the vertical velocity
| (3) | |||||
| (4) | |||||
| (5) |
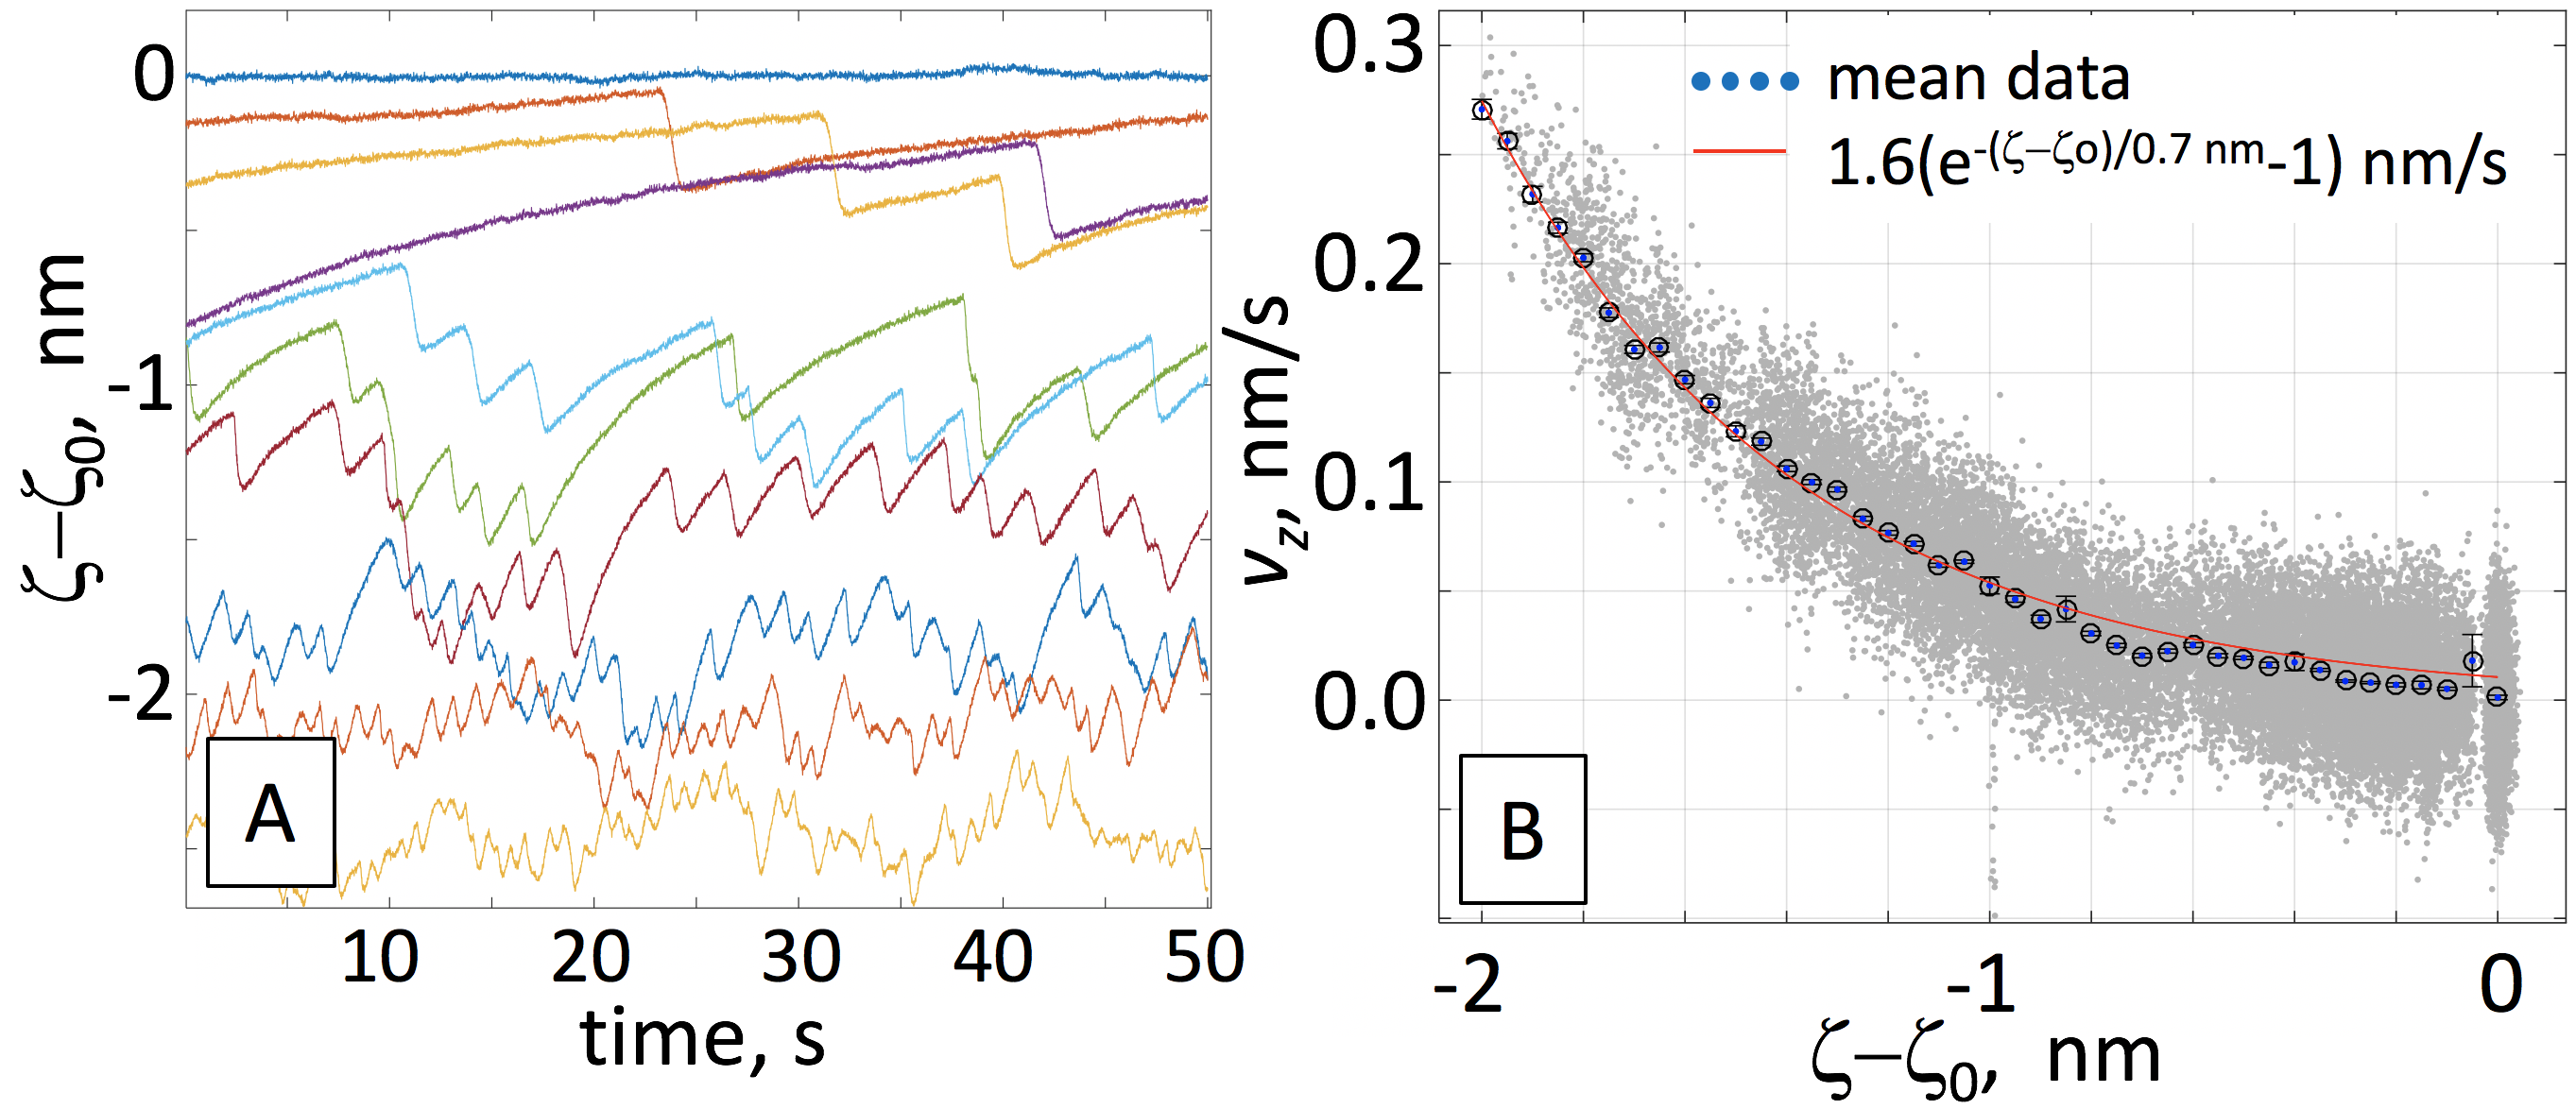
where is the viscosity, and we have used the approximation in the prefactor. The crystal in the experiment shown in Fig. S3 had m and nm. Using Pa s the predicted velocity is nm/s. For a monovalent salt at 7 molar the theoretical Debye length is 0.13 nm and the high concentration decay length has recently found to be 3 nm Smith et al. (2016).
In Fig. S3 we show the displacement curves at different nucleation rates and the agglomerated velocity - distance curve with the fit yielding the model parameters nm/s and nm. This is reasonably close to the predicted from viscous drag and the decay length is between the two estimates given above. Based on the fitted Debye length we expect the crystal and weight supporting grains to be separated by only 3-4 layers of adsorbed solution Israelachvili (2011). If the fluid film thickness approached 1 molecular crystal layer one would expect that the step flow could be pinned in the spacer-crystal contacts. In only very few experiments have we observed such pinning of the crystal growth step front by spacer particles.
Nucleation
Standard nucleation theory
The standard theory of nucleation is reported in many books and lecturenotes on crystal growth Saito (1996). In this theory, the free energy of a monolayer island is composed of two contributions. The first one is the chemical potential gain caused by the crystallization of the ions when the ionic concentration in the liquid exceeds the solubility. The second contribution is the free energy cost of the formation of the atomic step surrounding the monolayer island. Since the first contribution is proportional to the area of the island while the second is proportional to the perimeter, the second term always wins for small islands. As a consequence, there is a free energy barrier that must be surmounted in order to form the two dimensional layer. The passage over this barrier is triggered by random thermal fluctuations. Once the size of the island is larger than the critical size corresponding to the energy barrier, the islands grow irreversibly to decrease their total free energy.
We assume small supersaturations , so that the chemical potential reads
| (6) |
where the factor comes from the presence of two ions in the liquid for one molecule in the solid. If the solution is not ideal, the chemical potential is still proportional to for , but the factor can be affected when taking into account the activities of relevant species in the fluid.
Under the assumption of isotropic step properties, the rate of formation of new monolayer islands per unit facet area in the presence of a supersaturation reads
| (7) |
where
| (8) | |||||
| (9) |
We have defined the concentration (number per unit area) of initial seeds for nucleation, the orientational average of the kinetic coefficient discussed in the main text, the molecular area in a monolayer (in the case of NaClO3, we have where is the step height) and , where is the step free energy per unit length, and is the Boltzmann constant.
The two main conditions of validity of (7) are: (i) , which ensures that the nucleation energy barrier is larger than , and (ii) nothing special occurs at the molecular scale when the nucleus is composed of a small number of molecules, i.e., no extremely stable intermediate molecular configuration and no extremely slow process at the molecular scale.
Localization of nucleation
If the supersaturation is the same everywhere on the facet, then the total nucleation rate is simply where is the area of a square facet of lateral extent . Assuming that the change of the facet size is negligible between two nucleation events, as seen in experiments, the nucleation time given by the expression (7) can be fitted to the data (see Figure 2) using two free parameters: and . We then find a surface coverage of initial seeds for nucleation where is the area occupied by one molecule in the monolayer. In addition, we obtain , leading to nm.
However, in general the supersaturation is not homogeneous on the confined facet. Along the periphery of the facet, the supersaturation is expected to be constant due to continuous exchange of mass with the neighboring bulk phase. However, somewhere on the facet, the supersaturation can be lower due to the growth of some step that have consumed part of the ions in the liquid film. Such a depletion survives even after the passage of a step during a time of the order of where is the lateral size of the facet. Using ms-1, and m (as in Figure 2D), we obtain s. This timescale is of the same order as the time between two nucleation events (from to s) in the regime where there is never more than one step on the confined facet. The absence of clear separation between these two timescales prevents a quantitative prediction of the supersaturation profile, which controls the localization of nucleation close to the edge. However, a generic analysis presented below catches the essence of the localization of nucleation.
In order to investigate the influence of supersaturation gradients on the localisation of nucleation events, we consider a simplified one-dimensional geometry, with a straight facet edge, where the supersaturation is fixed to a value . We also assume that decreases monotonously up to a value at some distance from the edge. We therefore assume that the supersaturation that depends on the partial coordinate as
| (10) |
with and . We also impose that , where is a fixed number so that the supersaturation is equal to for . We would then like to evaluate the nucleation rate per unit length of facet edge in the direction
| (11) |
Since we assume a monotonically decreasing supersaturation profile, we can change variables and integrate over . In the presence of an essential singularity of the form when , and for any function that is finite and regular at (with possible algebraic divergence at ), we have:
| (12) |
when and . Hence, under the conditions
| (13) | |||||
| (14) |
the nucleation rate will be dominated by the behavior close to . Since the boundary condition implies , we obtain
| (15) |
where .
A similar analysis also allows one to determine the typical distance from the edge at which nucleation events should be observed for a given supersaturation profile:
| (16) |
Using again the same strategy as for Eq.(12), but now with a function that vanishes for , i.e. , we have for :
| (17) |
leading to
| (18) |
This leads to the simple formula
| (19) |
When nucleation is confined along the edge of the facet, the total nucleation rate is equal to where is the perimeter of the facet edge. Since the rate of nucleation is constant as long as nucleation does not occur, the probability of having no nucleation event up to the time is Poissonian:
| (20) |
Note that here, the time starts at a conventional time when the system is reset to a reference state. As a consequence, the probability density that the first nucleation occurs at time is
| (21) |
The average time for nucleation to occur is then evaluated as
| (22) | |||||
The expected value of the position of the nucleation event when it occurs is
| (23) |
We now apply Eqs.(Localization of nucleation,22) to specific forms of the supersaturation profile.
Localization with pre-existing steps on the facet.
As a first example, we aim to mimic a situation where a cavity is forming in the center of the facet. The steps at the edge of the cavity maintain the supersaturation to a lower value . Hence, is constant, or varies slowly. Assuming a steady-state saturation profile, we obtain a linear decrease of from at to at :
| (24) |
We then have
| (25) |
and . As a consequence, , leading to
| (26) | |||||
| (27) |
If varies slowly in time (i.e. varies at a time-scale larger than the time between two nucleation events), then from Eq.(22), we have
| (28) |
We also find average distance of the nucleation event
| (29) |
As expected, the since the configuration is time-independent, the location of the first nucleation event is the same as the location of a nucleation event that would occur if nucleation occurs at any arbitrary time .
These results suggest that nucleation is still be localized after the formation of the cavity in the center of the facet. Assuming a bunch of steps at a distance of about m from the edge creating a zone where , and using and , we obtain m. This is consistent with experimental observations.
Diffusion-limited relaxation of the superstaturation in the absence of other steps.
As a second example, we consider a supersaturation profile that results from the relaxation of the supersaturation profile by diffusion after the passage of a constant velocity step. We assume that the initial state is a homogeneous supersaturation for all at . At , the supersaturation is assumed to be constant and equal to at all times. The solution of the diffusion problem provides:
| (30) |
This leads to
| (31) | |||||
| (32) |
and , i.e. the supersaturation decreases to zero at . In order to use our model based on the nucleation rate (7), we need to assume that a steady-state for the distribution of monolayer island sizes explored by thermal fluctuations is reached with a time-scale that is faster than that of the evolution of the supersaturation. This assumption is not valid here, and our model therefore only provides a lower bound for the nucleation time. However, we expect our approach to catch the main features of the localization of nucleation.
Using equations (22,Localization of nucleation), we now obtain:
| (33) | |||||
| (34) |
Assuming that the variation of the perimenter and the supersaturation and are slower than the variation of , we find
We have fitted to the experimental data in Figure 2 using the expressions (7) and (34) with and as free parameters. We obtain . In addition, we find , which leads to nm. These values are close to those obtained using the expression for a homogeneous nucleation rate on the facet.
We also obtain the position of the nucleation event as:
| (36) |
Hence
| (37) |
Since this ratio is close to , we conclude that the detailed description of the time-dependence of the position of the nucleation event via the time-dependence of does not bring a significiant quantitative correction to the average position of nucleation.
We can also rewrite the result as
| (38) |
Quantitatively, we find that varies from m in s to about m in s. Assume that the supersaturation has been depleted by the passage of a step in a film of thickness nm. Then from Eq.(42), we obtain . Note that this difference is smaller, but of the same order as the supersaturation imposed at the boundary in the single-nucleation regime . We finally obtain from Eq.(38) m for a nucleation time s, and m for a nucleation time s.
Step front instability
Experiments
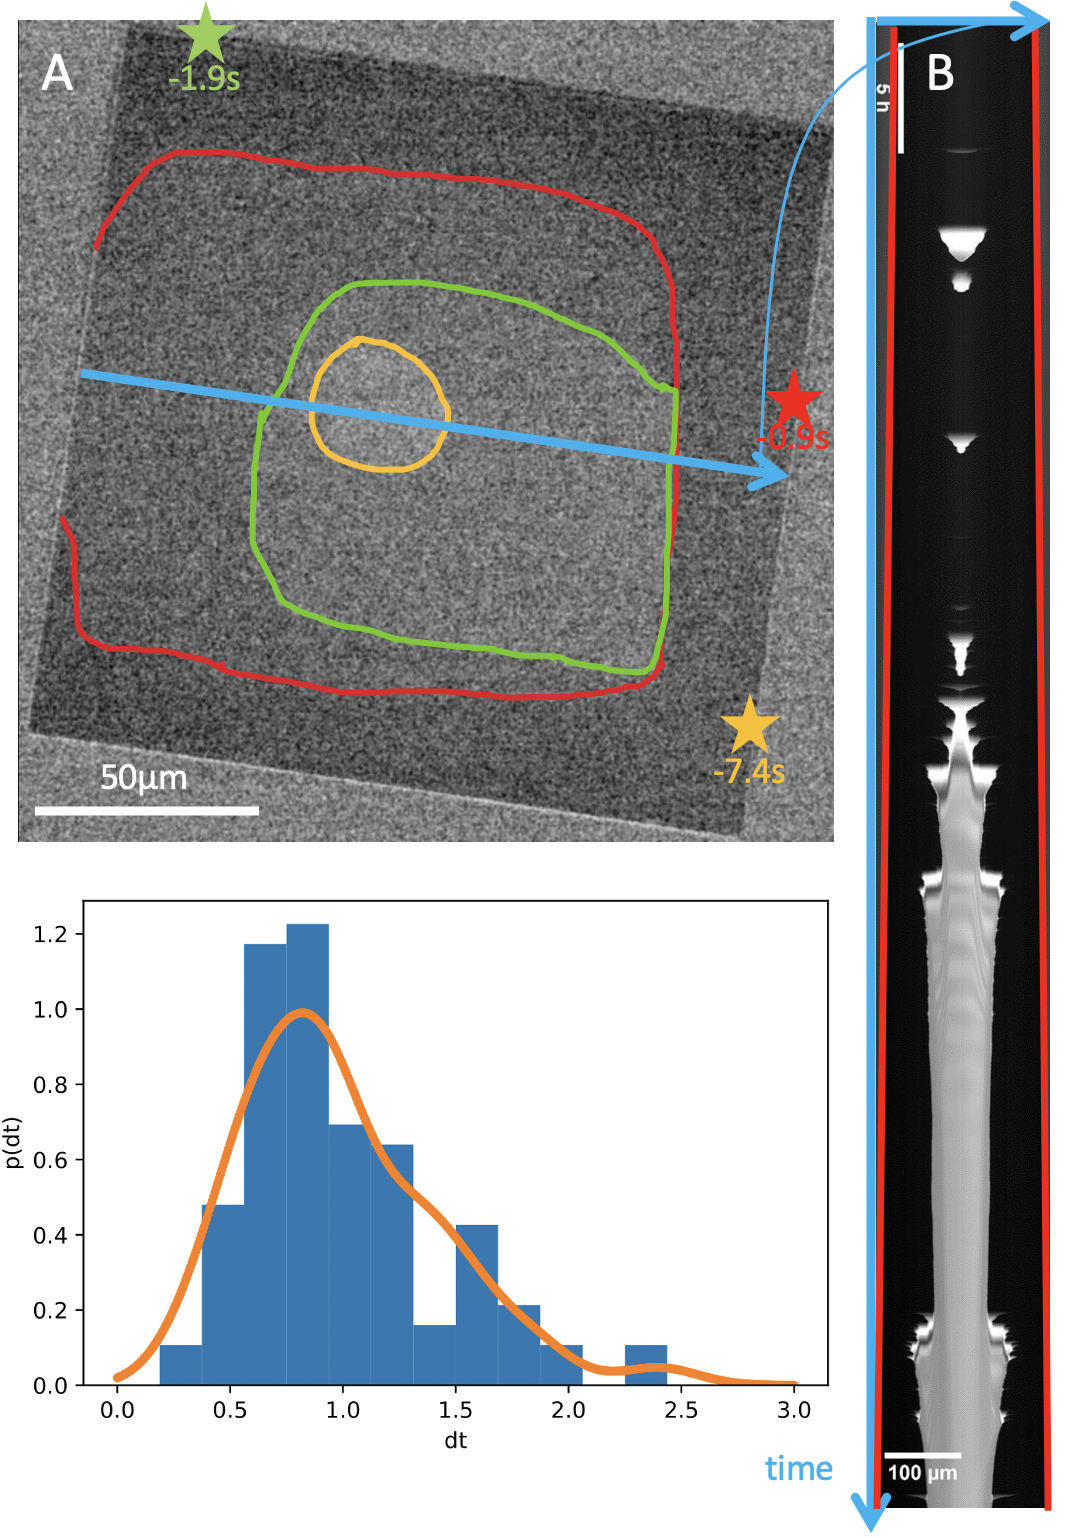
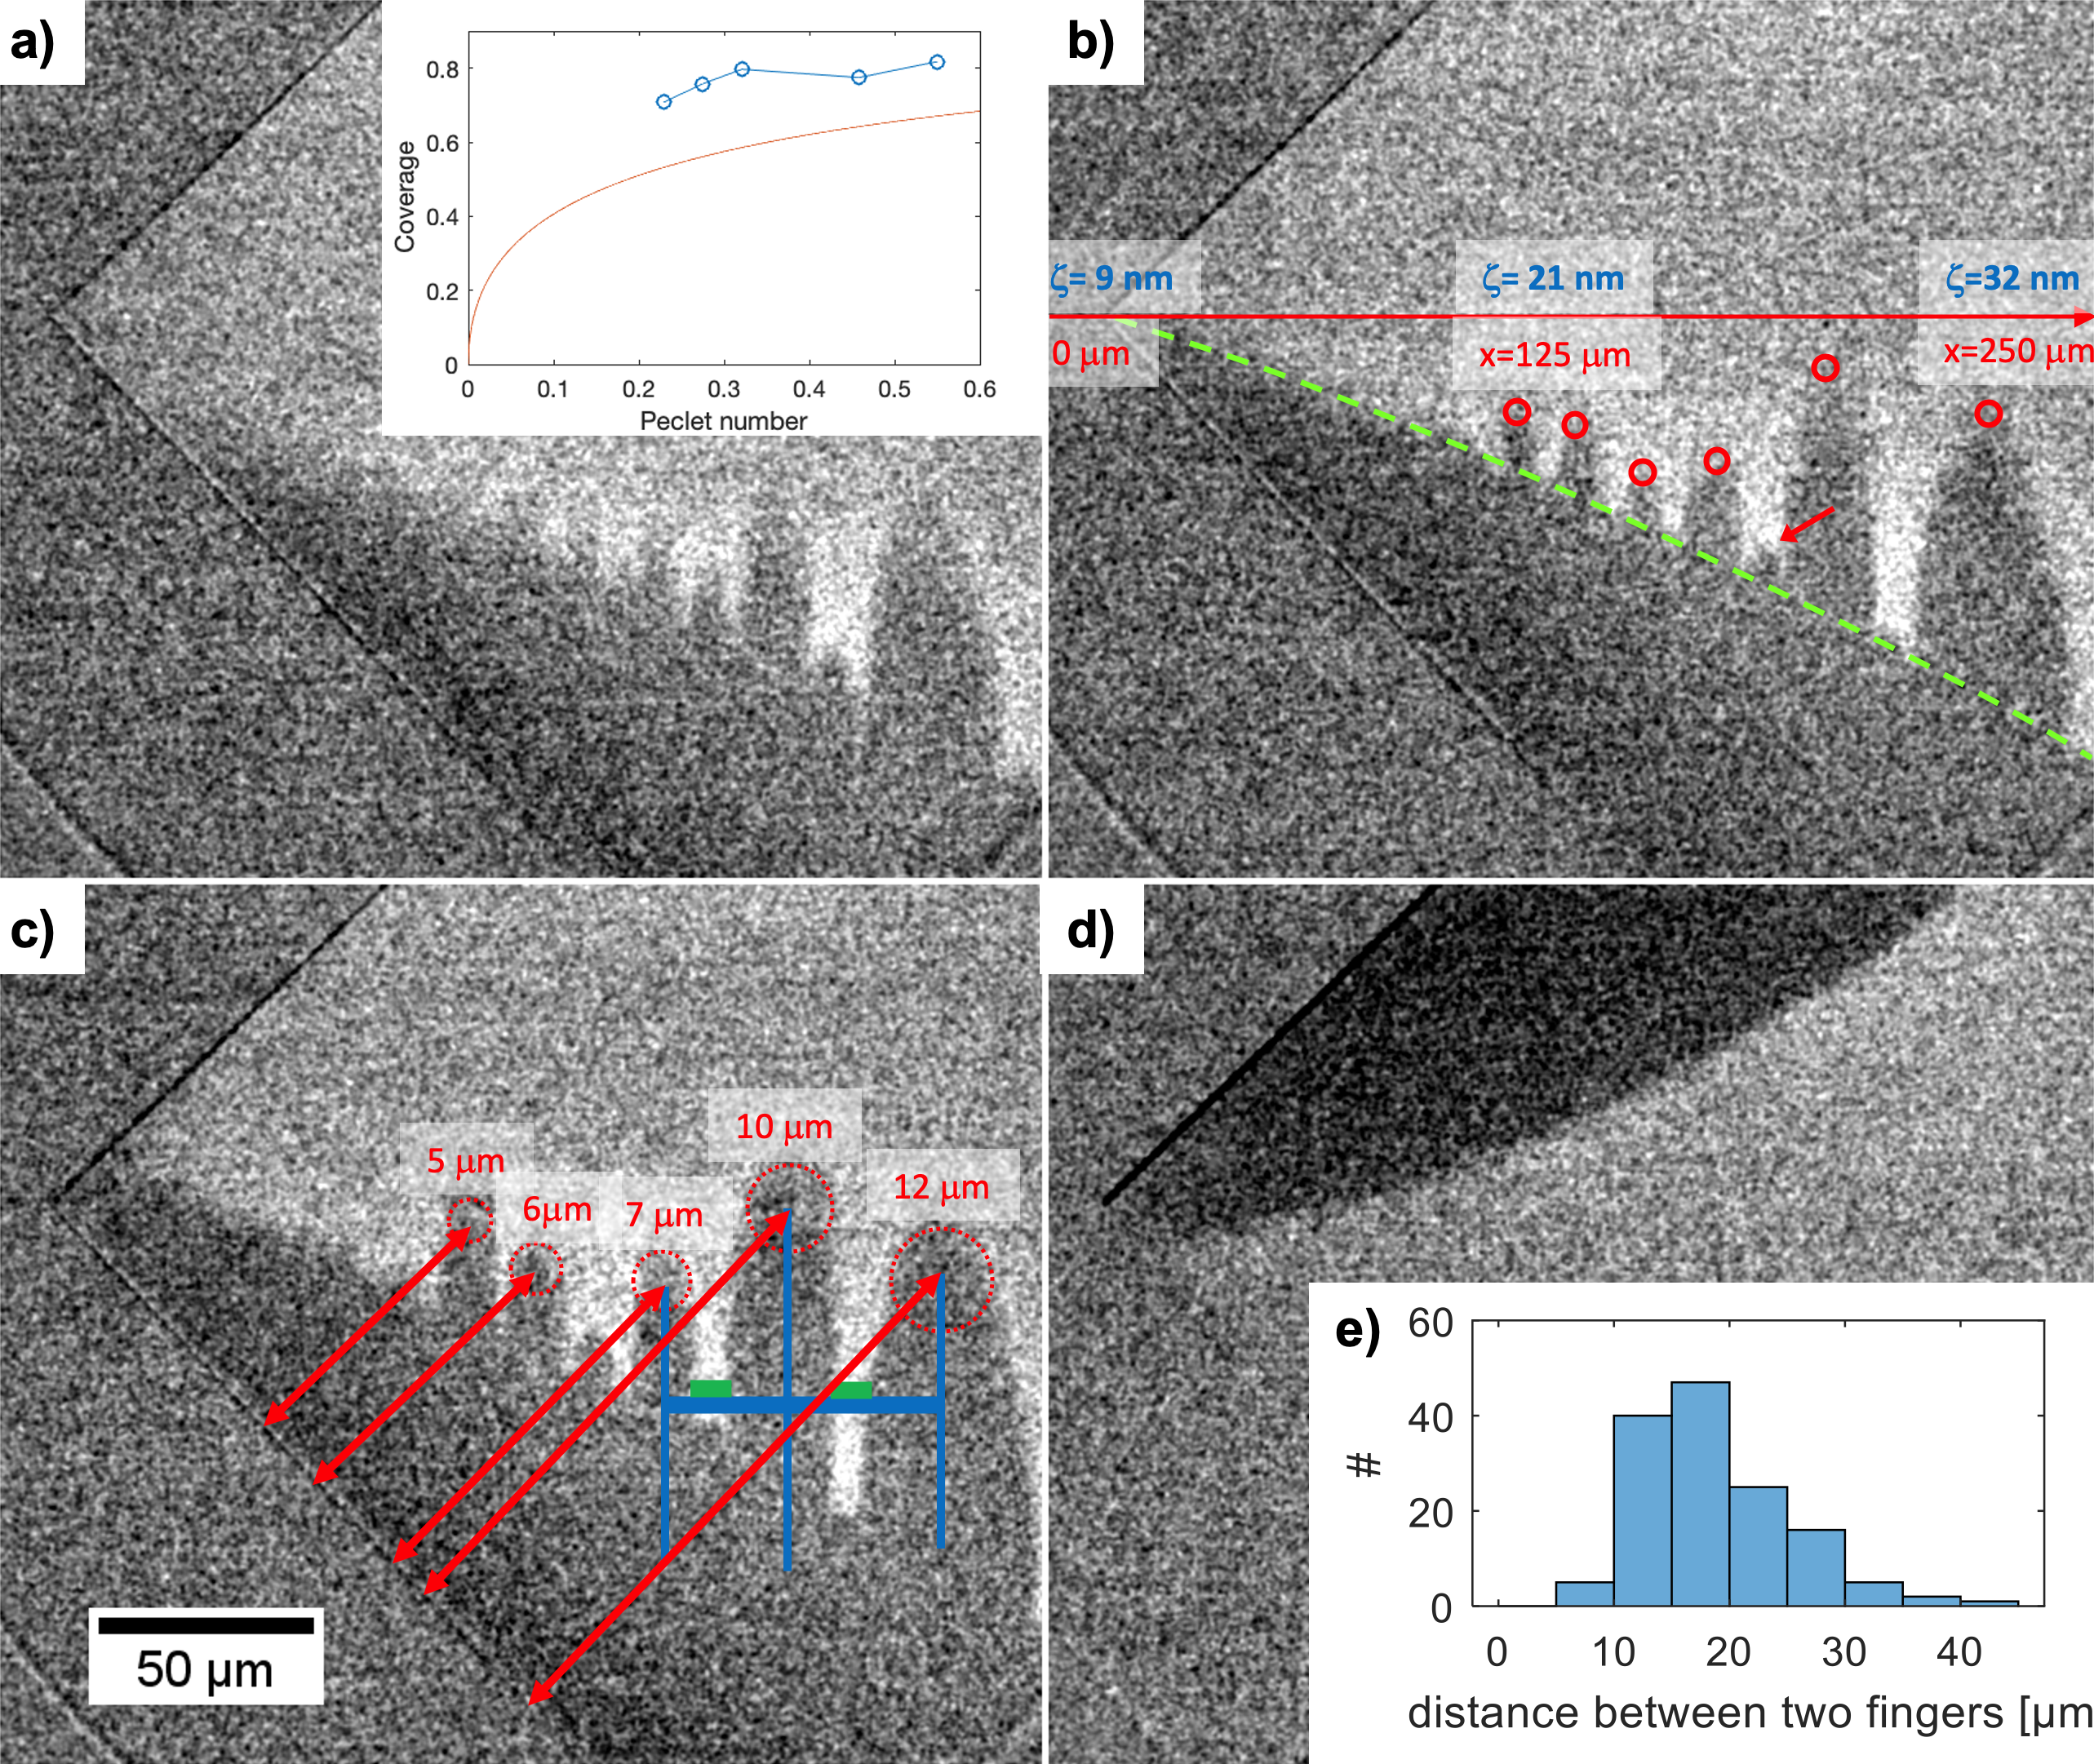
Several experiments showed unstable step fronts. In most cases the crystals were too small to show well developed fingers that lend themselves to quantitative analysis. We therefore concentrate the discussion on the experiment shown in movie S4 and Figs. 4 and S5 where the bulk supersaturation is 0.053 and the nm. The first four consecutive step fronts pass at time intervals of 547 s and develop finger-like instabilities. All 4 unstable fronts travel in a direction between the two maximum kinetic anisotropy directions (see arrows of kinetic anisotropy in Fig. 4 A-D). The fifth step front (Fig. S5 D) arrives only 9 seconds after the preceeding front and travels in the low velocity direction. The time between fronts and the direction of travel are therefore important to whether the fronts destabilize or not.
The time between two fronts determines how far diffusion has transported ions along the confined crystal surface. The diffusion length is 180 m for the unstable fronts and 70 m for the last front. No part of the images are more than 160 m from a crystal edge. The fact that the last front starts out with a velocity of 18 m/s and slows down with the square root of time is consistent with the front moving in a diffusion controlled concentration field.
Fig. 4A-C follow the progression of one of the unstable fronts. In Fig. S5 B the finger tips are indicated with red circles and the slow part of the front is indicated with a dashed green line. The finger tips propagate at constant speed and the slow part propagates at a velocity slowing down with the square root of time. This indicates that the fingers propagate by using the ions already present in the confined fluid film whereas the slow part depends on diffusion transport of ions from the bulk to propagate. The fraction of the area covered by the fingers before the slow front arrives is 0.7-0.9. One interpretation of this finite coverage by the fast growing layer is that it is limited by the number of ions already present in the fluid film. The ion coverage in the confined fluid is nm, where and nm.
Theoretical considerations
Let us consider a straight and isolated atomic step along the axis moving at velocity in the direction during growth. If small perturbations of the step position along are amplified, then the step is unstable. When the perturbation is small enough, the dynamical equations governing the motion of the step can be analyzed in perturbations, and to leading order one obtains a set of linear equations governing the evolution of . Assuming for simplicity that the step velocity is constant in time, a single Fourier mode of the perturbation of wavevector therefore grows or decays exponentially in time as . The linear equations for then provide a relation between and , which is called the dispersion relation. If for some values of , then the perturbations will grow exponentially in time, and the step will be unstable.
In the long wavelength limit, the dispersion relation contains two terms. The first term is destabilizing and is proportional to the velocity , and the second term is a stabilization term due to line tension effects
| (39) |
where is a diffusion constant, and is the so-called capillary length, where is the molecular area in a solid layer, is the number of ions in the liquid for one solid molecule, is the thermal energy and is the step stiffness. The stiffness is in general a function of the orientation angle , and is related to the step free energy via the relation .
From the condition , we find that the perturbations with wavelength larger than
| (40) |
where is usually called the diffusion length, are unstable. The wavelength of the most unstable mode, i.e., the mode with the largest , reads
| (41) |
In the isotropic case, we have and , leading to the expression of the main text.
When the step is unstable, small perturbations grow until nonlinearities come into play. These nonlinearities control the emerging morphology. A number of studies have focused on similar problems in two or three dimensions.
The driving force is measured by the coverage nm, where , is the molar density of the solid, is the liquid film thickness and is the height of a monolayer. This number measures the number of monolayers of solid that can be formed from the excess of ions in the supersaturated liquid. Considering a supersaturation , we obtain 1/nm where the film thickness is in nanometers.
If , i.e. in our experiments if nm, there is enough material in the liquid for a straight step to grow at constant velocity into a supersaturation . The supersaturation decreases from the value far in front of the step to the value at the step and behind it, which is depleted by an amount that corresponds to the formation of the new monolayer:
| (42) |
The step velocity then reads
| (43) |
where the kinetic coefficient is defined in the main text.
Linear stability analysis suggest that these steps undergo a Mullins-Sekerka instability when
| (44) |
The nonlinear dynamics has only been investigated theoretically close to the threshold Misbah et al. (2010), suggesting that isotropic steps undergo spatio-temporal chaos governed by the Kuramoto-Sivashinsky equation. However, in our experiments is at most while . This correspond to a regime which is far from the threshold, where , with . In this limit, the usual expression (40) of is valid, but to our knowledge, nothing is known about nonlinear dynamics.
In the other regime when the coverage is low , corresponding to small film thicknesses nm, there is not enough ions in the liquid film to form a monolayer via the motion of a step. As a consequence, ions have to diffuse from an increasing distance to be incorporated in the step as time goes forward. This results in a decreasing step velocity .
This regime gives rise to the celebrated ”dendrite” morphologies. Dendrites correspond to a constant-velocity parabolic step profile, which possibly undergoes side-branching away from the tip. The growth direction and the tip radius are controlled by anisotropy. In contrast, when anisotropy is negligible, one finds seaweed shapes characterized by permanent branching due to the splitting of their tips.
Irrespective of anisotropy, the tip of the parabolic Ivanstov dendrite solution Kassner (1996) is constrained by a relation between the tip radius and the tip velocity :
| (45) |
where is a dimensionless number called the Peclet number, which exhibits a non-trivial dependence on the coverage
| (46) |
Inset in Fig. S5 a) is a comparison between this relation between Peclet number and coverage and the corresponding parameters from measurements. In Fig. S5 we indicate the measurements or for each of the fingers. Using m and m2/s we obtain the experimental Peclet numbers from equation (45).
The time scale of motion of the fingers is short compared to the long time scale of the diffusion controlled evolution of supersaturation in the thin film. We may estimate the coverage at the time of passage of the fingers in two different ways: by solving the diffusion equation or by measuring the fraction of the area covered by the fingers.
Because the crystal is tilted and because of the finite time since the last layer grew the coverage at each finger tip is a function of its position. The supersaturation can be estimated as a function of distance to the nearest edge (as indicated in Fig S5) and the time since the last growth front passed:
| (47) |
This assumes that and is not corrected for the tilt of the crystal. In order to calculate the coverage nm the glass-crystal distance is evaluated for each tip. The resulting coverages in the range 0.7-0.8 are plotted in Fig.S5 a. For one of the fingers we may confidently estimate the coverage by the fraction of the crystal area the fingers cover before the slow front arrives. Fig. S5 c shows this measurement of coverage for the second rightmost finger. This is 10% smaller than estimated from the diffusion calculation. In the inset of Fig. S5 a) we plot the coverage (from the diffusion calculation) for each finger tip as function of Peclet number from (45). This agrees very well with the prediction from equation (46).
Two-dimensional numerical simulations of the dynamics with coverage lower than one has been reported in many papers (see for example Ben-Jacob (1993)). The results show dendrites and seaweed features at small values of the coverage. However, when the coverage approaches 1, a continuous front emerges with a porous monolayer. As a consequence, fingering should actually only be observed approximatively for . The porosity of the newly formed monolayer decreases as one approaches unit coverage.
Calcite experiments
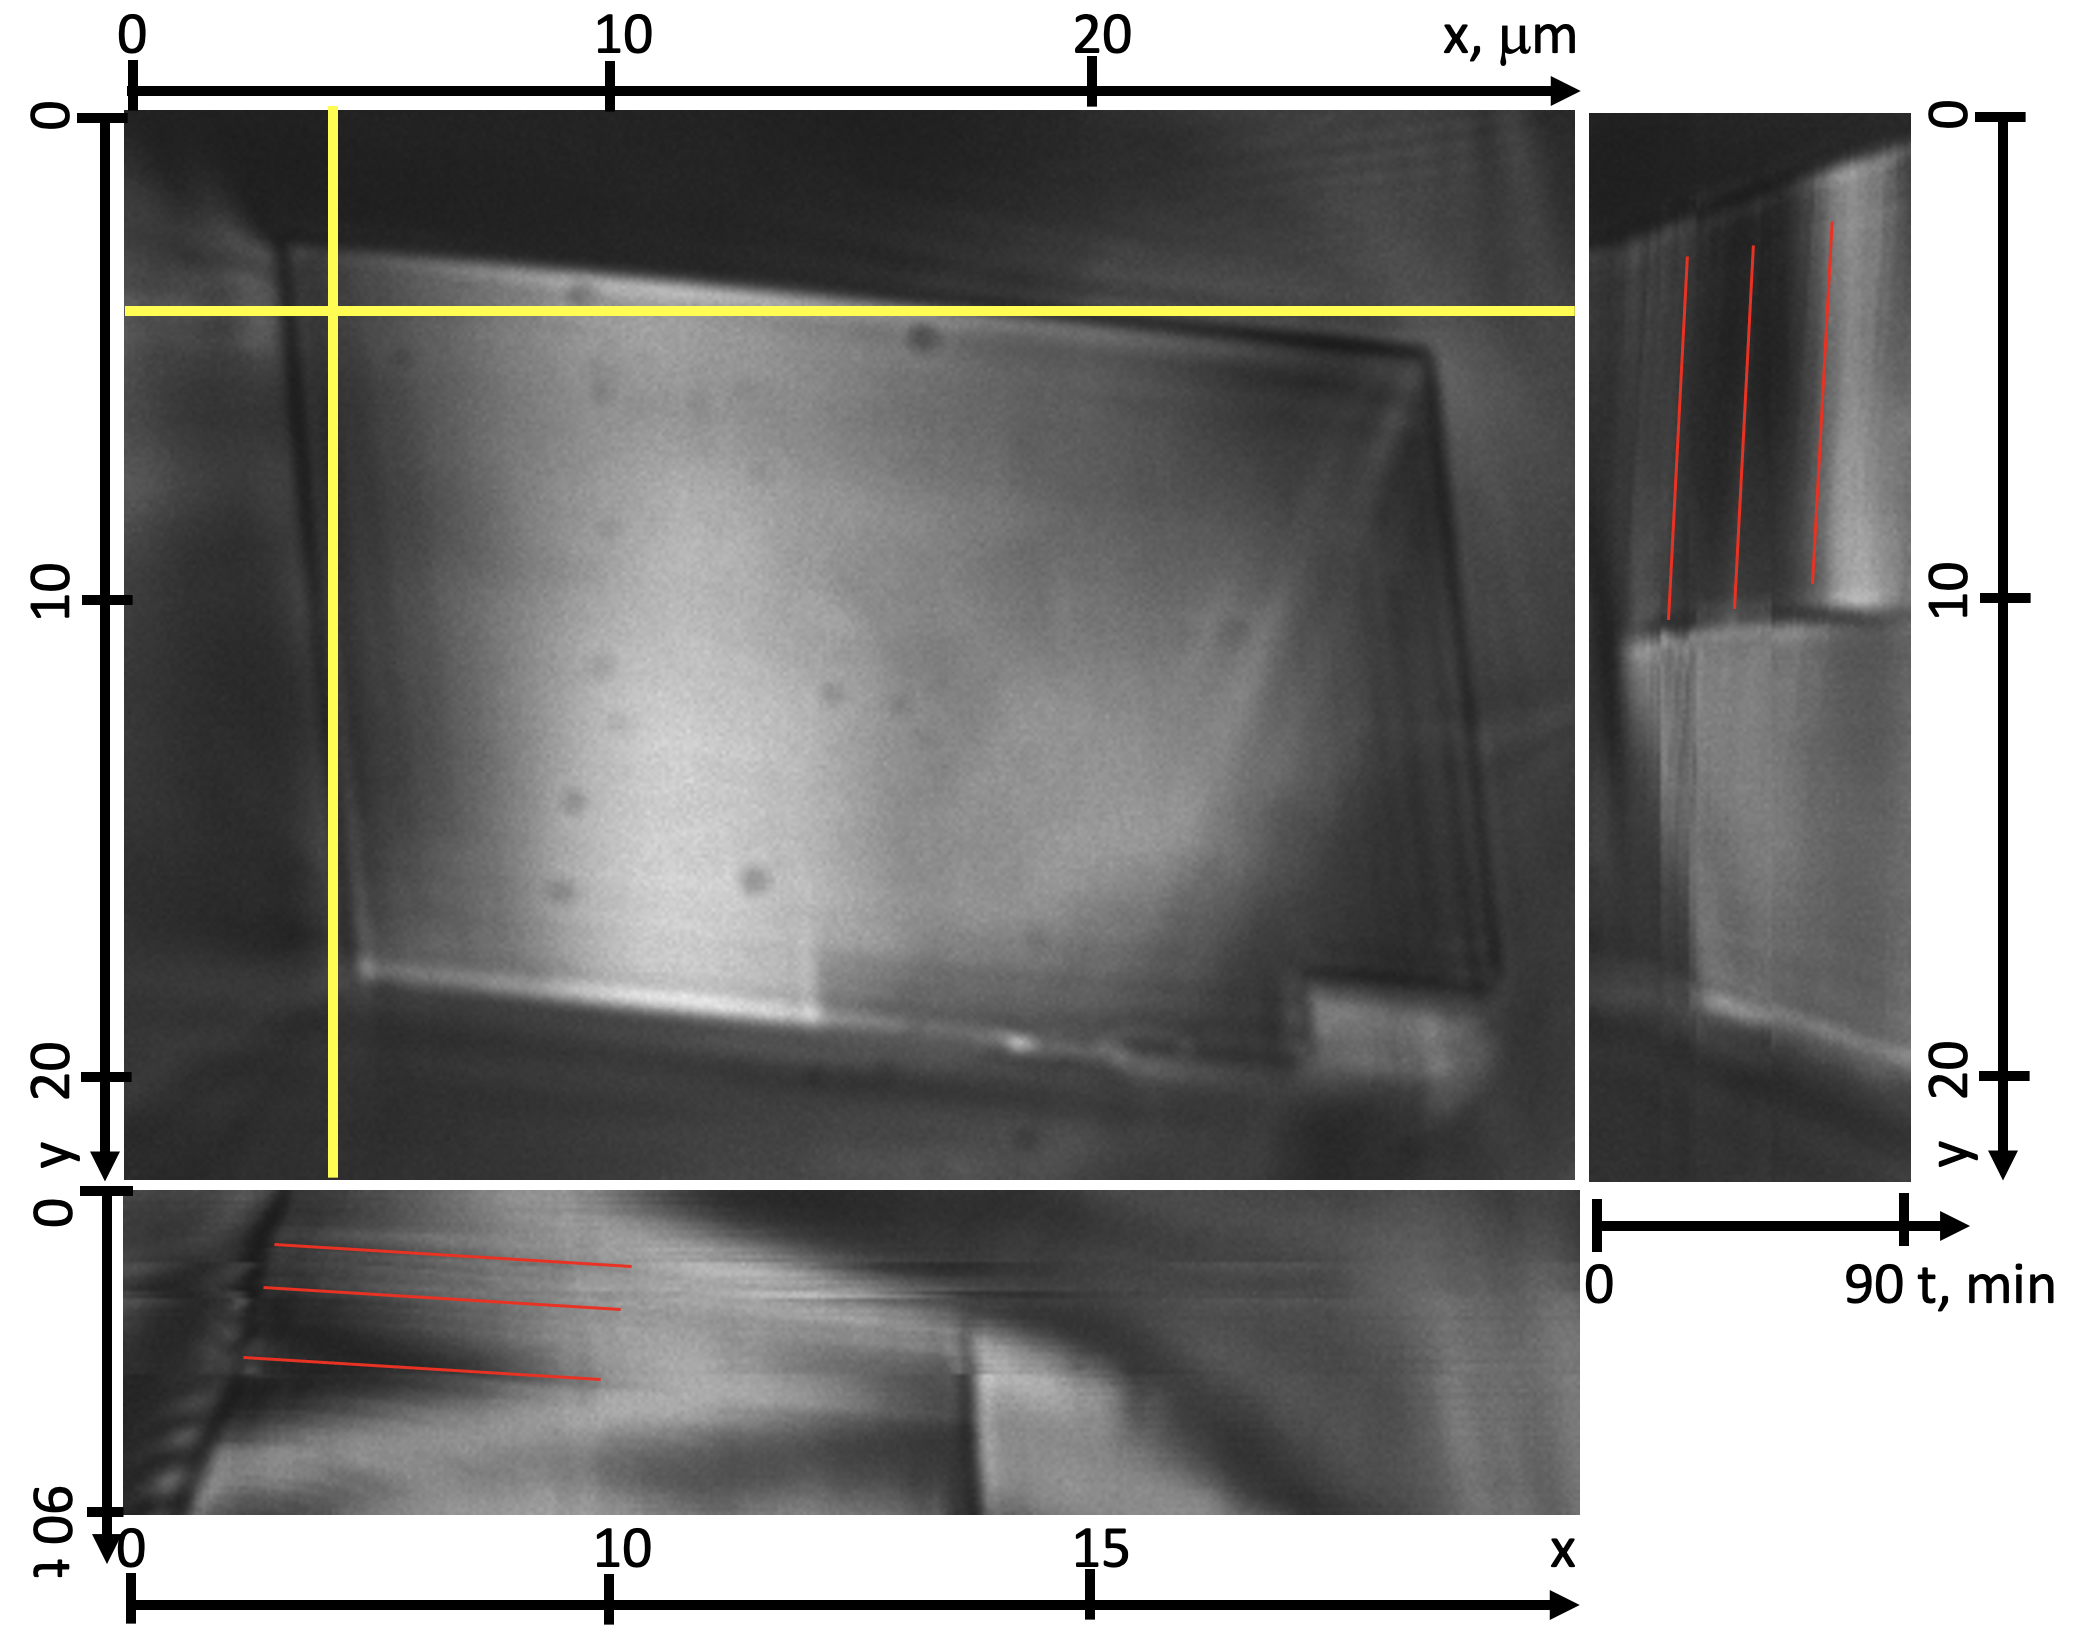
The calcite experimental setup has been described in detail elsewhere Li et al. (2021). A calcite crystal (see Figure S6) of approximately 15x25 m is kept at a CaCO3 concentration of 0.8010.002 mM, which corresponds to a supersaturation of and a saturation index of =0.44 Li et al. (2017).
Supplementary movie SM6 shows ”waves” of high and low intensity move along the rim from bottom left, around the top left corner and on to the top right. These intensity variations are due to changes in the glass-crystal distance as molecular steps move across the surface. The step flow emanates from a step edge on the rim in much the same way as from the dislocation source in Figure 2.
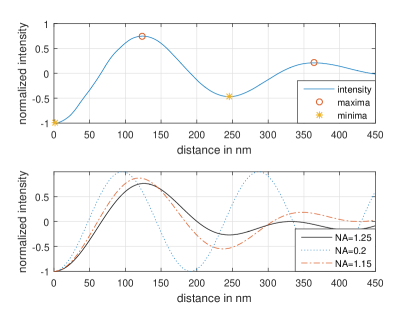
From Li et al. (2021) we know that when the distance between the glass surface and the calcite surface was 30 nm the vertical growth rate was 2.6 nm/min. The step height on calcite is 0.34 nm and the vertical growth rate of 8 layers per minute corresponds to a horizontal single molecular step spacing of 170-340 nm. This is well below the horizontal resolution limit of the objective in this experiment and the waves of step flow observed in movie SM6 correspond to several molecular steps, either equidistant or joined in step bunches. The growth regime on this calcite surface is not a ”single step” regime as for several of the NaClO3 experiments. Thus, even though we cannot resolve single steps, the interference contrast allows us to measure the ”collective” speed of the molecular steps along the surface.
Figure S6 shows the same crystal at time with a vertical and a horizontal yellow line that indicate where intensity has been measured and displayed as function of time in the two side images. The motion of the intensity change caused by the flow of molecular steps manifests as dark and bright lines in the and images in Figure S6 and the slope of the lines measure the velocity of the molecular steps. We have highlighted some of these lines with red in Figure S6. The step flow velocities are determined to be 4310 nm/s in the x-direction and 225 nm/s in the y-direction. This is one order of magnitude faster than determined from AFM measurementsTeng et al. (2000); Bracco et al. (2013) at similar reported saturation index. We have, however shown that calcite growth rates as function of saturation index measured by AFM are 2 orders of magnitude too small, probably due to insufficient control of the saturation index at the calcite surface Li et al. (2018). Since the supersaturation at the confined surface decreases with distance from the crystal edge we find our present measurement nm/s in agreement with previous findings.
References
- Israelachvili (2011) J. N. Israelachvili, Intermolecular and surface forces, 3rd ed. (Associated Press, 2011).
- Mutisya et al. (2017) S. M. Mutisya, A. Kirch, J. M. De Almeida, V. M. Sánchez, and C. R. Miranda, Journal of Physical Chemistry C 121, 6674 (2017).
- Smith et al. (2016) A. M. Smith, A. A. Lee, and S. Perkin, Journal of Physical Chemistry Letters 7, 2157 (2016).
- Saito (1996) Y. Saito, Statistical Physics of Crystal Growth (World Scientific, 1996).
- Misbah et al. (2010) C. Misbah, O. Pierre-Louis, and Y. Saito, Reviews of Modern Physics 82, 981 (2010).
- Kassner (1996) K. Kassner, Pattern Formation in Diffusion-Limited Crystal Growth (World Scientific, 1996) p. 268.
- Ben-Jacob (1993) E. Ben-Jacob, Contemporary Physics 34, 247 (1993).
- Li et al. (2021) L. Li, F. Kohler, J. Dziadkowiec, A. Røyne, R. M. Espinosa-Marzal, F. Bresme, E. Jettestuen, and D. K. Dysthe, arXiv 1904.04491 (2021), arXiv:1904.04491 .
- Li et al. (2017) L. Li, F. Kohler, A. Røyne, and D. Dysthe, Crystals 7, 361 (2017).
- Teng et al. (2000) H. H. Teng, P. M. Dove, and J. J. De Yoreo, Geochimica et Cosmochimica Acta 64, 2255 (2000).
- Bracco et al. (2013) J. N. Bracco, A. G. Stack, and C. I. Steefel, Environmental Science and Technology 47, 7555 (2013).
- Li et al. (2018) L. Li, J. R. Sanchez, F. Kohler, A. Røyne, and D. K. Dysthe, Crystal Growth and Design 18, 4528 (2018), arXiv:1708.06299 .