AOSLO-net: A deep learning-based method for automatic segmentation of retinal microaneurysms from adaptive optics scanning laser ophthalmoscope images
Abstract
Microaneurysms (MAs) are one of the earliest signs of diabetic retinopathy (DR), a frequent complication of diabetes that can lead to visual impairment and blindness. Adaptive optics scanning laser ophthalmoscopy (AOSLO) provides real-time retinal images with resolution down to 2 and thus allows detection of the morphologies of individual MAs, a potential marker that might dictate MA pathology and affect the progression of DR. In contrast to the numerous automatic models developed for assessing the number of MAs on fundus photographs, currently there is no high throughput image protocol available for automatic analysis of AOSLO photographs. To address this urgency, we introduce AOSLO-net, a deep neural network framework with customized training policies to automatically segment MAs from AOSLO images. We evaluate the performance of AOSLO-net using 87 DR AOSLO images and our results demonstrate that the proposed model outperforms the state-of-the-art segmentation model both in accuracy and cost and enables correct MA morphological classification.
Introduction
Diabetic retinopathy (DR), a frequent complication of diabetes, remains the leading cause of new cases of blindness, among working-age adults in the United States[1], and it is expected to affect approximately 14.6 million people in United States by the year 2050[2]. DR results in pathological alterations in both neural and microvascular structures and can damage any part of the central or peripheral retina [3]. Based on the Early Treatment Diabetic Retinopathy Study (ETDRS) severity scale, eyes with DR progress through a severity spectrum of DR from non-proliferative DR (NPDR)[4]. Classification of these severity stages is performed by evaluating certain clinical features of the retina, such as microaneurysms (MAs), intraretinal hemorrhages, hard exudates, cotton wool spots, intraretinal microvascular abnormalities and venous beading[5]. Advanced and vision-threatening stages of DR are characterized by neovascularization and by the presence of vessels that may leak fluid and eventually cause diabetic macular edema (DME), which is manifested as thickening of the central retinal[6].
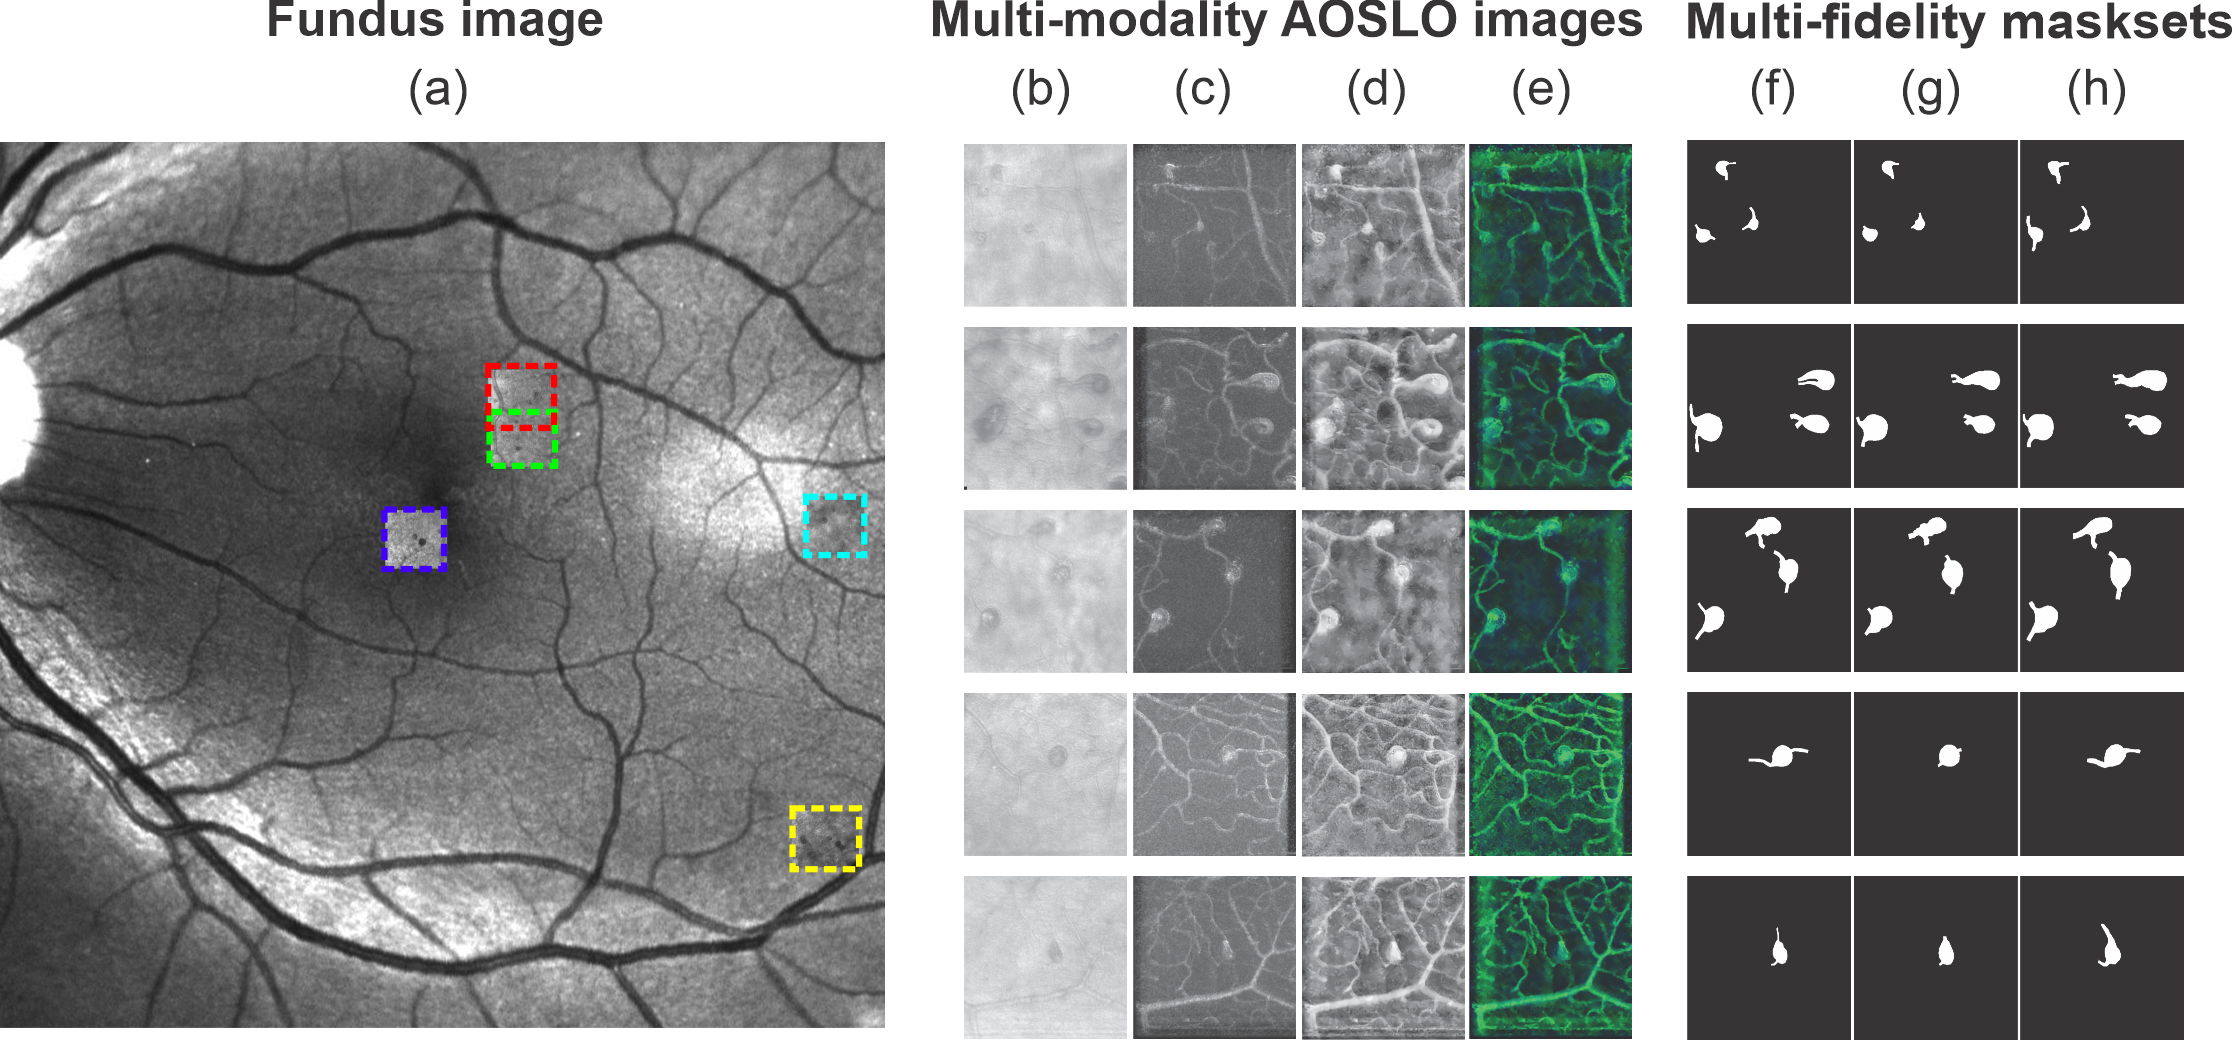
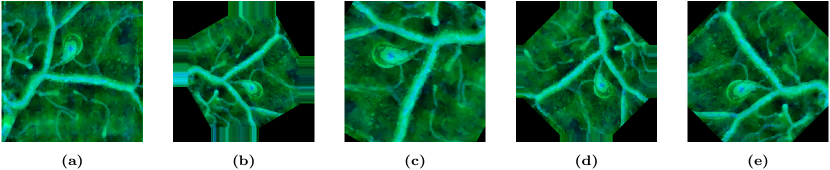
Fundus photography, a conventional and non-invasive imaging modality, has been widely used since the 1960’s to access the severity of DR on the basis of the presence and severity of retinal vascular lesions[7, 8, 9]. In fundus images (see Fig. 1(a)), MAs appear as red circular dots with sharp margins whereas intraretinal hemorrhages, which also display as red dots or blots, may be larger and more irregularly shaped than MAs[10]. MAs and intraretinal hemorrhages are frequently not able to be distinguished on fundus images as the standard fundus photographs do not provide microscopic details of these lesions or allow determination of vascular perfusion. Indeed, the ETDRS severity scale lumps the grading of these lesions into a single “H/MA” category. In contrast, more advanced imaging modalities, such as optical coherence tomography angiography (OCTA) [11, 12] and adaptive optics scanning laser ophthalmoscopy (AOSLO) [13, 14], is capable of providing higher resolution details of these abnormalities and address the presence or absence of blood flow, thereby allowing differentiation hemorrhages from MAs [15]. AOSLO provides retinal imaging with the highest resolution of all the available retinal imaging techniques on human retina (down to the cellular level (2 )) and thus has been used to identify and quantify the morphology of individual MA [13] (see Figs. 1(b-e)) and to measure blood flow at the capillary level [16].
Recent OCTA and AOSLO-based studies have suggested a possible correlation between the morphology of retinal MAs and their tendency to leak fluid, rupture or form thrombus [17, 14, 18]. These findings imply that accurate identification of the shapes of MAs might be useful in the future to improve prediction of DR worsening or improvement. However, existing models for MA segmentation and classification have been trained on standard fundus photographs and therefore can only predict the number of MAs and their locations [19, 20, 21, 22, 23, 24], because the resolution of standard fundus photography is not sufficient to analyse the shape of individual MAs. In contrast, the AOSLO imaging technique provides ultra-high resolution retinal images that can be used to classify MA morphologies [13]. To date, AOSLO retinal images have been analyzed manually by specially trained personnel [13, 25, 14, 17] as no model has been developed to automatically process these images.
Emerging interest in automated analysis of retinal images has been sparked by the rapidly increasing prevalence of diabetes worldwide and the consequent need for scalable approaches to screen and triage patients at risk for vision loss from DR [26, 27, 28]. With the recent advances in the computational power of graphics processing units (GPUs), deep convolutional neural networks (DCNNs) have become a widely used tool for efficient DR screening [29]. DCNNs are more generic compared to conventional methods that rely on hand-crafted features because the deep layers in the network act as a set of increased levels of feature extractors that can learn directly from the input images [30, 31, 32]. Moreover, DCNN models are highly discriminative in automated DR severity grading and thus have achieved higher screening accuracy than conventional methods [26]. In particular, UNet, combining an encoder and a decoder to form a “U-shape” structure, is a specially designed CNN architecture for biomedical image segmentation tasks. UNet is very effective in few-shot prediction with only a few labeled images when combined with data augmentation [33] and it has outperformed the plain DCNN in segmenting biomedical images, particularly for those with complex subtleties [33, 34, 35]. Recent development of UNet has given rise to a number of variants, such as deformable UNet [36], residual UNet [37], recurrent residual UNet [37] and iterNet [38], which further improved the segmentation accuracy on fundus images.
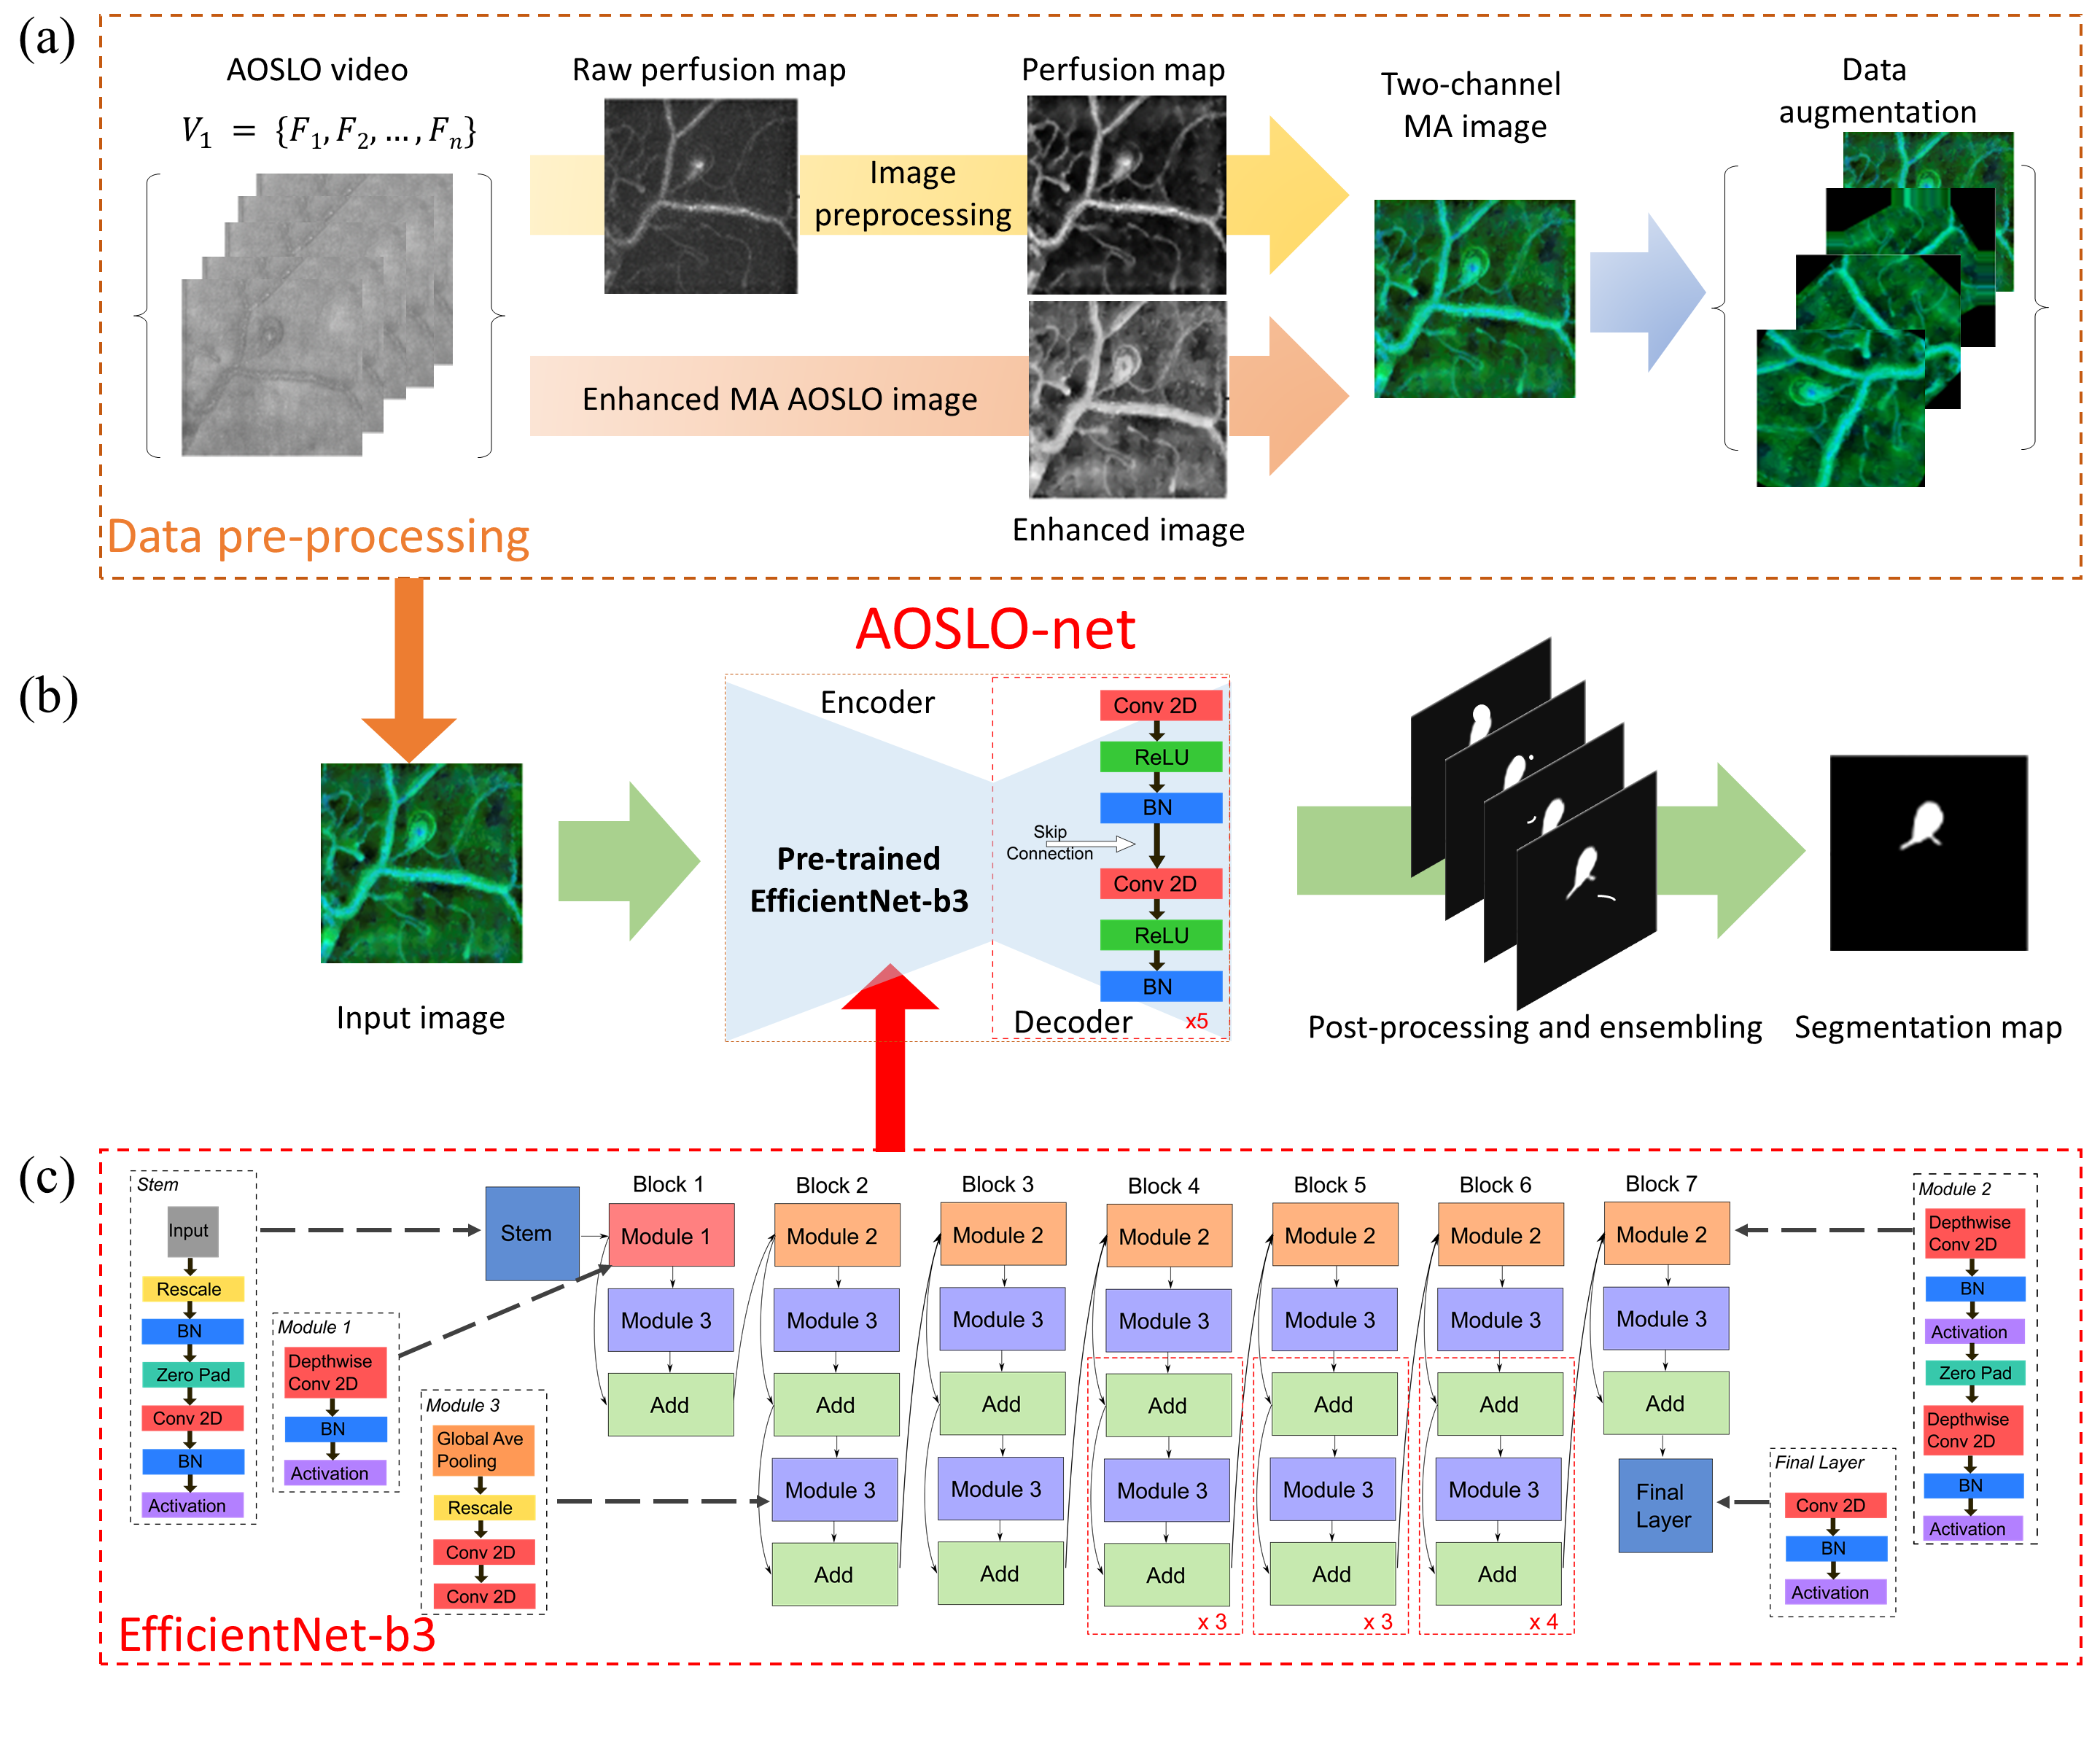
We have noted several features from the AOSLO image dataset that pose challenges for the existing automatic segmentation models. As shown in Fig. 1(b), (i) the contrast between the MA body and background is low whereas the level of the background noise is high; (ii) the boundary of the MA is not clearly defined; (iii) a typical AOSLO image may contain one or multiple MAs with different shapes and sizes; (iv) there are numerous background blood vessels in the images, some of which are even at similar size as the MAs. These background vessels may interfere with the segmentation of the feeding or draining vessels of the MAs, which are crucial to determine MA morphology. In this work, we design the first deep neural network model, or AOSLO-net (see Fig. 2), to perform automatic segmentation of MAs from AOSLO images and quantify their shape metrics that can be used for classification of MAs into different types, such as focal bulging, saccular, fusiform, mixed saccular/fusiform, pedunculated and irregular-shaped MAs [13]. This model is trained and tested by using 87 AOSLO MA images with masks generated manually by trained graders, the largest published AOSLO image dataset for this kind of effort thus far. We evaluated the performance of this model by comparing the model predictions with nnUNet [39], a state-of-the-art (SOTA) UNet model whose superiority has been demonstrated for dozens of publicly available databases.
Data
Demographic Information
In this study, 87 MAs were imaged from 28 eyes of 20 subjects with varying severity of DR (56% NPDR and 44% PDR). Sixteen (80%) subjects had type 1 diabetes, 7 (35%) of the subjects are female and average age is years old, with mean diabetes duration 23.9±8.4 years, and mean HbA1c is %. Informed written consent was obtained from each participant prior to the performance of any study procedures at a single visit in Beetham Eye Institute, a tertiary referral center for diabetes care. This study adhered to the tenets of the Declaration of Helsinki and was approved by the institutional review board of the Joslin Diabetes Center.
Data Set
87 MAs from the eyes of adult study participants with diabetes underwent AOSLO imaging. All MAs were located within of the foveal center. The AOSLO system has been previously described in detail by Lu et al. [40]. This system uses confocal and multiply scattered light (MSL) imaging modes, and achieves a field size of with lateral resolution of 2.5 m on the retina. Moreover, 75-frame videos of each MA were aligned and averaged (MATLAB, The MathWorks, Inc., Natick, MA, USA). The magnification factor on AOSLO images was determined by eye axial length measurement or derived from the spherical equivalent of the eye. For this exploratory study, we included MAs with high quality AOSLO images (see Fig. 1(b)), where the 2D MSL images and corresponding perfusion maps (see Fig. 1(c)) provided sufficient detail to identify the full extent of MAs’ bodies and their parent vessels’ boundaries.
The masks in our dataset, as illustrated in Fig. 1(f-h), are considered as the ground truth for training the AOSLO-net and they are created manually by ophthalmologists and skilled trainees using ImageJ [41]. Both the AOSLO images (Fig. 1(b)) and the corresponding perfusion map (Fig. 1(c)) are referred when masks are generated. Moreover, different groups of MA masks, as shown in Figs. 1(g-h), are created by varying the length and thickness of the parent vessels to test the robustness of AOSLO-net to masks with different qualities. The normal mask set (see Fig. 1(f)), which is generated by ophthalmologists, intends to represent the true geometries of the parenting vessels illustrated on the AOSLO images. The short mask set (see Fig. 1(g)) is designed to show shorter feeding and draining vessels of MAs compared to the normal mask set, while the thickness of the vessels remains similar to the normal masks. The thick mask set (see Fig. 1(h)) is designed to show thicker feeding and draining vessels of MAs compared to the normal set, while the length of the vessels remains similar to the normal masks. This examination also demonstrates the human ability of segmentation when comparing one kind of masks with another, as they equivalently represent the MAs.
Results
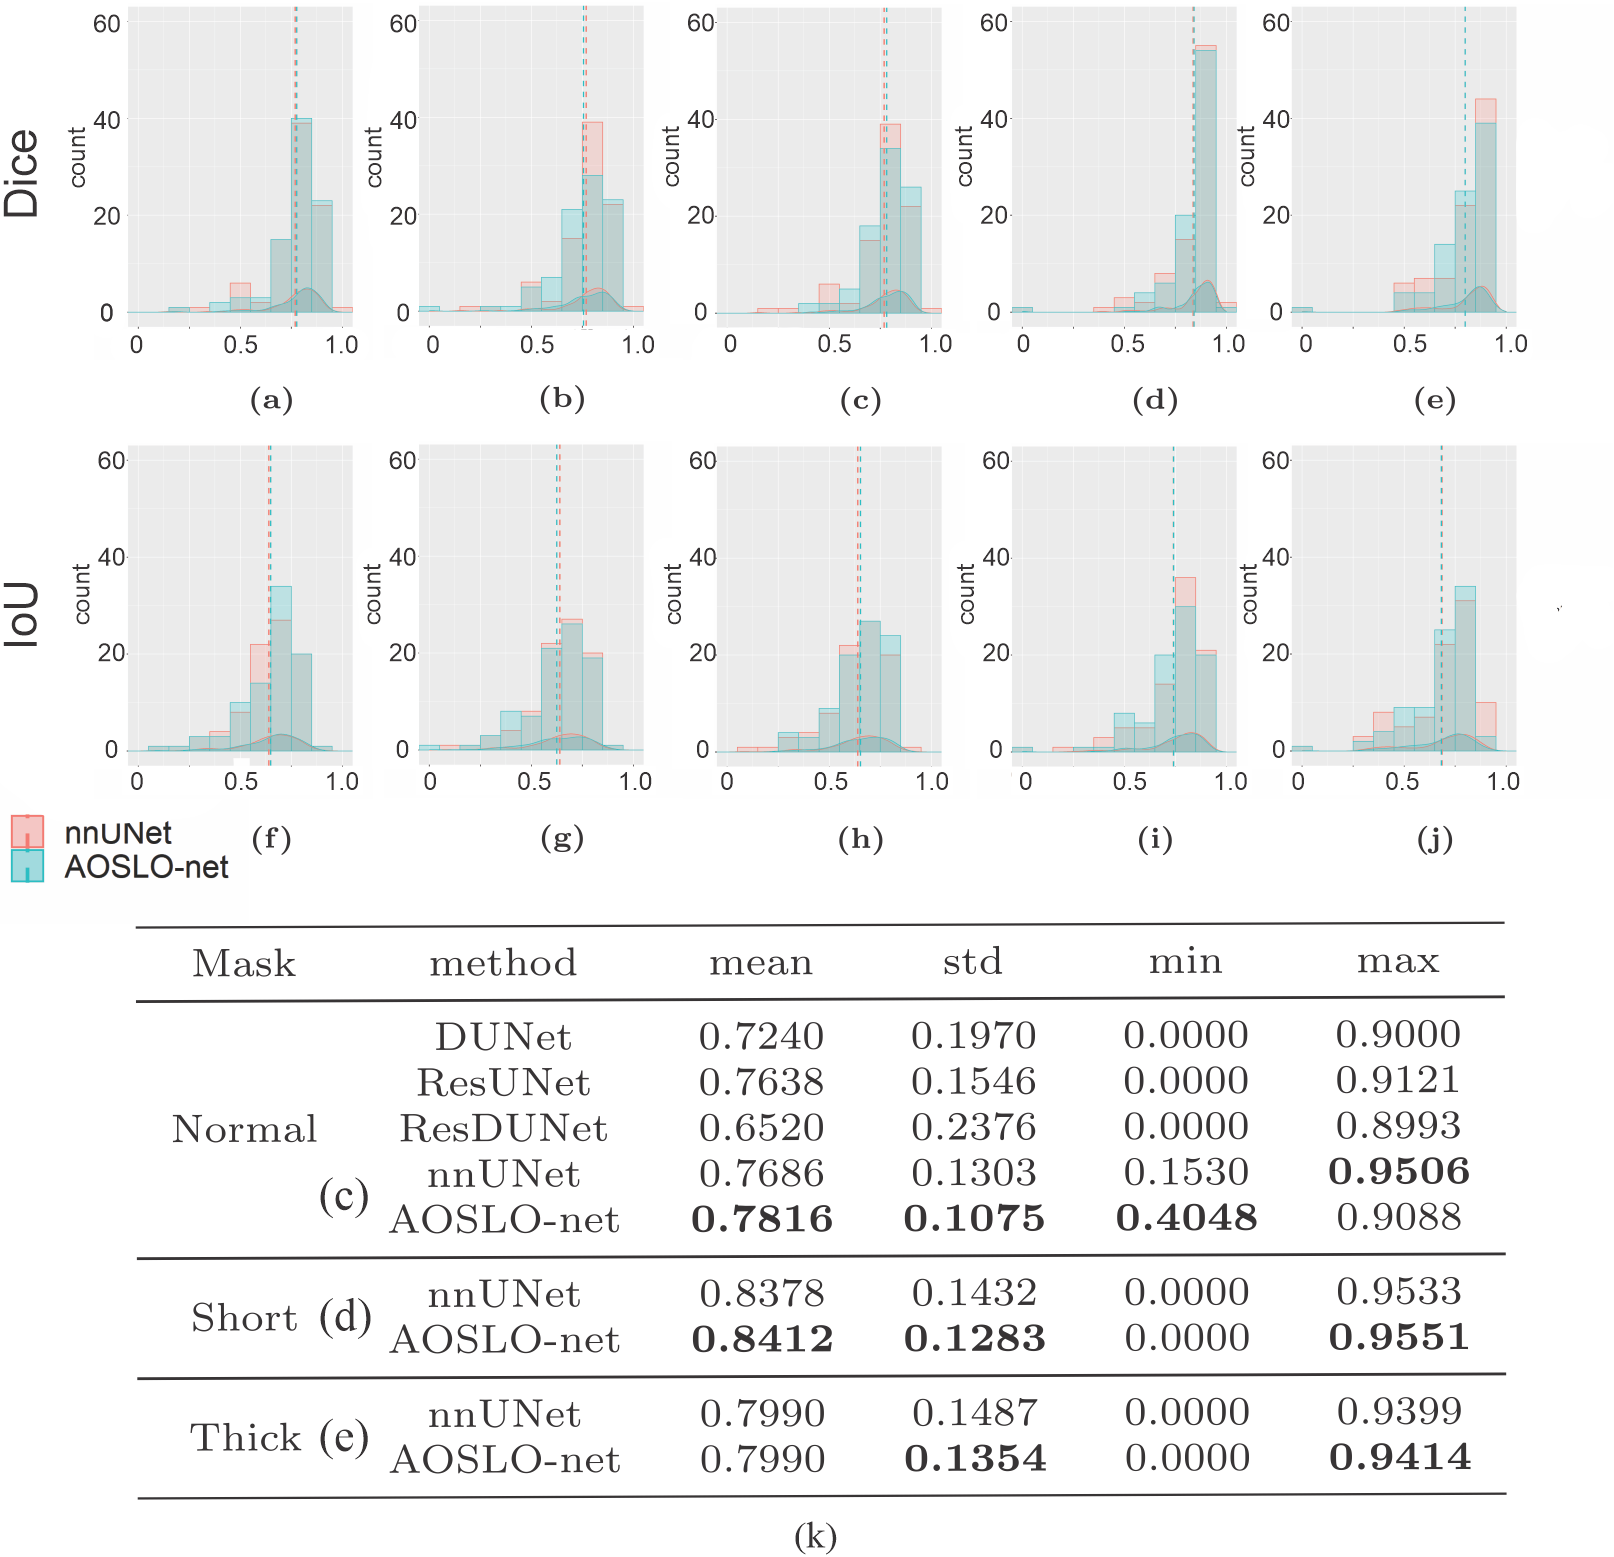
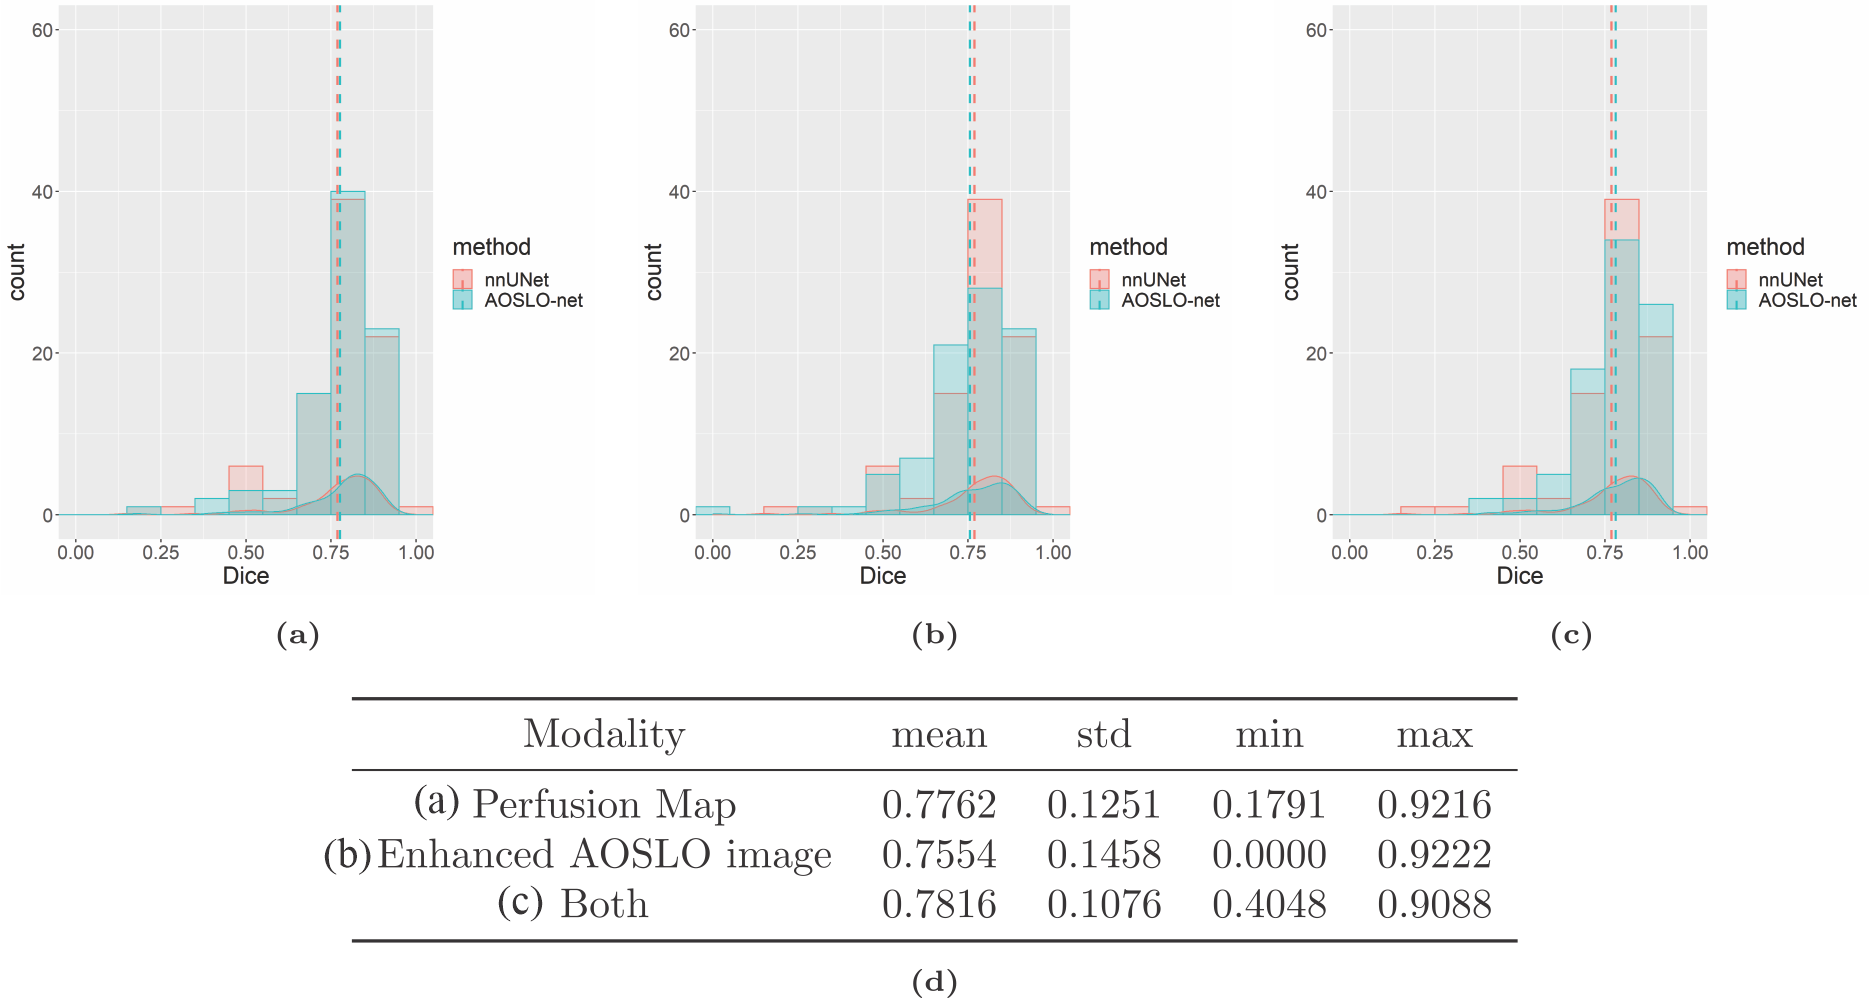
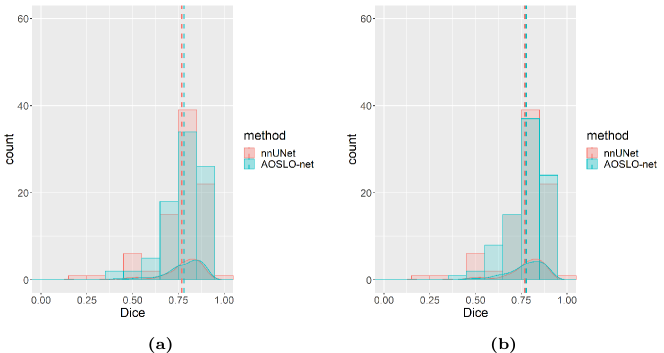
First, we train the AOSLO-net and nnUNet using perfusion map (Fig. 1(c)), enhanced AOSLO (Fig. 1(d)) and two-channel images (Fig. 1(e)), respectively, to examine which image modality can optimize the model performance. The normal mask set (Fig. 1(f)) is used as the target in these training processes. Our results in Figs. 3(a-c,f-h) and Fig.3 in SI show that higher Dice and IoU scores are achieved for both nnUNet and AOSLO-net models when two-channel images are used, suggesting that two-channel images could provide more MA geometrical information to the segmentation models than the other two image modalities. Therefore, in the following section, we use the two-channel image set as the input of segmentation models to assess the model performance on different mask sets, including normal mask set, short mask set and thick mask set. The performance of AOSLO-net and nnUNet on these three mask sets is summarized in Fig. 3, which shows that based on Dice and IoU, AOSLO-net achieves more high-quality predictions and fewer low-quality predictions for these three groups of masks. Specifically, when models are trained with the normal and short mask sets, as shown in Figs. 3(c,d), AOSLO-net achieves mean Dice scores of 0.7816 and 0.8412, respectively, which are higher than 0.7686 and 0.8378 of nnUNet. Additionally, the performance of AOSLO-net appears to be more stable than nnUNet, given smaller standard deviations in the results of AOSLO-net. When these two models are trained with thick mask set (see Fig. 3(e)), although the mean Dice scores of AOSLO-net and nnUNet are the same, AOSLO-net preserves a stable performance with a relatively smaller standard deviation in Dice score. In addition to nnUNet, as shown in Fig.4 in SI, we specifically compare the performance of AOSLO-net with other popular CNN-based models, i.e., Deformable UNet[36], ResUNet[42, 43] and Deformable ResUNet[44, 42, 43], using the normal mask dataset. The statistics of the Dice scores listed in Fig. 3(k) suggest that AOSLO-net outperforms these models significantly in mean Dice score and standard deviation.
Morphology of MA body and its feeding and draining vessels
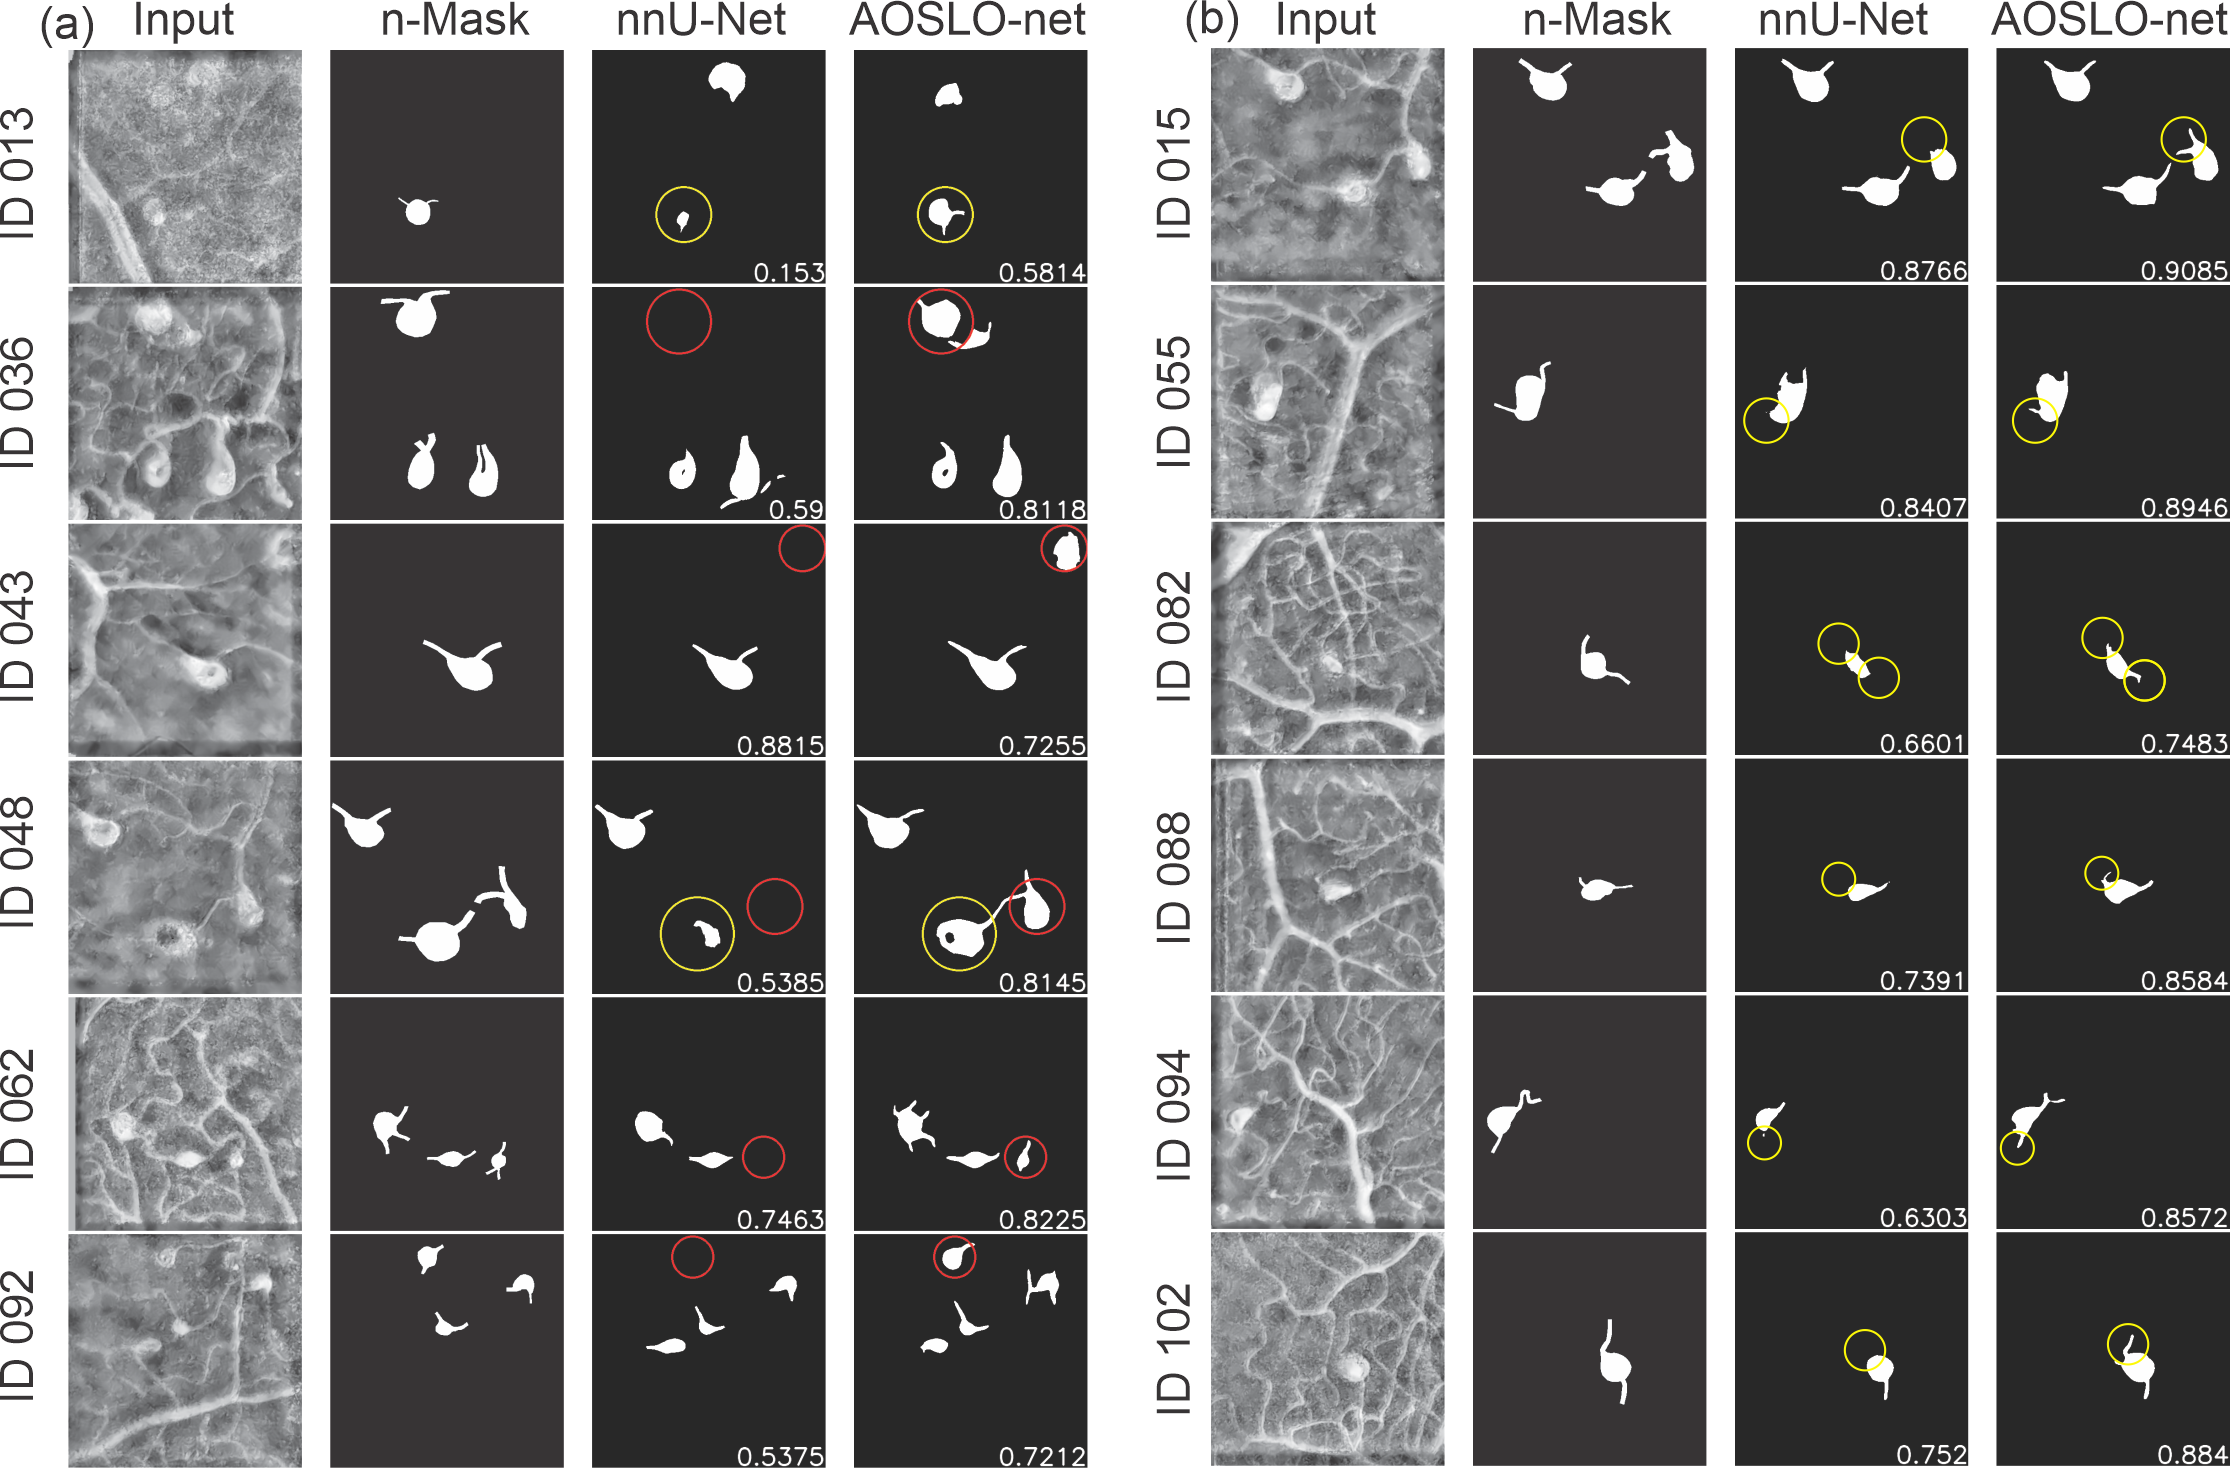
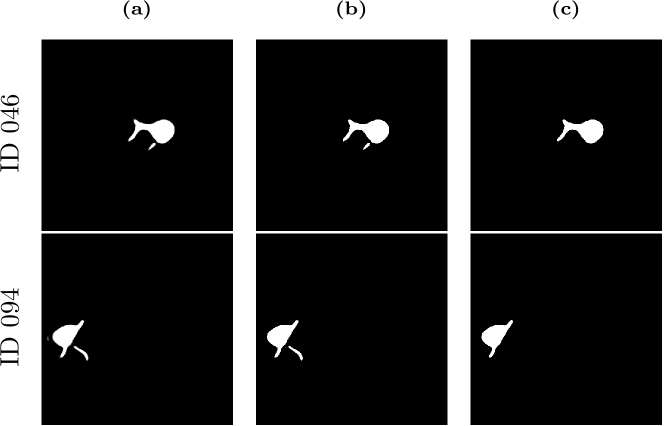
To further examine the capabilities of AOSLO-net and nnUNet in extracting the detailed MA features, we perform image-wise analysis by comparing individual pairs of masks and model predictions. We focus on the model performance on detecting MA bodies and their feeding and draining vessels, respectively. Typical examples of the comparisons between nnUNet and AOSLO-net on detecting MA bodies are illustrated in Fig. 4(a). We note that AOSLO-net can identify the targeted MAs and extract MA bodies that are comparable with the masks, particularly for images containing multiple MAs, like IDs 036, 048, 062 and 092. In contrast, nnUNet fails to detect some of the MAs (highlighted in red circle). As for the vessel detection, Fig. 4(b) shows that nnUNet may ignore one or both of the parenting vessels of MAs (highlighted in yellow circle), while AOSLO-net can segment out these missed vessels (from complicated background with numerous vessels), which is essential for further morphological analysis.
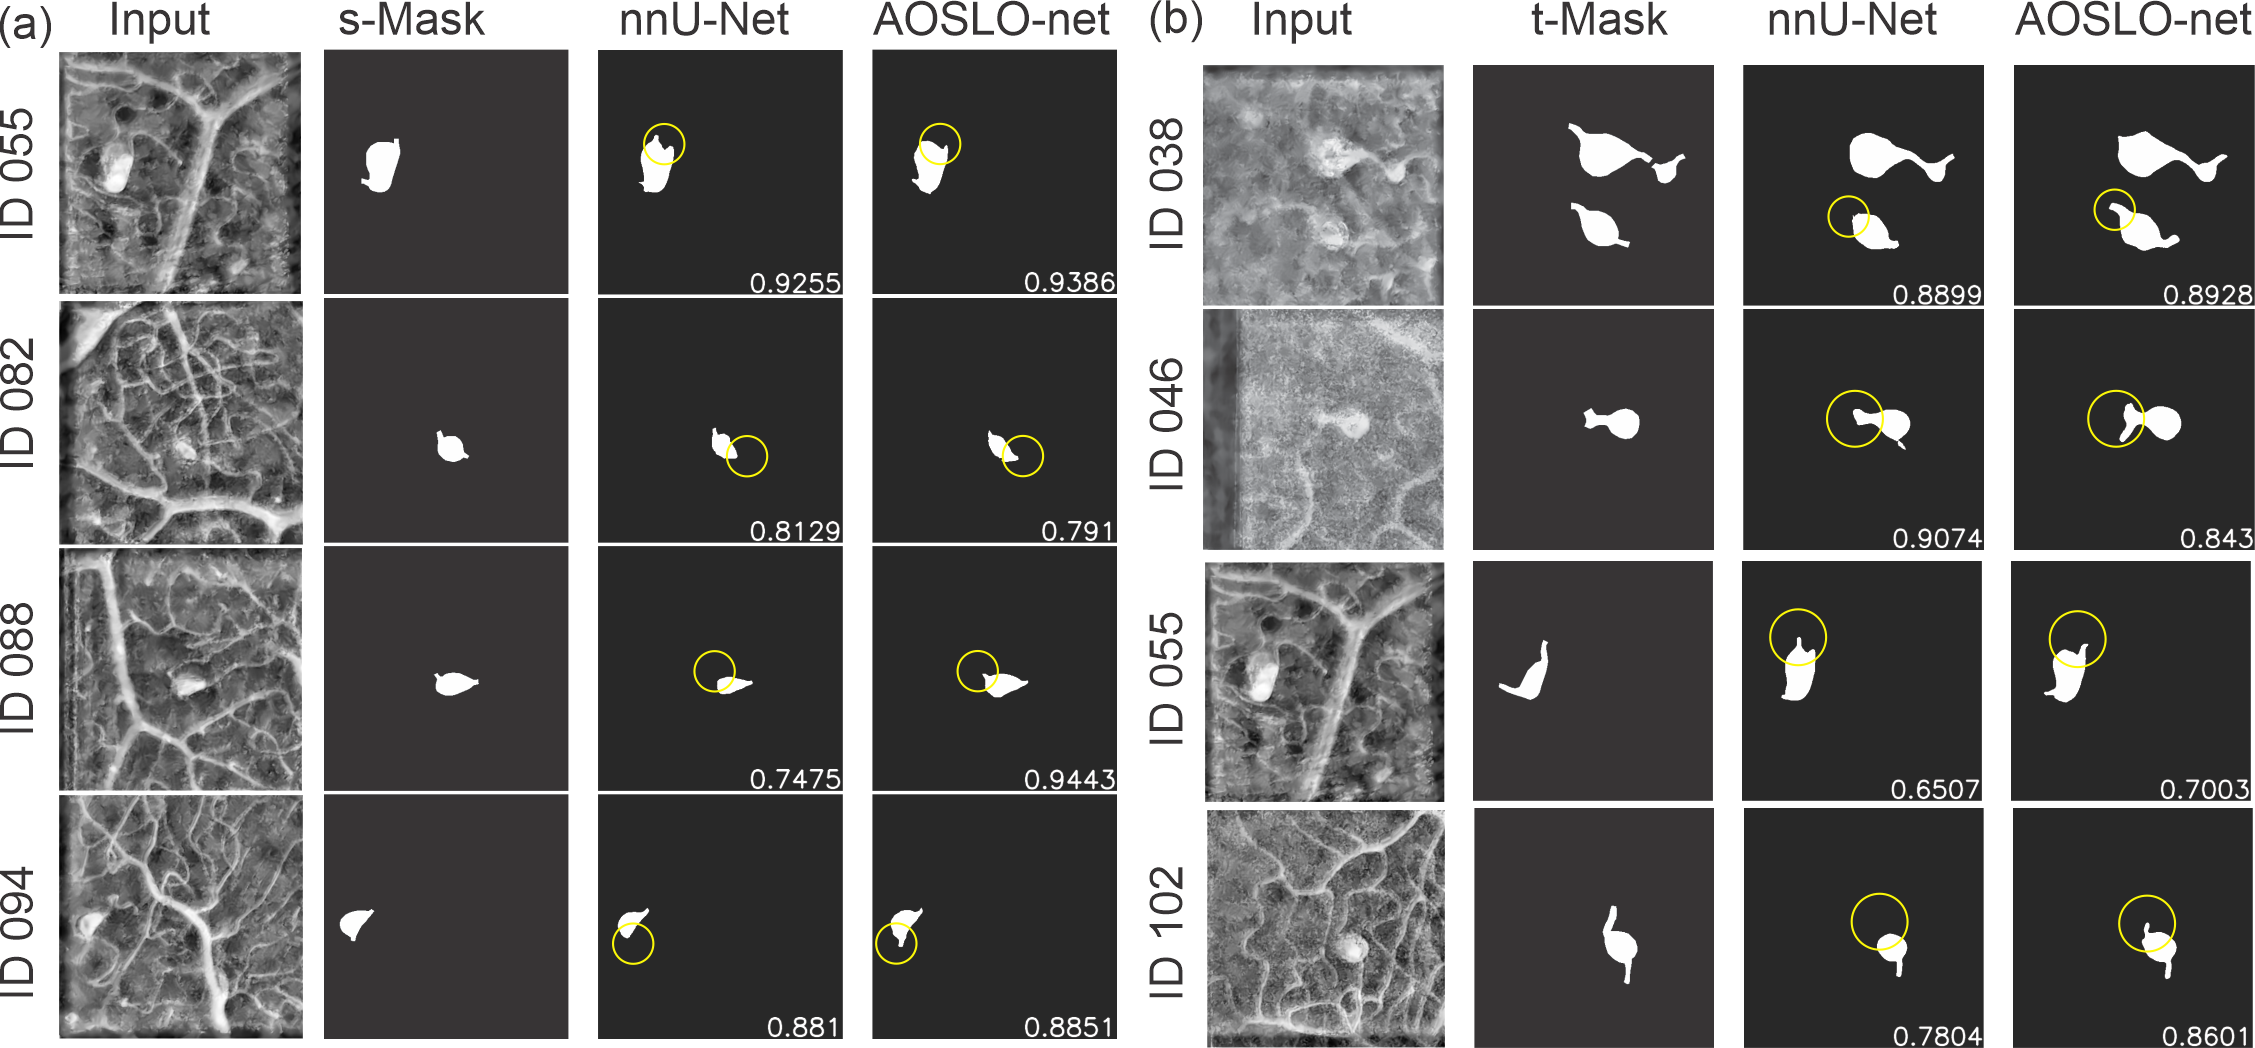
Next, we use another two sets of masks: one with shorter vessels compared to the normal dataset and one with thicker vessels, as learning targets to train AOSLO-net and nnUNet and compare their performance on detecting the feeding and draining vessels of MAs. We first train the model with short vessel mask dataset. The predictions from the two models in Fig. 5(a) show that the performances of nnUNet and AOSLO-net on detecting feeding and draining vessels are both compromised, as the shorter vessel masks provide less vessel end information. However, the AOSLO-net still can detect correct vessels in these four cases whereas nnUNet fails to predict some of the vessel ends (highlighted in yellow circle). These comparisons indicate that AOSLO-net is more robust against vessel length of the training masks.
When trained with thick vessel mask set, as shown in Fig. 5(b), AOSLO-net outperforms the nnUNet although the predictions of nnUNet have improved in detecting the feeding and draining vessels of MAs. Fig. 5(b) shows that while nnUNet misses the MA bodies and vessel ends connected to MAs (highlighted in yellow circle), AOSLO-net can detect these feeding and draining vessels. These results again demonstrate the robustness of AOSLO-net when trained with varying vessel thickness.
Morphology Quantification for the MA segmentation maps
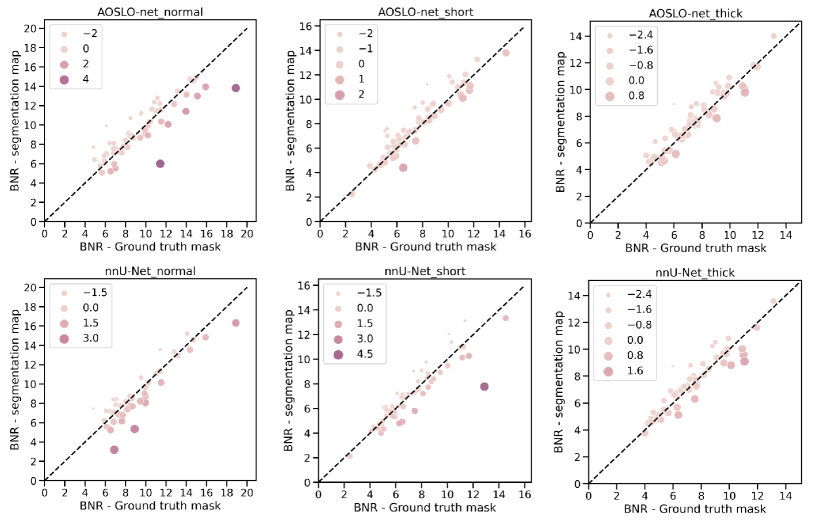
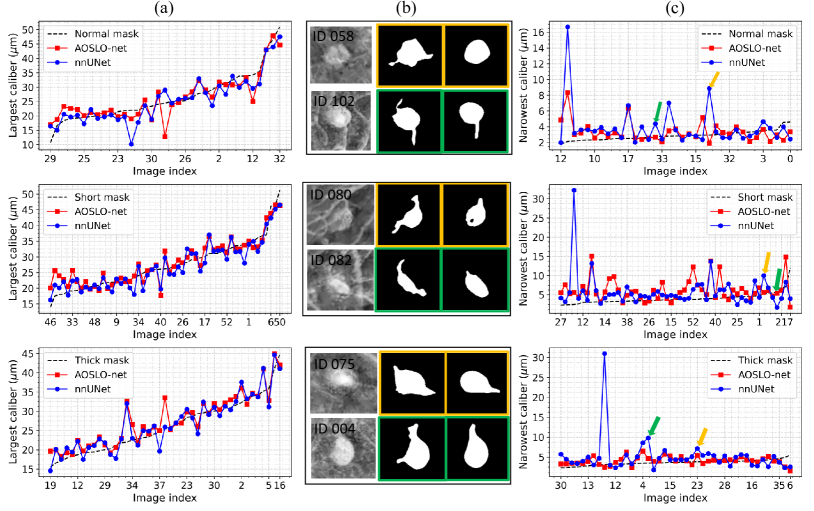
In order to better evaluate the MA segmentation performance of AOSLO-net and nnUNet, we compute three important MA morphological indices (“largest caliber” - , “narrowest caliber” - and the “body-to-neck ratio” - ) defined in [14] to quantify the specific morphological characteristics for the segmented MAs. Specifically, we first compute the MA skeleton (or medial-axis) for every single MA using the “Scikit-image” package [45], and then apply the Euclidean distance transformation to compute the medial radius distances ( is the number of points on the MA skeleton) from all points of the MA skeleton to the background pixels (i.e., pixels of each MA contour). Consequently, the value for each single MA corresponds to twice of the largest distance value in the sorted distance list . Due to the varied vessel lengths of different MAs, we calculate the NC value for each single MA by selecting the 10 smallest medial radius distances from , and double the average medial radius distances as the final value. Based on the and values, the BNR value for each MA can be computed by using . Fig. 6 gives some examples of the LC and NC quantification results for the segmented MAs predicted by AOSLO-net and nnUNet trained with three different MA masks (normal, short and thick mask sets). From Fig. 6(a) and (c), we can find that the AOSLO-net trained with thick MA ground truth masks attains the best MA segmentation performance; the NC quantification results (red curve) as shown in the third row of Fig. 6(c) are very close to the reference NC values (black dashed line) obtained from the thick masks. More details about the corresponding examples of the enhanced MA perfusion maps and the MA segmentation results using AOSLO-net and nnUNet are, respectively, shown in columns 1-3 of Fig. 6(b). AOSLO-net can effectively detect the important small vessels for the heterogeneous MAs (see the 2nd column in Fig. 6(b)), which play a very important role in different downstream tasks, e.g., MA morphological parameter quantification (NC, BNR, convexity), MA severity stratification, and in hemodynamics simulations. The three blue dots with very high NC values in different rows of Fig. 6(c) are the same MAs for which nnUNet fails to detect the small vessels. Quantification results for the BNR of MAs based on the analysis of NC and LC is summarized in Fig.9 in SI.
Discussion and Summary
Although 2D fundus photography has been primarily employed for DR screening and severity grading, other advanced imaging modalities, such as AOSLO, which is currently used for disease investigation and primarily for research purposes, can provide additional information regarding the retinal microvascular pathology, such as monitoring of variations in blood flow rates [46], detection and identification of the MA morphologies [13], enhanced visualization of MA thrombus status [14], etc. The information from this imaging technique could be potentially used not only to improve the future accuracy of DR screening, but also to better predict the rate of DR worsening, with the goal of eventually providing individualized management and treatment intervention plans [47]. Due to the rapidly rising global prevalence of diabetes and shortage of skilled graders for retinal images, implementation of automatic screening techniques is desirable to accommodate the corresponding increasing need to screen and evaluate patients with diabetes ocular complications [28, 27]. Development of an automated segmentation technique for AOSLO images, which are at much smaller scale than fundus photographs, represents a unique challenge and provides the opportunity to elucidate the steps of in vivo worsening and regression of MAs, a key lesion in DR.
In the last decade, DCNN has become the state-of-the-art technique in processing retinal images. Although existing DCNN models have achieved high accuracy in analyzing fundus images, they have not been tested on retinal images from other modalities. In this work, we design AOSLO-Net to automatically segment MA bodies with their feeding and draining vessels from AOSLO images. We use a very deep model to extract high-level features to understand the MA morphology, which can vary substantially in shape and size between individual MAs, and to create segmentation based on that information. Our results show that the deep network structure can segment MAs from AOSLO images with high accuracy for both metrics and morphology.
Our AOSLO dataset has a limited size, containing less than 100 videos, so the deep structure of AOSLO-net may cause overfitting, and it can be hard to train. Therefore, it is necessary to perform data augmentation according to specific dataset. Moreover, the MAs are of different shapes and many of them are not similar to others. This requires the AOSLO segmentation to be a composition of many few-shot problems. Therefore, data augmentation is necessary to train the deep network and fully utilize the data. To optimize the data augmentation, we use horizontal and vertical flip, rotation in uniformly distributed angles and scaling to achieve maximum space configuration of MAs. As a result, the AOSLO-net can learn MA geometric information very effectively from the limited dataset. In addition, transfer learning is desirable for training large and deep networks. In the current study, we use EfficientNet-b3 [48] as the feature extractor (encoder), and pretrain AOSLO-net with ImageNet dataset [49], which is believed to accelerate the training convergence and is widely deployed in transfer learning based image analysis.
The relationship between model performance metrics and morphological features of MAs is also investigated carefully in our work. Accurate detection of feeding and draining vessels of MAs is critical to determine MA morphology, which is important to predict blood flow characteristics and estimate the likelihood of thrombosis within the MA [13]. Since the areas of the end of the parenting vessels are much smaller compared to the areas of the whole MAs, regional loss, like Dice and IoU, possibly ignore these vessel ends, and place too much emphasis on the MA bodies. However, correct segmentation of MA bodies alone is not sufficient for further classification. Thus, metrics like Dice and IoU are important but should not be the only metrics to evaluate the performance of MA segmentation. Our results demonstrate that AOSLO-net not only achieves high scores on these two metrics, but also captures the detailed features of the feeding and draining vessels of MAs, and therefore promises to be an effective MA segmentation method in the clinic.
Methods
Image pre-processing
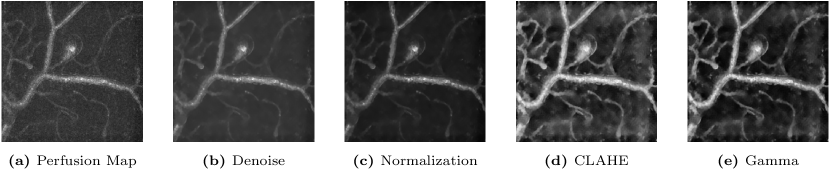
As shown in Fig. 1(b), the raw AOSLO images are featured with intense background noise and low contrast. Thus, we perform imaging pre-processing on these raw images and generate multi-modality images to improve the effectiveness of the training. First, we generate a set of perfusion maps by tracing the blood flow in the MAs and micro-vessels using the pixel-by-pixel standard deviation method on different frames of the AOSLO video [14]. As shown in Fig. 1(c), the vessels with blood motion appear bright in the perfusion map, while static tissue shows up as dark background. To improve the quality of the perfusion maps, we apply the following methods to denoise and enhance the images: (1) we employ fast non-local means method to remove the background noise; (2) use normalization to make the pixel value lie in the interval ; (3) apply contrast limits adaptive histogram equalization (CLAHE) to enhance image contrast without over stretching the contrast in specific areas and balance the overall contrast; (4) apply Gamma Correction to remove some bright stripes on the background surrounding tissues caused by CLAHE. The impact of each of these four pre-processing steps on the raw perfusion maps is illustrated in Fig. 7 in SI.
Perfusion maps may not be able to accurately illustrate the geometries for all MAs as thrombosis may occur in some of the MAs, which leads to presence of nonperfused areas [14, 18]. Therefore, we have developed enhanced AOSLO images to provide more details on the boundaries of each MA, as shown in Fig. 1(d). The procedure of creating enhanced AOSLO images follows three main steps: (i) taking the average over all the frames in MA video; (ii) reversing image colour; (iii) performing local mean filtering. We note that in some enhanced AOSLO images, the boundaries of MAs and their parenting vessels are not clearly illustrated due to the low quality of the AOSLO images. Therefore, we further generate a two-channel image set by concatenating perfusion map and enhanced AOSLO images (see Fig. 1(e)), which use the information of the blood flow inside MAs to compensate the missing information of the MA boundaries.
Due to the limited size of the AOSLO data set, we employ data augmentation to increase the number of images for training the AOSLO-net. We apply three types of transformations, including flip, rotate and scaling, to the AOSLO images (perfusion map, enhance AOSLO and two-channel images) and their corresponding masks. The augmentation procedure follows three steps: (1) images are flipped horizontally and vertically with probability of 0.5; (2) flipped images are rotated with angles in the set
where is selected to be 32. (3) The rotated images are scaled with a factor randomly selected between 0.7 and 1.4 to improve the robustness of AOSLO-net on segmenting MAs with varying sizes. Typical examples of augmented images are shown in Fig. 8 in SI.
Architecture of AOSLO-net and network training
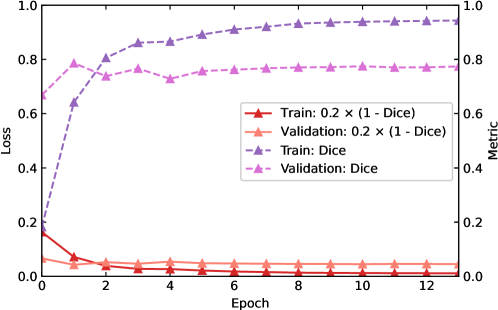
Inspired by the popular UNet structure [33], AOSLO-net is composed of two key parts: encoder and decoder. The function of the encoder is to extract the features of MAs at different levels whereas the decoder integrates these extracted features to compose the segmentation results. Since the role of the encoder is critical to the performance of the segmentation model, we adopt the current SOTA image classification network EfficientNet-b3 [48] with a depth of 5 as the encoder in the AOSLO-net. We also apply transfer learning in AOSLO-net through pre-training the EfficientNet-b3 using ImageNet [49] to achieve quick convergence during training. The evolution of the loss in the training process can be found in Figs. 11 and 13 in SI.
The pre-processed AOSLO images are split into 5 folds. While one fold is reserved as test data, the rest 4 folds are used to train and validate the AOSLO-net. We perform a 10-fold cross-validation using these 4 folds of images, meaning that these images are further separated into 10 folds, with 9 folds used for training after augmentation and one fold used for validation. Overall, 1600 augmented images are used to train the AOSLO-net. 10 images are used for validation and 17 images are used to test the model performance.
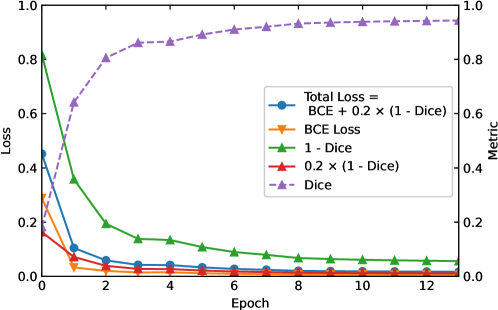
The loss function is a combination of binary cross-entropy and Dice loss,
where BCE and Dice are defined as
Here, are model prediction and target respectively, are pixel values in and ; is set to 0.2 to equalize the contribution of BCE and Dice to the loss. We also introduce Hausdorff distance, which is commonly used to describe the contour difference of two shape, into the loss function, but it does not improve the segmentation results (see Fig.6 in SI).
We use the Adam optimizer with learning rate of 0.001 and weight decay of . During training, a Plateau scheduler is specified such that once the validation loss does not decrease for epochs, the learning rate is decreased to of the current value to facilitate the convergence of the AOSLO-net. The training is initially set to last 200 epochs, but it may end earlier due to the implementation of Plateau scheduler. The batch size is set to 16.
Post-Processing and Ensembling
Binarization. The pixel value of the outputted images from AOSLO-net lies within range [0, 1] resulting from employing the sigmoid activation function in the last layer of AOSLO-net. To quantify the geometries of MAs, we convert these pixel values into a binary form, meaning that the pixel value is either 1 (belongs to an MA), or 0 (not MA). A threshold of 0.5 is applied to binarize the segmented images in the current study.
Clearing. We note that some segmented images contain small fragments that are mistakenly predicted as MAs. Thus, we specify an area threshold of 1024 pixels, below which the fragments are removed from the segmented images.
Ensembling. Following the work of [39], we employ ensembling method by selecting three best models, out of the 10 trained models, based on their performance on the validation set and perform a union of their outputs to improve the model performance. Some examples illustrating the effect of post-processing are shown in Fig. 14 in SI.
Performance metrics
We evaluate the segmentation performance of AOSLO-net and other segmentation models using the Dice coefficient and intersection of union (IoU), defined as follows,
| (1) | ||||
where and denote the matrix representations of the target image and the corresponding prediction image, respectively.
Data availability
The dataset used in the current study is not currently available publicly, but it will be released upon request.
Code availability
The code is not currently available publicly but could be released upon publication of this manuscript.
Duality of Interest.
No potential conflicts of interest relevant to this article were reported.
Acknowledgements.
Q.Z., M.X., S.C., Y.D., H.L. and G.E.K. acknowledge the support from R01 HL154150 and U01 HL142518. K.S. and J.K.S. acknowledge the support by NEI 5R01EY024702-04 as well as grants from Research to Prevent Blindness, JDRF 3-SRA-2014-264-M-R, and the Massachusetts Lions Eye Research Fund. High Performance Computing resources were provided by the Center for Computation and Visualization at Brown University and the Extreme Science and Engineering Discovery Environment (XSEDE), which is supported by National Science Foundation grant numbers ACI-1053575, TG-DMS140007 and TG-MCB190045.
Author Contribution.
Q.Z., K.S., M.X., S.C., Y.D., H.L., J.K.S. and G.E.K. contributed to the study concept and design. Q.Z., K.S., S.C., Y.D. and H.L. contributed to acquisition, analysis, or interpretation of data. Q.Z., K.S., M.X., S.C., Y.D., H.L., J.K.S. and G.E.K. contributed to drafting of the manuscript. Q.Z., M.X., S.C., Y.D., H.L. and G.E.K. contributed to algorithm development. Q.Z. and M.X. performed hardware implementation. Q.Z. and M.X. contributed to statistical analysis. J.K.S. and G.E.K supervised the project.
References
- [1] Centers for Disease Control and Prevention. https://www.cdc.gov/diabetes/index.html.
- [2] National Institutes of Health. https://www.nei.nih.gov/learn-about-eye-health/resources-for-health-educators/eye-health-data-and-statistics/diabetic-retinopathy-data-and-statistics.
- [3] David A Antonetti, Paolo S Silva, and Alan W Stitt. Current understanding of the molecular and cellular pathology of diabetic retinopathy. Nature Reviews Endocrinology, 17(4):195–206, 2021.
- [4] Grading diabetic retinopathy from stereoscopic color fundus photographs—an extension of the modified airlie house classification: Etdrs report number 10. Ophthalmology, 98(5, Supplement):786–806, 1991.
- [5] Charles P Wilkinson, Frederick L Ferris III, Ronald E Klein, Paul P Lee, Carl David Agardh, Matthew Davis, Diana Dills, Anselm Kampik, R Pararajasegaram, Juan T Verdaguer, et al. Proposed international clinical diabetic retinopathy and diabetic macular edema disease severity scales. Ophthalmology, 110(9):1677–1682, 2003.
- [6] Tien Y Wong, Chui Ming Gemmy Cheung, Michael Larsen, Sanjay Sharma, and Rafael Simó. Diabetic retinopathy. Nature Reviews Disease Primers, 2(1216), 2016.
- [7] May Phu Paing, Somsak Choomchuay, and MD Rapeeporn Yodprom. Detection of lesions and classification of diabetic retinopathy using fundus images. In 2016 9th Biomedical Engineering International Conference (BMEiCON), pages 1–5. IEEE, 2016.
- [8] Qi Yan, Daniel E Weeks, Hongyi Xin, Anand Swaroop, Emily Y Chew, Heng Huang, Ying Ding, and Wei Chen. Deep-learning-based prediction of late age-related macular degeneration progression. Nature Machine Intelligence, 2(2):141–150, 2020.
- [9] Akinori Mitani, Abigail Huang, Subhashini Venugopalan, Greg S Corrado, Lily Peng, Dale R Webster, Naama Hammel, Yun Liu, and Avinash V Varadarajan. Detection of anaemia from retinal fundus images via deep learning. Nature Biomedical Engineering, 4(1):18–27, 2020.
- [10] Changyow C Kwan and Amani A Fawzi. Imaging and biomarkers in diabetic macular edema and diabetic retinopathy. Current Diabetes Reports, 19(10):95, 2019.
- [11] Enrico Borrelli, Riccardo Sacconi, Maria Brambati, Francesco Bandello, and Giuseppe Querques. In vivo rotational three-dimensional octa analysis of microaneurysms in the human diabetic retina. Scientific Reports, 9(1):1–8, 2019.
- [12] Yoshihiro Kaizu, Shintaro Nakao, Iori Wada, Mitsuru Arima, Muneo Yamaguchi, Keijiro Ishikawa, Masato Akiyama, Junji Kishimoto, Toshio Hisatomi, and Koh-Hei Sonoda. Microaneurysm imaging using multiple en face oct angiography image averaging: morphology and visualization. Ophthalmology Retina, 4(2):175–186, 2020.
- [13] Michael Dubow, Alexander Pinhas, Nishit Shah, Robert F Cooper, Alexander Gan, Ronald C Gentile, Vernon Hendrix, Yusufu N Sulai, Joseph Carroll, Toco YP Chui, et al. Classification of human retinal microaneurysms using adaptive optics scanning light ophthalmoscope fluorescein angiography. Investigative Ophthalmology & Visual Science, 55(3):1299–1309, 2014.
- [14] Miguel O Bernabeu, Yang Lu, Omar Abu-Qamar, Lloyd Paul Aiello, and Jennifer K Sun. Estimation of diabetic retinal microaneurysm perfusion parameters based on computational fluid dynamics modeling of adaptive optics scanning laser ophthalmoscopy. Frontiers in Physiology, 9:989, 2018.
- [15] Beau J Fenner, Raymond LM Wong, Wai-Ching Lam, Gavin SW Tan, and Gemmy CM Cheung. Advances in retinal imaging and applications in diabetic retinopathy screening: a review. Ophthalmology and Therapy, 7(2):333–346, 2018.
- [16] Alberto de Castro, Gang Huang, Lucie Sawides, Ting Luo, and Stephen A Burns. Rapid high resolution imaging with a dual-channel scanning technique. Optics Letters, 41(8):1881–1884, 2016.
- [17] Vivian Schreur, Artin Domanian, Bart Liefers, Freerk G Venhuizen, B Jeroen Klevering, Carel B Hoyng, Eiko K de Jong, and Thomas Theelen. Morphological and topographical appearance of microaneurysms on optical coherence tomography angiography. British Journal of Ophthalmology, 103(5):630–635, 2019.
- [18] He Li, Konstantina Sampani, Xiaoning Zheng, Dimitrios P Papageorgiou, Alireza Yazdani, Miguel O Bernabeu, George E Karniadakis, and Jennifer K Sun. Predictive modelling of thrombus formation in diabetic retinal microaneurysms. Royal Society Open Science, 7(8):201102, 2020.
- [19] Justis P Ehlers, Kevin Wang, Amit Vasanji, Ming Hu, and Sunil K Srivastava. Automated quantitative characterisation of retinal vascular leakage and microaneurysms in ultra-widefield fluorescein angiography. British Journal of Ophthalmology, 101(6):696–699, 2017.
- [20] Syna Sreng, Noppadol Maneerat, and Kazuhiko Hamamoto. Automated microaneurysms detection in fundus images using image segmentation. In 2017 International Conference on Digital Arts, Media and Technology (ICDAMT), pages 19–23. IEEE, 2017.
- [21] Meysam Tavakoli, Sina Jazani, and Mahdieh Nazar. Automated detection of microaneurysms in color fundus images using deep learning with different preprocessing approaches. In Medical Imaging 2020: Imaging Informatics for Healthcare, Research, and Applications, volume 11318, page 113180E. International Society for Optics and Photonics, 2020.
- [22] Caixia Kou, Wei Li, Wei Liang, Zekuan Yu, and Jianchen Hao. Microaneurysms segmentation with a U-Net based on recurrent residual convolutional neural network. Journal of Medical Imaging, 6(2):025008, 2019.
- [23] R Murugan, Anitha Juliette Albert, and Deepak Kumar Nayak. An automatic localization of microaneurysms in retinal fundus images. In 2019 International Conference on Smart Structures and Systems (ICSSS), pages 1–5. IEEE, 2019.
- [24] Yutong Xie, Jianpeng Zhang, Hao Lu, Chunhua Shen, and Yong Xia. Sesv: Accurate medical image segmentation by predicting and correcting errors. IEEE Transactions on Medical Imaging, 40(1):286–296, 2020.
- [25] Jan Lammer, Sonja G Karst, Michael M Lin, Michael Cheney, Paolo S Silva, Stephen A Burns, Lloyd Paul Aiello, and Jennifer K Sun. Association of microaneurysms on adaptive optics scanning laser ophthalmoscopy with surrounding neuroretinal pathology and visual function in diabetes. Investigative Ophthalmology & Visual Science, 59(13):5633–5640, 2018.
- [26] Stela Vujosevic, Stephen J Aldington, Paolo Silva, Cristina Hernández, Peter Scanlon, Tunde Peto, and Rafael Simó. Screening for diabetic retinopathy: new perspectives and challenges. The Lancet Diabetes & Endocrinology, 8(4):337–347, 2020.
- [27] Ramachandran Rajalakshmi. The impact of artificial intelligence in screening for diabetic retinopathy in india. Eye, 30(34):420–421, 2020.
- [28] Jie He, Tingyi Cao, Feiping Xu, Shasha Wang, Haiqi Tao, Tao Wu, Liyan Sun, and Jili Chen. Artificial intelligence-based screening for diabetic retinopathy at community hospital. Eye, 34(3):572–576, 2020.
- [29] Andrzej Grzybowski, Piotr Brona, Gilbert Lim, Paisan Ruamviboonsuk, Gavin SW Tan, Michael Abramoff, and Daniel SW Ting. Artificial intelligence for diabetic retinopathy screening: a review. Eye, pages 1–10, 2019.
- [30] Harry Pratt, Frans Coenen, Deborah M Broadbent, Simon P Harding, and Yalin Zheng. Convolutional neural networks for diabetic retinopathy. Procedia Computer Science, 90:200–205, 2016.
- [31] Brodie Fischbacher, Sarita Hedaya, Brigham J Hartley, Zhongwei Wang, Gregory Lallos, Dillion Hutson, Matthew Zimmer, Jacob Brammer, and Daniel Paull. Modular deep learning enables automated identification of monoclonal cell lines. Nature Machine Intelligence, pages 1–9, 2021.
- [32] Paweł Liskowski and Krzysztof Krawiec. Segmenting retinal blood vessels with deep neural networks. IEEE Transactions on Medical Imaging, 35(11):2369–2380, 2016.
- [33] Olaf Ronneberger, Philipp Fischer, and Thomas Brox. U-Net: Convolutional networks for biomedical image segmentation. In International Conference on Medical Image Computing and Computer-assisted Intervention, pages 234–241. Springer, 2015.
- [34] Xiao Xiao, Shen Lian, Zhiming Luo, and Shaozi Li. Weighted res-unet for high-quality retina vessel segmentation. In 2018 9th International Conference on Information Technology in Medicine and Education (ITME), pages 327–331. IEEE, 2018.
- [35] Yijun Bao, Somayyeh Soltanian-Zadeh, Sina Farsiu, and Yiyang Gong. Segmentation of neurons from fluorescence calcium recordings beyond real time. Nature Machine Intelligence, pages 1–11, 2021.
- [36] Qiangguo Jin, Zhaopeng Meng, Tuan D Pham, Qi Chen, Leyi Wei, and Ran Su. Dunet: A deformable network for retinal vessel segmentation. Knowledge-Based Systems, 178:149–162, 2019.
- [37] Md Zahangir Alom, Chris Yakopcic, Mahmudul Hasan, Tarek M Taha, and Vijayan K Asari. Recurrent residual U-Net for medical image segmentation. Journal of Medical Imaging, 6(1):014006, 2019.
- [38] Liangzhi Li, Manisha Verma, Yuta Nakashima, Hajime Nagahara, and Ryo Kawasaki. Iternet: Retinal image segmentation utilizing structural redundancy in vessel networks. In The IEEE Winter Conference on Applications of Computer Vision, pages 3656–3665, 2020.
- [39] Fabian Isensee, Paul F Jaeger, Simon AA Kohl, Jens Petersen, and Klaus H Maier-Hein. nnU-Net: a self-configuring method for deep learning-based biomedical image segmentation. Nature Methods, 18(2):203–211, 2021.
- [40] Yang Lu, Miguel O Bernabeu, Jan Lammer, Charles C Cai, Martin L Jones, Claudio A Franco, Lloyd Paul Aiello, and Jennifer K Sun. Computational fluid dynamics assisted characterization of parafoveal hemodynamics in normal and diabetic eyes using adaptive optics scanning laser ophthalmoscopy. Biomedical Optics Express, 7(12):4958–4973, 2016.
- [41] Caroline A Schneider, Wayne S Rasband, and Kevin W Eliceiri. NIH image to imagej: 25 years of image analysis. Nature Methods, 9(7):671, 2012.
- [42] Zhengxin Zhang and Qingjie Liu. Road extraction by deep residual U-Net. IEEE Geoscience and Remote Sensing Letters, PP, 11 2017.
- [43] Pavel Yakubovskiy. Segmentation models pytorch. https://github.com/qubvel/segmentation_models.pytorch, 2020.
- [44] Jifeng Dai, Haozhi Qi, Yuwen Xiong, Yi Li, Guodong Zhang, Han Hu, and Yichen Wei. Deformable convolutional networks. In Proceedings of the IEEE International Conference on Computer Vision, pages 764–773, 2017.
- [45] Stefan Van der Walt, Johannes L Schönberger, Juan Nunez-Iglesias, François Boulogne, Joshua D Warner, Neil Yager, Emmanuelle Gouillart, and Tony Yu. scikit-image: image processing in python. PeerJ, 2:e453, 2014.
- [46] Aude Couturier, Valérie Mané, Sophie Bonnin, Ali Erginay, Pascale Massin, Alain Gaudric, and Ramin Tadayoni. Capillary plexus anomalies in diabetic retinopathy on optical coherence tomography angiography. Retina, 35(11):2384–2391, 2015.
- [47] James Kang Hao Goh, Carol Y Cheung, Shaun Sebastian Sim, Pok Chien Tan, Gavin Siew Wei Tan, and Tien Yin Wong. Retinal imaging techniques for diabetic retinopathy screening. Journal of Diabetes Science and Technology, 10(2):282–294, 2016.
- [48] Mingxing Tan and Quoc Le. Efficientnet: Rethinking model scaling for convolutional neural networks. In International Conference on Machine Learning, pages 6105–6114. PMLR, 2019.
- [49] Jia Deng, Wei Dong, Richard Socher, Li-Jia Li, Kai Li, and Li Fei-Fei. Imagenet: A large-scale hierarchical image database. In 2009 IEEE Conference on Computer Vision and Pattern recognition, pages 248–255. IEEE, 2009.
Appendix A Data
A.1 Preprocessing on Perfusion Map
A.2 Data augmentation
Appendix B AOSLO-net model
B.1 Network

UNet. The vanilla version of UNet[33] was proposed in 2015. This network tends to erroneously predict the background vessels as MAs, and overall the predicted MA shapes are not satisfactory.
Deformable UNet. Deformable UNet[36] uses the deformable convolution layer instead of the original convolution layer. Deformable UNet shows improved performance on distinguishing the MAs from the vessels, but it fails to capture the MA shape and vessels connected to MAs.
ResUNet. We implemented ResUNet with Segmentation Models Pytorch[43], a python package. ResNet101 was used as backbone, which included more parameters than the official implementation. As a result, this UNet is able to better capture the MA shape and the inlet outlet vessels. However, the overall performance of this UNet is not sufficient for MA shape quantification.
ResNet-based Deformable UNet. The main body of this kind of UNet is the same as the ResNet-based UNet, but the convolution layers are replaced to be deformable ones. We implemented it by substituting ordinary convolution kernel in Segmentation Models Pytorch with a deformable convolution kernel[44]. But these modifications do not improve model performance on segmenting AOSLO images.
EfficientNet-based UNet. Using EfficientNet-b3[48], a SOTA classification network, as encoder in AOSLO-net has show significant improvements over the models listed above. We use the implementation from Segmentation Models Pytorch.
B.2 Loss
Binary CrossEntropy (BCE) is the most common loss function for classification and segmentation. However, in our study, there is also a strong imbalance since the MA areas are relatively small compared with the whole image. Under these circumstances, the BCE loss was overwhelmed and the neural network predicted MAs as background. To overcome this imbalance, we use regional loss based on Dice and IoU to maximize the intersection ratio of the prediction and the ground truth.
Despite the advantage of regional loss like Dice and IoU, they may cause oscillation of the training loss curve. Thus, we added BCE as a smoothing loss to the regional loss. We used a coefficient to equalize contribution of BCE and regional loss as shown in Figure 11.
We also tested the Hausdorff distance, which is defined as
| (2) |
where is prediction and is target, is metric of the space, which is the Eucleadian distance in our case. The Hausdorff distance is used to describe the contour difference of two shape. However, as shown in Fig. 12, the effect of using the Hausdorff distance as part of the loss was not notable to our current method.
B.3 Optimizer
We first used the SGD as optimizer, the default for many deep learning based computer vision problems and we found that loss descending rate is very slow. Thus, we employ Adam optimizer and the training usually converged in 20 epochs. More importantly, after using Adam as optimizer, the segmentation performance on validation and test set is also improved.
In order to prevent the overfitting, we used the Plateau learning rate scheduler. When the validation loss does not decrease for epochs, the scheduler decreases the learning rate to of the current one, so the network converges before overfitting. The effect of using the scheduler is illustrated in Figure 13, where the training finished in less than 15 epochs, while nnU-Net will use 1000 epochs by default.
Appendix C Post Processing
C.1 Binarization and Clearing
C.2 Morphology quantification results for the BNR factor of MAs