Deep Contextual Learners for Protein Networks
Abstract
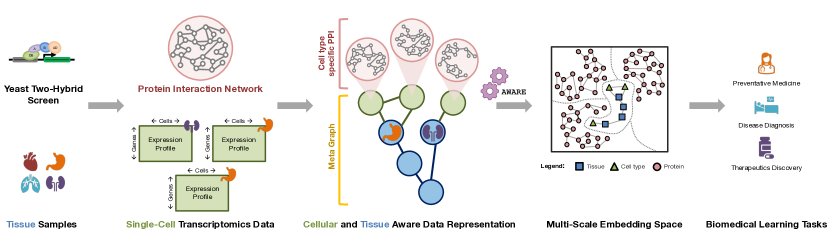
Spatial context is central to understanding health and disease. Yet reference protein interaction networks lack such contextualization, thereby limiting the study of where protein interactions likely occur in the human body and how they may be altered in disease. Contextualized protein interactions could better characterize genes with disease-specific interactions and elucidate diseases’ manifestation in specific cell types. Here, we introduce aware, a graph neural message passing approach to inject cellular and tissue context into protein embeddings. aware optimizes for a multi-scale embedding space, whose structure reflects network topology at a single-cell resolution. We construct a multi-scale network of the Human Cell Atlas and apply aware to learn protein, cell type, and tissue embeddings that uphold cell type and tissue hierarchies. We demonstrate aware’s utility on the novel task of predicting whether a protein is altered in disease and where that association most likely manifests in the human body. To this end, aware outperforms generic embeddings without contextual information by at least , showing aware’s potential to reveal context-dependent roles of proteins in disease.
1 Introduction
Modeling interactions between proteins has been crucial for disentangling the rich diversity of complex biological phenomena, such as the mechanisms underlying organ function in multicellular organisms (Luck et al., 2020; Bassett & Sporns, 2017) and disease processes (Cheng et al., 2018; Menche et al., 2015; Sonawane et al., 2019). However, protein interaction (PPI) networks are typically presented as generic maps without contextual information about the particular cell type, disease state, and external stresses and stimuli on the system, which are known to have an influence on protein interactions and their function (Przytycka et al., 2010; Ideker & Krogan, 2012; Zhang et al., 2016; Willsey et al., 2018; Markmiller et al., 2018). As a result, there have been many efforts to contextualize protein interactions, which have only further revealed underlying mechanisms of disease progression and drug action (Basha et al., 2020; Greene et al., 2015; Zitnik & Leskovec, 2017). Due to recent advancements in single-cell sequencing technology, we are now better equipped to investigate proteins and their roles in disease across tissues and at a single-cell resolution (Kamies & Martinez-Jimenez, 2020; Saviano et al., 2020).
Integrated single-cell transcriptomics and PPI network maps have already yielded insights into functional modules and gene-interaction dynamics of disease (Klimm et al., 2020; Mohammadi et al., 2019). Prevailing approaches construct cell type specific PPI subnetworks and apply network analytical techniques on them individually (Cha & Lee, 2020). While such contextualized protein networks are powerful resources for descriptive analyses, they cannot generate optimized representations and provide predictions in downstream tasks. They could greatly benefit from the predictive capacity provided by deep graph learning, an emerging area founded upon key principles of network science (Li et al., 2021). A deep graph learning approach could capture networks’ topology and generate compact embeddings that could be easily specialized to cellular and tissue contexts.
Here, we develop aware, a multi-scale graph neural network (GNN) to learn embeddings at various scales, guided by the hierarchical structure and function of cells and tissues. aware integrates cellular and tissue contextual information in the GNN architecture itself. As a result, aware can incorporate cell-specific gene expression into PPI networks while injecting the structure of protein interactions and cell type and tissue hierarchies. We evaluate aware on the Human Cell Atlas and cell type specific disease-gene associations, and demonstrate that aware embeddings outperform generic embeddings by at least 12.5%, thus highlighting the importance of contextual learners for protein networks.
2 Methods
We start by describing the construction of our cell type specific PPI subnetworks, and proceed with an overview of our multi-scale graph neural network approach, aware.
2.1 Constructing cell type specific protein networks
We extract cell type specific PPI subnetworks from a global PPI network based on differential gene expression without making any modifications. We first process, normalize, cluster, and annotate our single-cell transcriptomics (scRNA-seq) dataset using SCANPY (Wolf et al., 2018) and SCSA (Cao et al., 2020). We then select the top differentially expressed genes in each cluster (or cell type). We create a subgraph from these nodes, and continuously add nodes until is connected. Ultimately, each cell type specific PPI subnetwork (for cell types) consists of the top differentially expressed genes.
2.2 Contextualing embeddings of protein networks
Our method, aware, has four components: (1) Initializing cell type specific PPI embeddings using node- and semantic-level attention (Sec. 2.2.1); (2) Up-pooling from cell type specific PPI embeddings to update cell type embeddings (Sec. 2.2.2); (3) Updating cell type and tissue embeddings using node- and semantic-level attention (Sec. 2.2.1); and (4) Updating cell type specific PPI embeddings using node- and semantic-level attention, and down-pooling from cell type embeddings to regularize the cell type specific PPI embeddings (Sec. 2.2.2). In the following sections, we explain the details of our node- and semantic-level attention, up- and down-pooling steps, and overall objective function.
2.2.1 Node- and semantic-level attention
We aggregate information from neighbors in each meta-path (i.e. sequence of node types; see Sun et al. (2011) for the definition of meta-paths) using node- and semantic-level attention mechanisms (Wang et al., 2019). Our node-level attention learns the importance of node to its neighbor connected by meta-path at layer : , where is the number of attention heads, denotes concatenation, is the nonlinear activation function, is the set of neighbors for connected by (includes itself via self-attention), is a type-specific transformation matrix to project the features of , and is the previous layer’s embedding for . After generating node embeddings for every meta-path, our semantic-level attention learns the importance of each meta-path to such that . We learn protein embeddings via the protein-protein meta-path, and cell type and tissue embeddings via the celltype-celltype, celltype-tissue, and tissue-tissue meta-paths.
2.2.2 Up-pooling and down-pooling
Since we define cell types by their most differentially-expressed genes (Sec. 2.1), we up-pool information from the embeddings of such genes in their corresponding PPI subnetworks. We initialize cell type embeddings by taking the average of their proteins’ embeddings, weighted by the proteins’ relative differential expression such that , where is the embedding of node in the PPI subnetwork for cell type . We initialize tissue embeddings by taking the average of their neighbors: . For , we up-pool from cell type specific PPI embeddings using an attention mechanism to learn the importance of node to cell type such that . Note that we are learning the weights of proteins that are important, which could be useful for identifying novel cell type biomarkers.
After propagating cell type and tissue information in the meta graph via node- and semantic-level attention (Sec. 2.2.1), we down-pool from cell type to its corresponding PPI subnetwork by leveraging the learned importance of node to such that . Intuitively, we are imposing the structure of the meta graph onto the PPI subnetworks based on the proteins’ importance to their corresponding cell type’s identity.
2.2.3 Overall objective function
To capture the structure of cell type specific PPI subnetworks and the meta graph, we apply softmax on link prediction. Additionally, to optimize meta-graph-based clustering of the cell type specific PPI embeddings, we use center loss (Wen et al., 2016) to predict the associated cell type of each protein: for samples. Thus, , where is a hyperparameter.
3 Experimental setup and results
Here, we describe our protein, cellular, and tissue datasets, baseline methods, and implementation details.
3.1 Datasets
Global protein interaction network. Our global PPI network is the union of physical multi-validated interactions from BioGRID (Oughtred et al., 2019; Stark et al., 2006), the Human Reference Interactome (Luck et al., 2020), and (Menche et al., 2015) with 15,461 nodes and 207,641 edges.
Human Cell Atlas. We integrate seven 10X scRNA-seq datasets from healthy individuals in the Human Cell Atlas (HCA) (Regev et al., 2017), and obtain 64 cell type specific PPI subnetworks, each with 1,645 proteins on average.
Cell type and tissue hierarchies. The meta graph is composed of cell type and tissue nodes. Cell type nodes are defined by the annotated clusters from scRNA-seq analysis (Sec. 2.1); cell-cell interactions, by CellPhoneDB (Efremova et al., 2020); celltype-tissue relationships, by meta-data from HCA; and tissue hierarchy, by BRENDA Tissue Ontology (Gremse et al., 2010). Here, we use 8 (of 64) cell types and 4 (of 50) tissues from the meta graph (Fig. 2a).
Disease-gene associations at single-cell resolution. We extract single-cell disease-gene associations from SC2disease (Zhao et al., 2021) for breast, liver, and lung cancers, Alzheimer’s disease (AD), rheumatoid arthritis (RA), autism spectrum disorder (ASD), lupus nephritis, pancreatic ductal adenocarcinoma, multiple sclerosis (MS), and atherosclerosis. Among these diseases, the overlapping cell types are T cells, astrocytes, and monocytes. The global and cell type specific PPI and our SC2disease dataset share 245 genes. We train and evaluate a KNN for predicting cell type specific disease-gene associations on 80% and 20% of the genes, respectively (Tbls. 1-2). In this limited dataset, only 20 labels have enough samples for evaluation.
3.2 Baseline methods and implementation details
To demonstrate the necessity of each component in aware, we perform ablation studies on its core features: cell type specificity (Sec. 2.1), meta graph regularization (Sec. 2.2.2), and prototypical loss (Sec. 2.2.3). In global, we ignore scRNA-seq information; in -mg, we turn off down-pooling (i.e. remove notion of cellular and tissue hierarchies); in -proto, we set (i.e. do not optimally separate cell type specific protein embeddings). Across all methods, our node feature matrix has dimension 2048; output layer has dimension 128; node- and semantic-level attentions have 8 heads; softmax and center loss . In aware, . We use PyTorch Geometric, Adam optimizer, and grid-search for hyperparameter tuning.
3.3 Results
Finally, we discuss the results of our experiments to evaluate the quality and utility of aware’s embeddings.
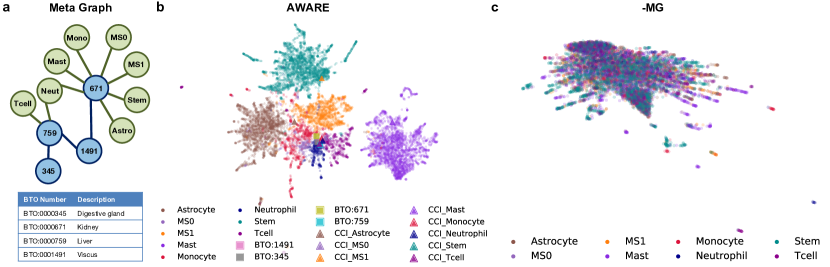
Learning cellular and tissue aware embeddings. Unlike global and -mg (Fig. 2b), which are unable to discern cell type specificity in the embedding space, the cellular and tissue aware embeddings generated by -proto and aware (Fig. 2c) cluster according to the meta graph’s structure. While -proto has less clear cell-type-separation, it is notable that -proto and aware can generate highly granular embeddings that capture cell type and tissue hierarchies.
Predicting cell type specific disease-gene associations. Embeddings generated with some notion of cellular and tissue hierarchy, i.e. aware and -proto, outperform those without it by at least 12.5% (Tbl. 1). aware and -proto embeddings have comparable or better performance than global embeddings in 15 (of 20) labels (Tbl. 2). In particular, they outperform global in predicting genes in T cells associated with breast cancer and MS by up to 50%; in monocytes associated with RA by 200%; and in astrocytes associated with atherosclerosis by 50%. Such improvements highlight the need to contextualize protein networks with biologically meaningful cell type and tissue dependencies.
| method | |||
|---|---|---|---|
| global | 0.240.01 | 0.20 0.01 | 0.06 0.01 |
| -mg | 0.15 0.01 | 0.13 0.01 | 0.02 0.01 |
| -proto | 0.27 0.01 | 0.28 0.01 | 0.11 0.01 |
| aware | 0.27 0.01 | 0.23 0.01 | 0.12 0.01 |
| disease | cell type | ntotal | global | -mg | -proto | aware |
| breast cancer | t cell | 24 | 0.60 0.16 | 0.900.10 | 0.900.10 | 0.800.13 |
| astrocyte | 2 | 0.200.13 | 0.200.13 | 0.200.13 | 0.200.13 | |
| liver cancer | t cell | 82 | 0.800.13 | 0.500.17 | 0.500.17 | 0.500.17 |
| astrocyte | 7 | 0.200.13 | 0.300.15 | 0.300.15 | 0.300.15 | |
| lung cancer | t cell | 117 | 0.900.10 | 0.600.16 | 0.600.16 | 0.600.16 |
| astrocyte | 8 | 0.400.16 | 0.400.16 | 0.400.16 | 0.400.16 | |
| alzheimer’s disease (ad) | t cell | 37 | 0.500.17 | 0.100.10 | 0.000.01 | 0.200.13 |
| astrocyte | 317 | 1.000.01 | 1.000.01 | 1.000.01 | 1.000.01 | |
| monocyte | 10 | 0.100.10 | 0.200.13 | 0.200.13 | 0.200.13 | |
| rheumatoid arthritis (ra) | t cell | 105 | 1.000.01 | 0.800.13 | 0.900.10 | 0.900.10 |
| astrocyte | 15 | 0.100.10 | 0.300.15 | 0.300.15 | 0.300.15 | |
| monocyte | 71 | 0.200.13 | 0.600.16 | 0.600.16 | 0.600.16 | |
| autism spectrum disorder (asd) | t cell | 12 | 0.400.16 | 0.400.16 | 0.100.10 | 0.100.10 |
| astrocyte | 206 | 1.000.01 | 1.000.01 | 1.000.01 | 0.900.10 | |
| pancreatic ductal adenocarcinoma | t cell | 30 | 0.300.15 | 0.800.13 | 0.700.15 | 0.600.16 |
| multiple sclerosis (ms) | t cell | 90 | 0.600.16 | 0.700.15 | 0.500.17 | 0.700.15 |
| astrocyte | 239 | 1.000.01 | 1.000.01 | 1.000.01 | 1.000.01 | |
| monocyte | 4 | 0.100.10 | 0.200.13 | 0.200.13 | 0.200.13 | |
| atherosclerosis (ath.) | t cell | 544 | 1.000.01 | 1.000.01 | 1.000.01 | 1.000.01 |
| astrocyte | 23 | 0.400.16 | 0.600.16 | 0.600.16 | 0.600.16 |
4 Discussion and conclusion
To inject cellular and tissue context into biological network embeddings, we have developed aware, a methodology to generate rich embeddings of proteins, cell types, and tissues that adhere to cell type and tissue hierarchies. We show aware’s utility on the novel task of predicting cell type specific disease-gene associations, demonstrating the importance of cellular and tissue context in protein networks. We envision aware to open up new possibilities for contextually adaptive embeddings in biomedicine.
Acknowledgements
We thank our reviewers for their time and insights. M.M.L. is supported by T32HG002295 from the National Human Genome Research Institute and a National Science Foundation Graduate Research Fellowship. We also gratefully acknowledge the support of NSF under nos. IIS-2030459 and IIS-2033384, the Harvard Data Science Initiative, the Amazon Research Award, and the Bayer Early Excellence in Science Award.
References
- Basha et al. (2020) Basha, O., Argov, C. M., Artzy, R., et al. Differential network analysis of multiple human tissue interactomes highlights tissue-selective processes and genetic disorder genes. Bioinformatics, 2020.
- Bassett & Sporns (2017) Bassett, D. S. and Sporns, O. Network neuroscience. Nature Neuroscience, 2017.
- Cao et al. (2020) Cao, Y., Wang, X., and Peng, G. SCSA: a cell type annotation tool for single-cell rna-seq data. Frontiers in Genetics, 2020.
- Cha & Lee (2020) Cha, J. and Lee, I. Single-cell network biology for resolving cellular heterogeneity in human diseases. Experimental & Molecular Medicine, 2020.
- Cheng et al. (2018) Cheng, F., Desai, R. J., Handy, D. E., et al. Network-based approach to prediction and population-based validation of in silico drug repurposing. Nature Communications, 2018.
- Efremova et al. (2020) Efremova, M., Vento-Tormo, M., Teichmann, S. A., and Vento-Tormo, R. CellPhoneDB: inferring cell–cell communication from combined expression of multi-subunit ligand–receptor complexes. Nature Protocols, 2020.
- Greene et al. (2015) Greene, C. S., Krishnan, A., Wong, A. K., et al. Understanding multicellular function and disease with human tissue-specific networks. Nature Genetics, 2015.
- Gremse et al. (2010) Gremse, M., Chang, A., Schomburg, I., et al. The BRENDA Tissue Ontology (BTO): the first all-integrating ontology of all organisms for enzyme sources. Nucleic Acids Research, 2010.
- Ideker & Krogan (2012) Ideker, T. and Krogan, N. J. Differential network biology. Molecular Systems Biology, 2012.
- Kamies & Martinez-Jimenez (2020) Kamies, R. and Martinez-Jimenez, C. P. Advances of single-cell genomics and epigenomics in human disease: where are we now? Mammalian Genome, 2020.
- Klimm et al. (2020) Klimm, F., Toledo, E. M., Monfeuga, T., et al. Functional module detection through integration of single-cell rna sequencing data with protein–protein interaction networks. BMC Genomics, 2020.
- Li et al. (2021) Li, M. M., Huang, K., and Zitnik, M. Representation learning for networks in biology and medicine: Advancements, challenges, and opportunities. arXiv:2104.04883, 2021.
- Luck et al. (2020) Luck, K., Kim, D.-K., Lambourne, L., et al. A reference map of the human binary protein interactome. Nature, 2020.
- Markmiller et al. (2018) Markmiller, S., Soltanieh, S., Server, K. L., et al. Context-dependent and disease-specific diversity in protein interactions within stress granules. Cell, 2018.
- Menche et al. (2015) Menche, J., Sharma, A., Kitsak, M., et al. Uncovering disease-disease relationships through the incomplete interactome. Science, 2015.
- Mohammadi et al. (2019) Mohammadi, S., Davila-Velderrain, J., and Kellis, M. Reconstruction of cell-type-specific interactomes at single-cell resolution. Cell Systems, 2019.
- Oughtred et al. (2019) Oughtred, R., Stark, C., Breitkreutz, B.-J., et al. The biogrid interaction database: 2019 update. Nucleic Acids Research, 2019.
- Przytycka et al. (2010) Przytycka, T. M., Singh, M., and Slonim, D. K. Toward the dynamic interactome: it’s about time. Briefings in Bioinformatics, 2010.
- Regev et al. (2017) Regev, A., Teichmann, S. A., Lander, E. S., et al. Science forum: the human cell atlas. Elife, 2017.
- Saviano et al. (2020) Saviano, A., Henderson, N. C., and Baumert, T. F. Single-cell genomics and spatial transcriptomics: discovery of novel cell states and cellular interactions in liver physiology and disease biology. Journal of Hepatology, 2020.
- Sonawane et al. (2019) Sonawane, A. R., Weiss, S. T., Glass, K., and Sharma, A. Network medicine in the age of biomedical big data. Frontiers in Genetics, 2019.
- Stark et al. (2006) Stark, C., Breitkreutz, B.-J., Reguly, T., et al. Biogrid: a general repository for interaction datasets. Nucleic Acids Research, 2006.
- Sun et al. (2011) Sun, Y., Han, J., Yan, X., Yu, P. S., and Wu, T. PathSim: meta path-based top-k similarity search in heterogeneous information networks. PVLDB, 2011.
- Wang et al. (2019) Wang, X., Ji, H., Shi, C., et al. Heterogeneous graph attention network. In WWW, 2019.
- Wen et al. (2016) Wen, Y., Zhang, K., Li, Z., and Qiao, Y. A discriminative feature learning approach for deep face recognition. In ECCV, 2016.
- Willsey et al. (2018) Willsey, A. J., Morris, M. T., Wang, S., et al. The psychiatric cell map initiative: a convergent systems biological approach to illuminating key molecular pathways in neuropsychiatric disorders. Cell, 2018.
- Wolf et al. (2018) Wolf, F. A., Angerer, P., and Theis, F. J. Scanpy: large-scale single-cell gene expression data analysis. Genome Biology, 2018.
- Zhang et al. (2016) Zhang, Y., Lin, H., Yang, Z., and Wang, J. Construction of dynamic probabilistic protein interaction networks for protein complex identification. BMC Bioinformatics, 2016.
- Zhao et al. (2021) Zhao, T., Lyu, S., Lu, G., Juan, L., et al. SC2disease: a manually curated database of single-cell transcriptome for human diseases. Nucleic Acids Research, 2021.
- Zitnik & Leskovec (2017) Zitnik, M. and Leskovec, J. Predicting multicellular function through multi-layer tissue networks. Bioinformatics, 2017.