A Possible Gamma-Ray Enhancement Event in Tycho’s Supernova Remnant
Abstract
We report a possible -ray enhancement event detected from Tycho’s supernova remnant (SNR), the outcome of a type Ia supernova explosion that occurred in year 1572. The event lasted for 1.5 years and showed a factor of 3.6 flux increase mainly in the energy range of 4–100 GeV, while notably accompanied with two 478 GeV photons. Several young SNRs (including Tycho’s SNR) were previously found to show peculiar X-ray structures with flux variations in one- or several-year timescales, such an event at -ray energies is for the first time seen. The year-long timescale of the event suggests a synchrotron radiation process, but the hard -ray emission requires extreme conditions of either ultra-high energies for the electrons upto 10 PeV (well above the cosmic-ray “knee” energy) or high inhomogeneity of the magnetic field in the SNR. This event in Tycho’s SNR is likely analogous to the -ray flares observed in the Crab nebula, the comparably short timescales of them both requiring a synchrotron process, and similar magnetohydrodynamic processes such as magnetic reconnection would be at work as well in the SNR to accelerate particles to ultra-relativistic energies. The event, if confirmed, helps reveal the more complicated side of the physical processes that can occur in young SNRs.
1 Introduction
In 1572, a supernova explosion was recorded by Tycho Brahe, of which the remnant is referred to as Tycho’s supernova remnant (SNR; hereafter Tycho). This supernova is believed to have a type Ia origin (Baade, 1945; Ruiz-Lapuente et al., 2004; Krause et al., 2008), i.e., the thermonuclear explosion of a CO white dwarf whose mass has reached close to the Chandrasekhar limit (1.4) through mass accretion (Livio & Mazzali, 2018). Being young and one of a few known type Ia SNRs in our Galaxy, Tycho has been well studied. While the distance is uncertain, estimated to be in a range of 2–5 kpc (Hayato et al. 2010; Tian & Leahy 2011; we adopt 2.5 kpc in this work), the SNR has a shell-like shape with a size of 8 arcmin in diameter in high-resolution images of multiple wavelengths (Reynoso et al., 1997; Kothes et al., 2006; Hwang et al., 2002; Williams et al., 2013; Lopez et al., 2015). The shell is expanding, of which the ejecta was found to have an expansion velocity of 4700 km s-1 (Hayato et al., 2010), carrying much of the energy released in the supernova explosion. At the shell front, acceleration of high-energy electrons is suggested to be seen (Bamba et al., 2005), which is considered as evidence for cosmic ray production.
Through the diffusive shock acceleration process (Bell, 1978; Blandford & Ostriker, 1978; Drury, 1983), cosmic rays below the so-called “knee” (3 PeV) are widely believed to arise primarily from SNRs in our Galaxy. High-energy -ray studies of SNRs can thus help find possible evidence on the origin of cosmic rays (Drury et al., 1994). Specifically for Tycho, its high-energy and very-high-energy (VHE) -ray emission has been detected (Acciari et al., 2011; Giordano et al., 2012; Archambault et al., 2017). With the focus on the -ray detection, models to explain the observed emission from Tycho have been proposed (Atoyan & Dermer, 2012; Morlino & Caprioli, 2012; Berezhko et al., 2013; Zhang et al., 2013; Slane et al., 2014). Most of them indicate that the hadronic process, the collisions of high-energy hadrons (protons and ions), is responsible for the -ray production. X-ray studies of Tycho have also revealed intriguing features, in particular the stripe-like structures that are suggested as evidence of particles accelerated to PeV energies (Eriksen et al., 2011). Very recent results from analysis of the long-term data show that these X-ray stripes in the southwestern region of the SNR were variable, and are interpreted as the indication of the magnetic field amplification and/or significant magnetic turbulence changes (Okuno et al., 2020; Matsuda et al., 2020). In addition, rapid deceleration of the expanding shell was found in year 2009–2015 in particular (Tanaka et al., 2020).
Likely related to these features and their implications, here we report a possible -ray enhancement phenomenon seen in this SNR. In section 2, detailed analysis of the data obtained with the Large Area Telescope (LAT) onboard Fermi Gamma-ray Space Telescope (Fermi) is presented. In section 3, the results from the analysis are summarized and the implications of the results are discussed.
2 LAT Data Analysis
2.1 Analysis of the 11.6-yr Fermi LAT data
We selected LAT events from the latest Pass 8 database in an energy range of 60 MeV to 500 GeV during the time period from 2008-08-04 15:43:36 (UTC) to 2020-03-05 01:16:35 (UTC). The region of interest (RoI) is , centered at the position of Tycho. Only the events with quality flags of ‘good’ and zenith angles smaller than 90 degrees were used; the latter is to prevent the Earth’s limb contamination. Both of these are recommended by the LAT team111http://fermi.gsfc.nasa.gov/ssc/data/analysis/scitools/.
We constructed a source model based on the Fermi LAT 10-year source catalog (Ballet et al., 2020), by including all the sources within 20 degrees away from Tycho. The spectral forms and parameters of these sources are provided in the catalog. In our analysis, we fixed the spectral parameters of the sources 5 degrees away from the target at the values given in the catalog, and set those of the sources within 5 degrees as free parameters. We included the background Galactic and extragalactic diffuse spectral models (gll_iem_v07.fits and iso_P8R3_SOURCE_V2_v1.txt respectively) in the source model, and their normalizations were set as free parameters. The emission from Tycho was described with a simple power law , where is the photon energy and is the photon spectral index.

We performed the binned likelihood analysis to the LAT data in the energy range of 0.3–500 GeV during the whole selected time period. In the energy range 0.3 GeV, the instrument response function of LAT has relatively large uncertainties and the background emission along the Galactic plane is strong (Abdollahi et al., 2020). A photon index of 0.07 and a 0.3–500 GeV flux of photons s-1 cm-2 were obtained (Table 1), which are consistent with those given in the Fermi LAT 10-year source catalog. The Test Statistic (TS) value obtained is 245.
2.2 Variability and spectral analysis
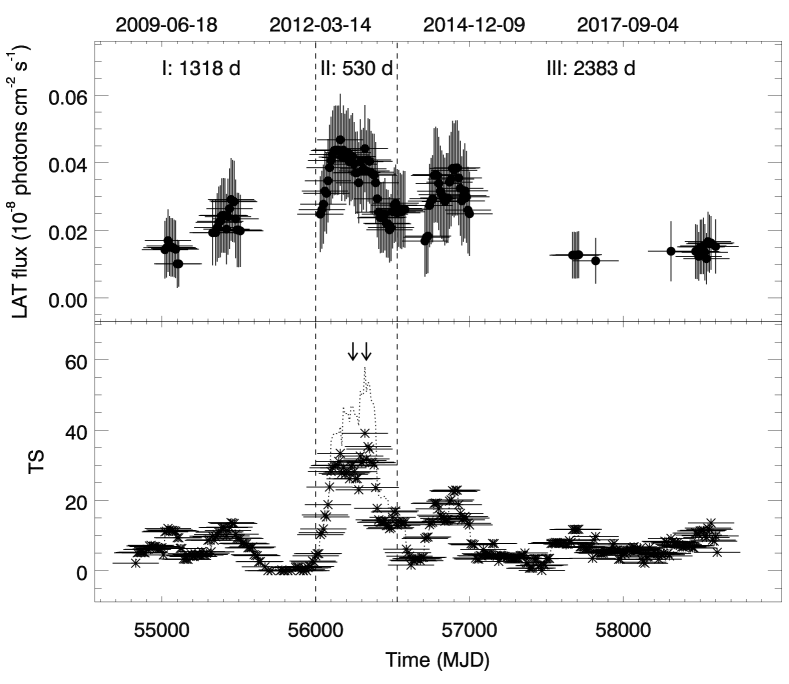
To check the long-term emission properties of Tycho, we first extracted the -ray light curves of the source. Because Tycho is faint, we initially constructed 0.3–500 GeV light curves of 100, 200, 300, 400, and 500-day bins. The 200- and 300-day binned light curves relatively well show possible variations, as the time bins can avoid to either have many flux upper limits (when too small) or smear out possible changes (when too large). For example, there are only three data points in the 300-day binned light curve (Figure 1) with TS9 (resulting in flux upper limits in this case), and most of them are in the range of 10TS30. Also notably the data point at MJD 56330 has TS and a hard spectral index, suggesting possible emission changes.

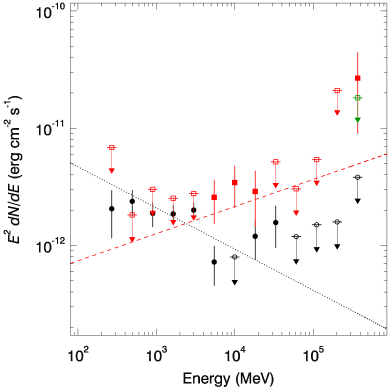
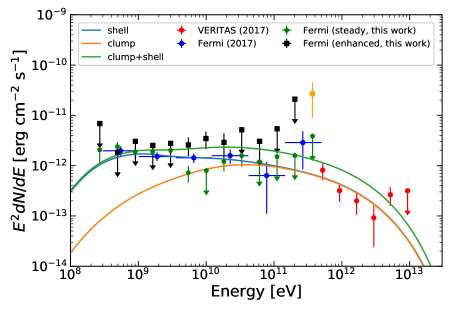
We thus extracted a spectrum from the 300-day data centered at MJD 56330 by performing likelihood analysis in 13 evenly divided energy bands in logarithm in 0.2–500 GeV energy range. The spectrum of the same energy bands from the whole data was also extracted. The spectral normalizations of the sources within 5 degrees from the target were set as free parameters, while all the other parameters of the sources in the source model were fixed at the values obtained from the above binned likelihood analysis. For the obtained spectral data points, we kept those with TS greater than 9, and derived 95% flux upper limits otherwise. The spectra are shown in the left panel of Figure 2. The spectral points of the whole data set are given in Table 2.
Comparing the two spectra in Figure 2, possible differences are seen in the energy range of 4.1–25 GeV. The three spectral data points covering the energy range appear higher in the 300-day spectrum than those in the whole-data spectrum, although their uncertainties are large. It can be noted that the last data point (at 370 GeV) in the two spectra is not an upper limit. This flux data point is actually due to the two 478 GeV photons (see section 2.3).
The energy range of 4.1 GeV was thus chosen for determining the time range containing possible flux variations of Tycho. A 300-day binned smooth light curve was constructed, for which each data point was shifted by 10 days forward (instead of 300 days). This type of smooth light curves helps reveal possible fine structures of variations. From the smooth light curve, we determined the time range of MJD 56000–56530 (defined as time period II) in which Tycho showed an emission enhancement. This time period was set by requiring the TS values in time bins greater than 30 (Figure 3). The time periods before and after it (1318 and 2383 days respectively) were defined as time period I and III respectively.
We then extracted the -ray spectra of Tycho in the energy range of 0.2–500 GeV during the time period II and the remaining time periods. The spectra are shown in the right panel of Figure 2, and the data points are provided in Table 2. We note that during time period II, the last spectral data point, a flux measurement, is in 273.9–500 GeV band, which includes the two 478 GeV events (see section 2.3). If we exclude the two events, the data point turns to be a flux upper limit instead.
2.3 Energy distribution of photon events
During the time period II, there are two events with energies of 478.5 and 478.3 GeV at MJD 56242 and 56329 respectively. The event class Source, recommended for most analyses with good sensitivity for point sources, was used in our analysis. At 500 GeV, the 68% containment angle for the event class is about 0.1 degree. We ran gtfindsrc to determine the position of the -ray emission in the energy range of GeV during the time period II. The position has R.A. = 622 and Decl. = 6413, with an 1 uncertainty of 004. Tycho is 005 away from the position, within the 2 error circle (consistent with the containment angle). The two 478 GeV events are the only high-probability ones in association with Tycho among detected photons in the high energy band. We note that the energy resolution at 500 GeV is less than 10%, set as the 68% containment half width of the reconstructed incoming photon energy.
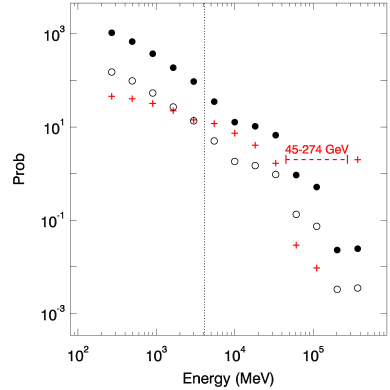
In order to understand the association of the two 478 GeV events with Tycho and also check if there are other related events with slightly lower energies, we calculated the association probabilities of the photon events for Tycho. We chose a circular region centered at Tycho with 3-degree radius, which approximately corresponds to the 68% containment angle of the Point Spread Function (PSF) of the LAT at 200 MeV222https://www.slac.stanford.edu/exp/glast/groups/canda/lat_Performance.htm. The association probabilities of the events in this region for all the sources in our source model (i.e., the 20-degree radius RoI centered at Tycho) were calculated, using the LAT data analysis tool gtsrcprob. The two 478.5 and 478.3 GeV events are highly associated with Tycho, having the probabilities of 94% and 98% coming from Tycho, respectively.
We set the energy bins the same as those for the above spectrum extraction. In each energy bin, the probabilities of the events for Tycho were added (i.e., the weighted counts from Tycho). In the left panel of Figure 4, we show the probability results for time periods I+III and II: the values in the former are generally higher than those in the latter, but when the lengths of the time periods are considered, the values in 4.1–45 GeV are higher in the latter than in the former (very similar to the spectrum results shown above). In addition, the two 478 GeV events constitutes the last data point with the added probability close to 2. It can be noted that between 45–274 GeV, there is an obvious gap with very low probability values.
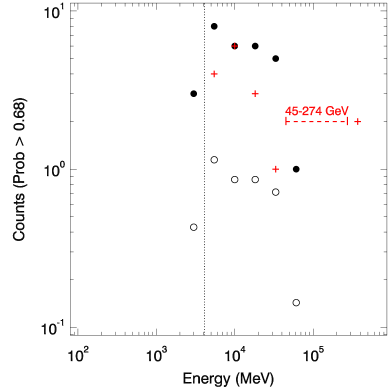
Another figure can be plotted is photon events with high association probabilities. We counted the numbers of events in the 3-degree radius region with 68% association probabilities for Tycho. The same energy bins were used. The counts results are shown in the right panel of Figure 4. In time period I+III, when we scale its counts with the length ratio between time period I+III and time period II, the counts are mostly 1 in the energy bins between 2.2–82 GeV. On the other hand in time period II, the counts are mostly 1 in the energy bins between 4.1–45 GeV and the highest is 6 at 10 GeV. Also similarly to the above probability plot, the last data point is close to 2 due to the two 478 GeV photons and the gap between 45–274 GeV is visible. Thus the two photons were isolated events, not coming together with a beam of similarly high energy events from Tycho.
2.4 Analysis of the 4.1–100 GeV LAT data
As the two 478 GeV events can significantly affect the results such as by increasing the TS value or changing the spectrum, we used the energy range of 4.1–100 GeV in our binned likelihood analysis to avoid inclusion of the two 478 GeV events. The obtained 4.1–100 GeV fluxes are photons s-1 cm-2 and photons s-1 cm-2 during time period II and time period I plus III, respectively (Table 1). The integrated flux in the former is thus higher than that in the latter at a 3 confidence level. We checked the normalization factors of the Galactic background, the dominant background for Galactic sources (the Galactic latitude of Tycho is 1.4 degrees), and they were 1.030.02 and 1.0010.008 in the two time periods, consistent with each other. For completeness of the results, we also obtained the fluxes in the energy range of 0.3–500 GeV in time period I, II, and III, and the values are also given in Table 1.
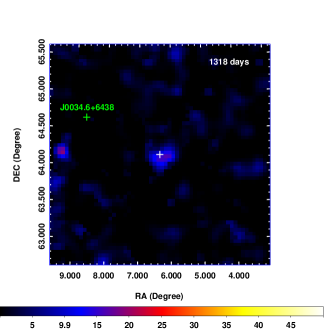
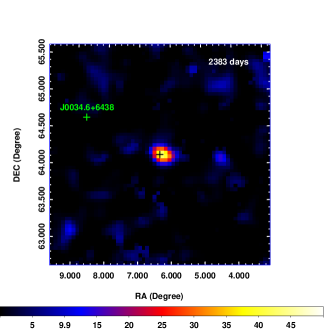
A TS map helps show if a significant detection (with a high TS value at a source’s position) is due to the presence of the source at the position or not. To carefully examine the detection of the enhanced emission, we calculated the 4.1–100 GeV TS maps centered at Tycho in the three time periods. The three TS maps are shown in Figure 5. At the position of Tycho, there is always the point-source emission present without any additional emission sources. The highest TS value of 50 was found in time period II, comparing to 15 and 41 in time period I and III respectively (note that the latter two have time durations 2.5 and 4.5 times longer than that of the former). The results clearly indicate that there was enhanced emission in time period II.
Also noted is that the -ray field around Tycho is rather clean. There is only one faint unidentified source (J0034.6+6438; see Figure 5) 1.1 degrees away from Tycho. Its emission is described with a power law with 2.43. It is not variable with a TS value of 80 in the LAT source catalog. Considering that the 95% containment angle of the LAT PSF is 1 degree at 4 GeV333https://www.slac.stanford.edu/exp/glast/groups/canda/lat_Performance.htm, this source did not likely contaminate the enhancement detection. The 2 positional uncertainty for the -ray emission of Tycho is 0.05 degrees. Within the error region, no blazars (the dominant -ray sources in the sky) are known to be located. Thus no evidence shows that the enhancement would be caused by a background source.

3 Results and Discussion
Using the Fermi LAT data, we have conducted detailed analysis for studying the -ray emission of Tycho. We found that the long-term flux and TS values in the energy range of 4.1–100 GeV, obtained from 300-day time bin LAT data, effectively demonstrate the enhancement in emission from Tycho (Figure 3). During a time period of 530 days (1.5 yr between MJD 56000–56530), the TS values are greater than 30, higher than every of those in the remaining time periods (time periods I and III with lengths of 1318 and 2383 days respectively). Interestingly, there are two 478 GeV photon events received from the direction of Tycho during time period II, and the association probabilities, respectively 94% and 98%, with Tycho are very high. Because of the rareness of such high-energy photons (Ackermann et al., 2016), the two events can significantly affect the results. For example, if we extend the energy range to 500 GeV, the TS values in time period II are further increased due to the two events (Figure 3).
The main discernable difference in emission of Tycho during time period II, from that in the remaining time periods (i.e., time period I plus III), can be seen to occur in the energy range of 4–25 GeV (Figure 2). The results from the binned likelihood analysis (Table 1) indicate that the emission appears marginally softer (larger value). The flux in this time period is photons cm-2 s-1 (in the energy range of 4.1–100 GeV), higher by a factor of 3.6 than that in the remaining time periods, which is photons cm-2 s-1. Correspondingly, the TS value in time period II is 49, only slightly smaller than TS of 57 from the latter (data of totally 3701 days). From the spectral analysis, we note that the two 478 GeV photon events determine whether the highest energy data point (273.9–500 GeV) in the spectrum in time period II is a flux measurement or a flux upper limit (Figure 2; see also Table 2).
Given these, we conclude that there is approximately a 1.5-yr time period in which Tycho showed enhanced -ray emission in the energy range of 4–25 GeV. Based on the fluxes obtained from the binned likelihood analysis to the data in time period II and the remaining time periods, the enhancement has a significance of 3. However, our analyses involve the initial search (from 5 light curves of from 100-day to 500-day bins) for possible signals and determination of the optimal energy and time windows for the signal. Although it is hard to evaluate a trial factor, i.e., the number of independent tests (e.g., Choudalakis 2011), in the analyses, we may at least consider it to be much larger than 10, such as arising in the initial search and the search for the time range of the signal (cf., Figure 3). Thus the significance should be lowered to be less than 2. Nevertheless, we did find evidence from the spectral analysis and TS maps, plus the unusual two 478 GeV photons, indicating a possible enhancement event in Tycho. Such an event would be the first time seen in a young SNR, suggesting occurrences of complicated physical processes in young SNRs. Below we discuss the possible models that might explain the enhancement and their difficulties.
Tycho is young and there has been discussion in regard to young SNRs noting that they may show -ray flux variations due to the changeable ambient environments their shock front goes through (Berezhko et al., 2011, 2015; Yasuda & Lee, 2019). In particular, the number density of the target hadrons in the collision process could have significant changes in the space surrounding a young SNR. Previously on the observational side, X-ray hot spots or filaments in the young SNRs RX J1713.73946 and Cassiopeia A were found to show yearly intensity variations, which is interpreted as evidence for amplification of the magnetic field (to 1 mG) at the shocks Uchiyama et al. 2007; Uchiyama & Aharonian 2008; but also see Bykov et al. 2008). Also, the known youngest SNR G1.9+0.3 (100 yrs) in our Galaxy has been found to be brightening at radio frequencies (Murphy et al., 2008) and the remnant of supernova 1987A (occurred in year 1987 in the Large Magellanic Cloud) was brightening at both radio and X-ray frequencies (Zanardo et al., 2010; Helder et al., 2013; Frank et al., 2016). The phenomena either suggest magnetic field amplification or the increasing volume and number of cosmic rays (Brose et al., 2019) in the former, or reveal the interaction between the shock front and the preexisting equatorial ring (formed from the progenitor system of the supernova) in the latter. In this respect, our results add a different, previously unknown case to young SNRs by showing that a -ray emission enhancement in a time period of more than a year can occur, in addition to the baseline, long-term emission variations. While the latter are understood to reflect the physical processes SNRs go through (Reynolds, 2017), what this Tycho case reflects is intriguing.
3.1 Hadronic model
There must have been a temporary change of the high-energy emitting processes related to Tycho in the time period around 2012 March to 2013 August (MJD 56000–56530). The baseline (or steady) -ray emission of Tycho is considered to arise from the hadronic process (Morlino & Caprioli, 2012; Zhang et al., 2013; Slane et al., 2014). The relativistic protons from the shock front have a long lifetime yr, where is the number density of the target gas. Thus the -ray enhancement would have been only caused by the change of the target, for which a probable scenario was that the shock front swept up some dense clumps, and more protons were available as the target in the hadronic process. In such a case, a transition layer around the boundary of a shocked clump is formed, which is a highly turbulent region and will prevent low energy particles from diffusively penetrating into the clump due to the amplification of the magnetic field (Inoue et al., 2012; Gabici & Aharonian, 2014). Then a hard -ray spectrum (with a small spectral index) arises from the shocked clump. Applying this scenario, the increased -ray flux of Tycho in time period II could have been explained (Figure 6).
Here we assume that the energetic protons accelerated by the shock take away the explosion energy with a fraction of and are uniformly distributed in the SNR shell. The shell is between the forward shock (at radius ) and the contact discontinuity (at radius ), and has width , where and is adopted (Warren et al., 2005). We consider that a dense clump with radius and density was swept up by the SNR shock at the beginning of time period II. The -ray emission in this period is a sum of two components: one is the emission from the SNR shell (or the steady component), and the other is from the shocked clump.
The distribution in energy of the accelerated protons is assumed to have a power-law form with a high-energy cutoff
| (1) |
where , , and are the proton energy, the power-law index, and the cutoff energy, respectively. The normalization is determined by the total energy in protons . Modeling the steady component, the proton index , the ambient density , and the cutoff energy TeV can be obtained (blue line in Figure 6). Given that the main differences between the spectra of the steady and the enhanced emission are in the energy range of 4–20 GeV, we take 10 GeV as the reference energy value. To produce the enhanced component around 10 GeV, the protons with energies above 100 GeV need to diffusively penetrate the transition layer and reach the clump, which constrains the thickness of the transition layer pc and the magnetic field of it G. To fit the data, pc and are obtained (giving the orange line in Figure 6).
This scenario seems to be supported by the blast waves’ reaching the wall of a surrounding bubble (Zhou et al., 2016) and rapid deceleration of the SNR shell (Tanaka et al., 2020), both of which likely indicate the interaction of the blast waves with clumps of dense gas and the latter notably occurred in a time period covering the enhancement. However, the time duration of a flux enhancement in this scenario should be much longer than that of time period II, as the shocked clumps in downstream of the shock have a survival time described by the so-called cloud crushing timescale yr (; Klein et al. 1994). We note that a similar scenario, but with the cosmic-ray precursor interacting with the gas shell surrounding an SNR, has been proposed by Federici et al. (2015), and it predicts a flux increase at a few hundred GeV energies (which fits the enhancement event in Tycho). Still the same problem exists, as the time duration should be much longer.
3.2 Inverse Compton scattering process
The other often-considered -ray emission process is inverse Compton (IC) scattering, in which low-energy photons surrounding an SNR, consisting of the cosmic microwave background (CMB), infrared background (IB), and star light (SL), are boosted to the gamma-ray domain by the relativistic electrons. To produce photons of 10 GeV energies via the IC scattering process, the electron energy needs to be 1 TeV at least. Due to the long lifetime of the TeV electrons ( yrs), the IC scattering process has difficulties generating year-timescale variations, unless the magnetic field could reach the order of milli-Gauss. In such a strong magnetic field, the electrons will suffer severe synchrotron energy loss, resulting in a sufficiently short lifetime yr. Then extremely high synchrotron emission (for example, with 10–20 keV flux of ) will be produced at the same time, which are several orders of magnitude higher than the observed (; Tamagawa et al. 2009). To avoid this inconsistency, one may reduce the density of the relativistic electrons and increase that of the IB or SL photons. However in order to explain the enhancement around 10 GeV emission, the energy density of IB (SL) would need to be (, which is unphysically high in the interstellar environment of Tycho. Thus, the IC scattering process can be ruled out.
3.3 Synchrotron emission modeling
While high-energy electrons in the magnetic field can also produce soft -rays via the synchrotron process, photon energies are limited to be lower than the so-called synchrotron burnoff limit (160 MeV; Guilbert et al. 1983; de Jager et al. 1996). In order to exceed this limit, the particle acceleration and cooling need to be decoupled. A possible process that can provide additional relativistic electrons in young SNRs is the magnetic reconnection (MR; Matsumoto et al. 2015). When the SNR shock sweeps up some compact molecular clumps, the magnetic field around the interface between the shock and clumps can be amplified (Inoue et al., 2012). The MR process may be accompanied with the shock-clump interaction. We also note that an MR detonation scenario has been specifically proposed for Tycho (and the Crab nebula), which actually suggests a year-long timescale for the reconnection process (Zhang et al., 2018).
Alternatively, the 10 GeV emission could be ascribed to the synchrotron process in inhomogeneous magnetic fields. The evidence for the magnetic field amplification in SNRs, the variable X-ray structures (hot spots or filaments), implies that the magnetic field in an SNR should have significantly different strengths at different locations. Specifically in Tycho, the X-ray stripes and their year-scale time variability also indicate high inhomogeneity of the magnetic field (Okuno et al., 2020; Eriksen et al., 2011; Matsuda et al., 2020). In a recently discussed scenario for the presence of some discrete compact magnetic blobs, it has been shown that the maximum energy of synchrotron photons can be boosted to multi-GeV energies depending on the ratio of the magnetic field in the blobs to that in the background (Khangulyan et al., 2020). For example, a synchrotron spectrum can extend to energies beyond 10 GeV for the ratio of 100. If the -ray emitting magnetic blobs survive or decrease in the field strength at yearly timescale, the -ray enhancement might be explained.
However, in order to fit the enhanced part of the emission (cf., Figure 6) with the synchrotron radiation, the electron energies are required to be as high as PeV (assuming a magnetic strength of 1 mG). Such high energies are above the “knee” energy and would have extremely short lifetimes of day. It is hard to explain the year-long enhancement event with such a short-lifetime radiation process.
In any case, we note that this possible -ray enhancement event in Tycho shares similar features with the -ray flares in the Crab nebula (Tavani et al., 2011; Abdo et al., 2011). Both occurred at GeV energies and their timescales are too short to be explained by the processes other than the synchrotron. The complication in the Crab nebula lies at the young pulsar in the center, which keeps powering the nebula. For Tycho, it stands out among the young SNRs with the features of the variable X-ray strips, blast-waves–bubble-wall interaction, and rapid deceleration of the expansion. These features could be the reason that induces the enhancement event, while detailed studies are needed in order to fully understand the physical processes behind the event.
| 0.3–500 GeV | 4.1–100 GeV | ||||||
| Time | MJD | TS | TS | ||||
| period | (photons cm-2 s-1) | (photons cm-2 s-1) | |||||
| Total | 54682–58913 | 2.230.07 | 4.30.5 | 245 | – | – | – |
| I | 54682–56000 | 2.40.1 | 4.91.1 | 53 | – | – | – |
| II | 56000–56530 | 1.80.1 | 2.60.9 | 69 | 2.40.3 | 4.00.9 | 49 |
| III | 56530–58913 | 2.310.09 | 5.00.7 | 140 | – | – | – |
| IIII | – | 2.350.08 | 4.90.6 | 192 | 1.90.3 | 1.10.2 | 57 |
| Whole data | Period IIII | Period II | |||||
| Band | TS | TS | TS | ||||
| (GeV) | (GeV) | (erg cm-2 s-1) | (erg cm-2 s-1) | (erg cm-2 s-1) | |||
| 0.27 | 0.2–0.4 | 2.30.8 | 12.8 | 2.10.9 | 9.1 | 6.8 | 4.4 |
| 0.49 | 0.4–0.7 | 2.00.5 | 15.6 | 2.40.6 | 20.0 | 1.8 | 0.0 |
| 0.90 | 0.7–1.2 | 1.80.4 | 21.3 | 1.90.4 | 20.5 | 3.0 | 1.2 |
| 1.64 | 1.2–2.2 | 1.80.3 | 36.6 | 1.90.3 | 35.7 | 2.5 | 1.6 |
| 3.00 | 2.2–4.1 | 1.90.3 | 58.6 | 2.00.3 | 56.3 | 2.8 | 3.0 |
| 5.48 | 4.1–7.4 | 0.90.3 | 18.9 | 0.70.3 | 10.7 | 2.61.0 | 12.0 |
| 10.00 | 7.4–13.5 | 0.70.3 | 15.1 | 0.8 | 3.5 | 3.41.3 | 22.0 |
| 18.3 | 13.5–24.7 | 1.40.4 | 32.9 | 1.20.4 | 21.2 | 2.91.5 | 13.3 |
| 33.3 | 24.7–45.0 | 1.50.6 | 27.1 | 1.60.6 | 23.7 | 5.2 | 3.4 |
| 60.8 | 45.0–82.2 | 1.0 | 1.4 | 1.2 | 1.7 | 3.0 | 0.0 |
| 111.0 | 82.2–150.0 | 1.2 | 0.0 | 1.5 | 0.0 | 5.4 | 0.0 |
| 202.7 | 150.0–273.9 | 1.3 | 0.0 | 1.6 | 0.0 | 20.9 | 0.0 |
| 370.1 | 273.9–500.0 | 4.32.5 (3.3) | 16.7 (0.0) | 3.8 | 0.0 | 2718 (18) | 23.9 (0) |
Note: a) is the energy flux (), and fluxes without uncertainties are 95 upper limits. b) Values in parentheses were obtained without including the two 478 GeV photons.
References
- Abdo et al. (2010) Abdo, A. A., Ackermann, M., Ajello, M., et al. 2010, ApJS, 188, 405
- Abdo et al. (2011) —. 2011, Science, 331, 739
- Abdollahi et al. (2020) Abdollahi, S., Acero, F., Ackermann, M., et al. 2020, ApJS, 247, 33
- Acciari et al. (2011) Acciari, V. A., Aliu, E., Arlen, T., et al. 2011, ApJ, 730, L20
- Ackermann et al. (2016) Ackermann, M., Ajello, M., Atwood, W. B., et al. 2016, ApJS, 222, 5
- Archambault et al. (2017) Archambault, S., Archer, A., Benbow, W., et al. 2017, ApJ, 836, 23
- Atoyan & Dermer (2012) Atoyan, A., & Dermer, C. D. 2012, ApJ, 749, L26
- Baade (1945) Baade, W. 1945, ApJ, 102, 309
- Ballet (2006) Ballet, J. 2006, AdSpR, 37, 1902
- Ballet et al. (2020) Ballet, J., Burnett, T. H., Digel, S. W., & Lott, B. 2020, arXiv e-prints, arXiv:2005.11208
- Bamba et al. (2005) Bamba, A., Yamazaki, R., Yoshida, T., Terasawa, T., & Koyama, K. 2005, ApJ, 621, 793
- Bell (1978) Bell, A. R. 1978, MNRAS, 182, 443
- Berezhko et al. (2011) Berezhko, E. G., Ksenofontov, L. T., & Völk, H. J. 2011, ApJ, 732, 58
- Berezhko et al. (2013) —. 2013, ApJ, 763, 14
- Berezhko et al. (2015) —. 2015, ApJ, 810, 63
- Blandford & Ostriker (1978) Blandford, R. D., & Ostriker, J. P. 1978, ApJ, 221, L29
- Brose et al. (2019) Brose, R., Sushch, I., Pohl, M., Luken, K. J., Filipović, M. D., & Lin, R. 2019, A&A, 627, A166
- Bykov et al. (2008) Bykov, A. M., Uvarov, Y. A., & Ellison, D. C. 2008, ApJ, 689, L133
- Cerutti et al. (2013) Cerutti, B., Werner, G. R., Uzdensky, D. A., & Begelman, M. C. 2013, ApJ, 770, 147
- Choudalakis (2011) Choudalakis, G. 2011, arXiv:1101.0390
- de Jager et al. (1996) de Jager, O. C., Harding, A. K., Michelson, P. F., et al. 1996, ApJ, 457, 253
- Drury (1983) Drury, L. O. 1983, Reports on Progress in Physics, 46, 973
- Drury et al. (1994) Drury, L. O., Aharonian, F. A., & Voelk, H. J. 1994, A&A, 287, 959
- Eriksen et al. (2011) Eriksen, K. A., Hughes, J. P., Badenes, C., et al. 2011, ApJ, 728, L28
- Federici et al. (2015) Federici, S., Pohl, M., Telezhinsky, I., Wilhelm, A., & Dwarkadas, V. V. 2015, A&A, 577, A12
- Frank et al. (2016) Frank, K. A., Zhekov, S. A., Park, S., et al. 2016, ApJ, 829, 40
- Gabici & Aharonian (2014) Gabici, S., & Aharonian, F. A. 2014, MNRAS, 445, L70
- Giordano et al. (2012) Giordano, F., Naumann-Godo, M., Ballet, J., et al. 2012, ApJ, 744, L2
- Guilbert et al. (1983) Guilbert, P. W., Fabian, A. C., & Rees, M. J. 1983, MNRAS, 205, 593
- Hayato et al. (2010) Hayato, A., Yamaguchi, H., Tamagawa, T., et al. 2010, ApJ, 725, 894
- Helder et al. (2013) Helder, E. A., Broos, P. S., Dewey, D., et al. 2013, ApJ, 764, 11
- Hwang et al. (2002) Hwang, U., Decourchelle, A., Holt, S. S., & Petre, R. 2002, ApJ, 581, 1101
- Inoue et al. (2012) Inoue, T., Yamazaki, R., Inutsuka, S.-i., & Fukui, Y. 2012, ApJ, 744, 71
- Khangulyan et al. (2020) Khangulyan, D., Aharonian, F., Romoli, C., & Taylor, A. 2020, arXiv e-prints, arXiv:2003.00927
- Klein et al. (1994) Klein, R. I., McKee, C. F., & Colella, P. 1994, ApJ, 420, 213
- Kothes et al. (2006) Kothes, R., Fedotov, K., Foster, T. J., & Uyanıker, B. 2006, A&A, 457, 1081
- Krause et al. (2008) Krause, O., Tanaka, M., Usuda, T., et al. 2008, Nature, 456, 617
- Livio & Mazzali (2018) Livio, M., & Mazzali, P. 2018, Phys. Rep., 736, 1
- Lopez et al. (2015) Lopez, L. A., Grefenstette, B. W., Reynolds, S. P., et al. 2015, ApJ, 814, 132
- Matsuda et al. (2020) Matsuda, M., Tanaka, T., Uchida, H., Amano, Y., & Tsuru, T. G. 2020, PASJ, 72, 85
- Matsumoto et al. (2015) Matsumoto, Y., Amano, T., Kato, T. N., & Hoshino, M. 2015, Science, 347, 974
- Morlino & Caprioli (2012) Morlino, G., & Caprioli, D. 2012, A&A, 538, A81
- Murphy et al. (2008) Murphy, T., Gaensler, B. M., & Chatterjee, S. 2008, MNRAS, 389, L23
- Okuno et al. (2020) Okuno, T., Tanaka, T., Uchida, H., et al. 2020, ApJ, 894, 50
- Reynolds (2017) Reynolds, S. P. 2017, Dynamical Evolution and Radiative Processes of Supernova Remnants, ed. A. W. Alsabti & P. Murdin, 1981
- Reynoso et al. (1997) Reynoso, E. M., Moffett, D. A., Goss, W. M., et al. 1997, ApJ, 491, 816
- Ruiz-Lapuente et al. (2004) Ruiz-Lapuente, P., Comeron, F., Méndez, J., et al. 2004, Nature, 431, 1069
- Slane et al. (2014) Slane, P., Lee, S. H., Ellison, D. C., et al. 2014, ApJ, 783, 33
- Tamagawa et al. (2009) Tamagawa, T., Hayato, A., Nakamura, S., et al. 2009, PASJ, 61, S167
- Tanaka et al. (2020) Tanaka, T., Okuno, T., Uchida, H., et al. 2020, arXiv e-prints, arXiv:2012.13622
- Tavani et al. (2011) Tavani, M., Bulgarelli, A., Vittorini, V., et al. 2011, Science, 331, 736
- Tian & Leahy (2011) Tian, W. W., & Leahy, D. A. 2011, ApJ, 729, L15
- Uchiyama & Aharonian (2008) Uchiyama, Y., & Aharonian, F. A. 2008, ApJ, 677, L105
- Uchiyama et al. (2007) Uchiyama, Y., Aharonian, F. A., Tanaka, T., Takahashi, T., & Maeda, Y. 2007, Nature, 449, 576
- Warren et al. (2005) Warren, J. S., Hughes, J. P., Badenes, C., et al. 2005, ApJ, 634, 376
- Werner et al. (2016) Werner, G. R., Uzdensky, D. A., Cerutti, B., Nalewajko, K., & Begelman, M. C. 2016, ApJ, 816, L8
- Williams et al. (2013) Williams, B. J., Borkowski, K. J., Ghavamian, P., et al. 2013, ApJ, 770, 129
- Yasuda & Lee (2019) Yasuda, H., & Lee, S.-H. 2019, ApJ, 876, 27
- Zanardo et al. (2010) Zanardo, G., Staveley-Smith, L., Ball, L., et al. 2010, ApJ, 710, 1515
- Zhang et al. (2018) Zhang, H., Gao, Y., & Law, C. K. 2018, ApJ, 864, 167
- Zhang et al. (2020) Zhang, X., Chen, Y., Huang, J., & Chen, D. 2020, MNRAS, 497, 3477
- Zhang et al. (2013) Zhang, X., Chen, Y., Li, H., & Zhou, X. 2013, MNRAS, 429, L25
- Zhou et al. (2016) Zhou, P., Chen, Y., Zhang, Z.-Y., et al. 2016, ApJ, 826, 34