Projections of the Transient State-Dependency of Climate Feedbacks
Abstract
When the climate system is forced, e.g. by emission of greenhouse gases, it responds on multiple time scales. As temperatures rise, feedback processes might intensify or weaken. Current methods to analyze feedback strength, however, do not take such state dependency into account; they only consider changes in (global mean) temperature and assume all feedbacks are linearly related to that. This makes (transient) changes in feedback strengths almost intangible and generally leads to underestimation of future warming. Here, we present a multivariate (and spatially explicit) framework that facilitates dissection of climate feedbacks over time scales. Using this framework, information on the composition of projected (transient) future climates and feedback strengths can be obtained. Moreover, it can be used to make projections for many emission scenarios through linear response theory. The new framework is illustrated using the Community Earth System Model version 2 (CESM2).
1 Introduction
Were the climate system free of feedback processes, it would be easy to predict and control the future climate Arrhenius (\APACyear1896). Unfortunately, the climate system is peppered with feedback loops Heinze \BOthers. (\APACyear2019); Von der Heydt \BOthers. (\APACyear2020). Because of these, climate change can get suppressed or enhanced, making future projections hard Sherwood \BOthers. (\APACyear2020). Therefore, detailed knowledge of all relevant feedback processes is required to accurately assess potential future climates. However, knowledge of the current strengths of climate feedbacks is not enough. Over time, as the climate state changes, the strengths of climate feedbacks also change Gregory \BBA Andrews (\APACyear2016); Marvel \BOthers. (\APACyear2018); Armour \BOthers. (\APACyear2013); for instance, the albedo-increasing effect of ice is only relevant when there (still) is ice.
As the Earth warms, the strength of positive feedbacks increases Bony \BOthers. (\APACyear2006). Therefore, projections based only on current knowledge of climate feedbacks underestimate future climate change – especially the committed warming that is to come even if zero emission is achieved Marvel \BOthers. (\APACyear2018); Goodwin (\APACyear2018); Senior \BBA Mitchell (\APACyear2000). To properly assess different emission scenarios, it is crucial to identify all relevant feedback mechanisms and, additionally, to quantify how their strengths change over time.
For future temperature projections with global climate models, currently the focus lies with the following feedback processes Zelinka \BOthers. (\APACyear2020); Klocke \BOthers. (\APACyear2013); Cess (\APACyear1975). First, the Planck radiation feedback suppresses warming due to increased outgoing radiation. Second, the lapse rate feedback also suppresses warming due to an increase in long-wave radiation escaping to space Sinha (\APACyear1995). Third is the ice-albedo feedback that enhances warming through a less reflective Earth surface Curry \BOthers. (\APACyear1995). Fourth is the water vapour feedback which boosts warming because of increased atmospheric water vapour content Manabe \BBA Wetherald (\APACyear1967). Finally, there is the cloud feedback, describing changes in cloud type and distribution, which could enhance or suppress warming Cess \BBA Potter (\APACyear1987).
The effect of a feedback process is quantified by its contribution to the climate system’s radiative response to a certain experienced radiative forcing – in the current Anthropocene primarily caused by greenhouse gas emissions. Specifically, the top-of-atmosphere radiative imbalance (that equals zero when the climate system is in equilibrium) is given by the sum of the radiative forcing and the radiative response , i.e.
| (1) |
This response is the sum of the feedback contributions of all relevant feedbacks. So, writing for the feedback contribution of feedback ,
| (2) |
where the sum is over all feedback processes. Classically, the feedback strength (also called feedback parameter) is given by the feedback contribution per unit warming, i.e.
| (3) |
From this, the top-of-atmosphere radiative imbalance can be related to the warming as
| (4) |
which can be used for climate projections Gregory \BOthers. (\APACyear2004).
However, the climate system responds on many, vastly different time scales Von der Heydt \BOthers. (\APACyear2020). In particular, not all feedback processes react similarly on all of these time scales. Consequently, there is no linear relationship between all feedback contributions and the global warming Andrews \BOthers. (\APACyear2015); Armour (\APACyear2017); Knutti \BBA Rugenstein (\APACyear2015). Hence, computations of feedback strengths often find these to change over time Senior \BBA Mitchell (\APACyear2000); Boer \BOthers. (\APACyear2005); they are certainly not constant, as is often implicitly assumed Zelinka \BOthers. (\APACyear2020); Klocke \BOthers. (\APACyear2013); Meraner \BOthers. (\APACyear2013).
We propose here to extend the classical framework to include dynamics on multiple time scales. To this end, feedback strengths should not be computed for the total time series, as in equation (3), but they should be separated in (Koopman) modal contributions instead. This makes the time-dependency of the various feedback processes explicit and opens the possibility of projections – both transient and equilibrium – for individual feedback contributions under any forcing scenario.
The rest of this paper is structured as follows. In section 2, we describe the theoretical framework, define new feedback strength metrics, and explain the computations of the feedback contributions. In sections 3.1-3.2, the framework is applied in a study of climate feedbacks in a year long abrupt4xCO2 experiment in the ‘Community Earth System Model version 2’ (CESM2). In section 3.3, projections of feedback contributions are made for and compared against output of CESM2’s 1pctCO2 experiment. Finally, section 4 contains a summary and discussion.
2 Method and Model
2.1 Method: the new climate feedback framework
From linear response theory Proistosescu \BBA Huybers (\APACyear2017); Ruelle (\APACyear2009); Aengenheyster \BOthers. (\APACyear2018), the change (response) in an observable due to a certain forcing is given by
| (5) |
where is the Green function for observable . The Green functions in the climate system are well-approximated by a sum of decaying exponentials (the Koopman modes), with only the contribution of the different modes depending on the observable . That is,
| (6) |
where the sum is over all modes, is the -th mode’s time scale and is the contribution of mode to the observable’s Green function. Because of this, following e.g. \citeAproistosescu2017slow, the response of observable can also be written as
| (7) |
where contains all time-dependencies and all observable-dependencies. Since all feedback contributions and the global warming adhere to this formulation, it is possible to define the feedback strength of feedback per mode as
| (8) |
Additionally, the instantaneous feedback strength at time can be defined as the incremental change in feedback contribution per incremental change in temperature (i.e. the local slope of the graph at time ):
| (9) |
Using this framework, it is also possible to estimate properties of the eventual equilibrium state – if such state exists. For instance, if , , the equilibrium is given by
| (10) |
The equilibrium feedback strength for feedback is then defined as
| (11) |
A more elaborate treatment of the mathematics of this framework is given in SI-Text S1. Below, we use this framework on two idealised experiments in CESM2 to understand the temporal evolution of (the strength of) climate feedbacks in these scenarios.
2.2 Model: CESM2 abrupt4xCO2 and 1pctCO2 experiments
We focus on forcing experiments conducted with the model CESM2 Danabasoglu \BOthers. (\APACyear2020), specifically on the model’s abrupt4xCO2 ( long) and 1pctCO2 ( long) experiments in CMIP6 Eyring \BOthers. (\APACyear2016). The abrupt4xCO2 experiment is used for fitting of the parameters and computations of feedback strengths per mode; the 1pctCO2 experiment is used to test projections made within the presented framework.
As feedback contributions are not outputted directly by any climate model, these have been determined using additional methodology. For this, we have used the radiative kernel approach Soden \BOthers. (\APACyear2008); Shell \BOthers. (\APACyear2008), in which feedback contributions are computed (per grid point at location ) as
| (12) |
where is the relevant (derived) state variable for the -th feedback and is the pre-computed radiative kernel. We have used the publicly available CESM-CAM5 kernels from \citeApendergrass2018surface, CAM5kerneldata, CAM5kernelsoftware. There are others available, but differences between kernels are typically small. The procedure for the cloud feedback contribution is somewhat different because of its more nonlinear nature, but is nevertheless computed following common practice Soden \BOthers. (\APACyear2008); Shell \BOthers. (\APACyear2008); Klocke \BOthers. (\APACyear2013) – see SI-Text S4 for more details.
3 Results
3.1 Temporal evolution, abrupt4xCO2
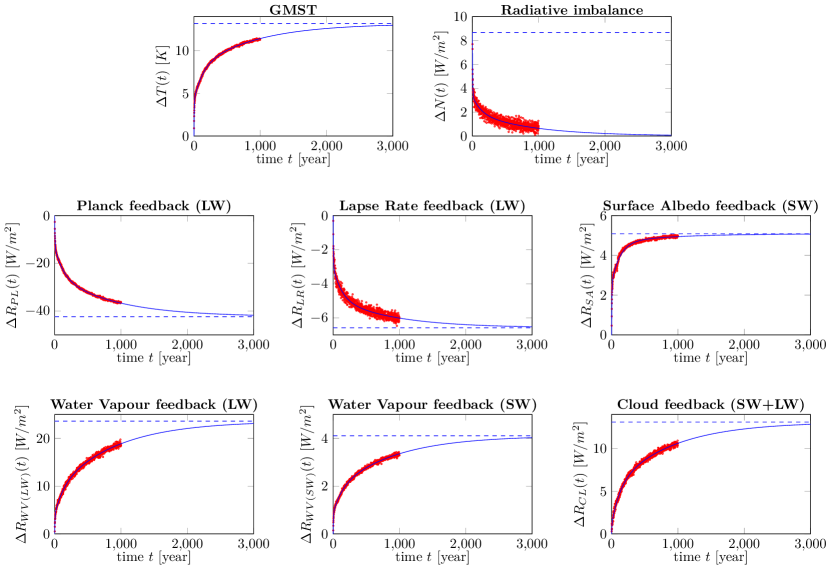
From CESM2 model output, feedback contributions , top-of-atmosphere radiative imbalance and near-surface temperature increase were computed; changes in observables are determined with respect to the temporal average of a control experiment with pre-industrial CO2 levels. From these, globally averaged datasets , and were derived. These global time series have been fitted to equation (7), with exception of that also includes the radiative forcing and is fitted to
| (13) |
where the subscript ‘abr’ indicates that the forcings are from the abrupt4xCO2 experiment. More details of the procedure can be found in SI-Text S2.
First, the amount of modes needs to be determined. Tests with various values for have indicated is the best choice here: does not capture all dynamics and has no significant benefits; see SI-Figure S1. This is also in agreement with other reports that typically find two or three relevant modes Caldeira \BBA Myhrvold (\APACyear2013); Tsutsui (\APACyear2017); Proistosescu \BBA Huybers (\APACyear2017); Bastiaansen \BOthers. (\APACyear2020). With fixed, the other parameters are fitted with nonlinear regression. The values for the fitted parameters are given in SI-Table S1. In Figure 1, the datasets are shown along with the fits and projections, showing a very good resemblance.
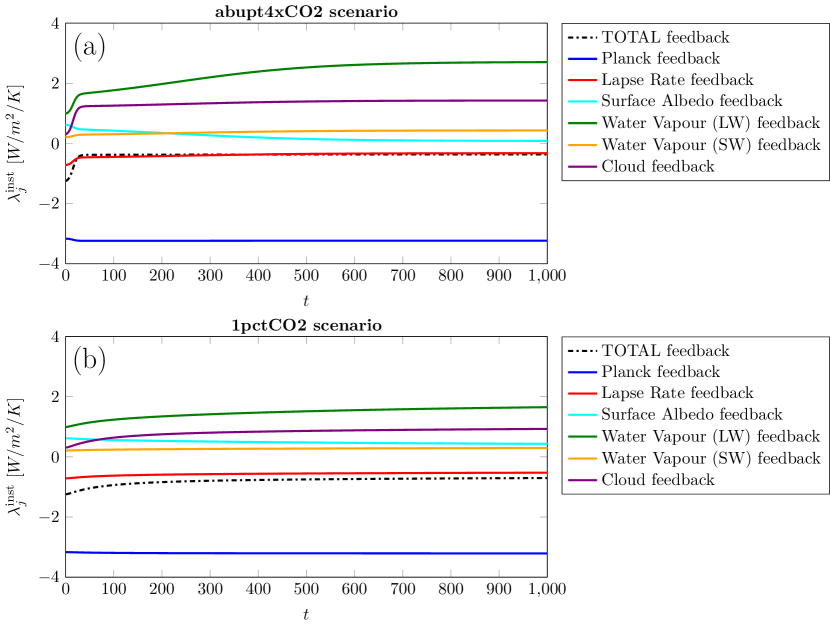
From the fitted parameters, the feedback strengths per mode are computed using equation (8). In Table 1, the results are shown per mode and for the equilibrium values. A plot of the change in (instantaneous) feedback strength over time is given in Figure 2A. This shows behaviour on three distinct time scales: (1) a short time scale , (2) an intermediate time scale and (3) a long time scale . The shorter time scale is in agreement with other studies Zelinka \BOthers. (\APACyear2020), and long-term behaviour seems very plausible. The Planck feedback does not change much over time. The lapse rate feedback becomes weaker over time since temperatures increase. The surface albedo feedback diminishes as sea-ice is melting. The water vapour feedback, however, strengthens as warmer air can contain more water, which – as demonstrated here – does lead to an almost tripling in this feedback’s strength over time. Finally, the cloud feedback becomes more dominant over time. The estimated equilibrium values are a bit higher generally compared to other studies (e.g. \citeAzelinka2020causes) since longer time scales are incorporated in the present study, which leads to higher temperature values and more positive total feedback strength Proistosescu \BBA Huybers (\APACyear2017); Rugenstein \BOthers. (\APACyear2020); Marvel \BOthers. (\APACyear2018); Goodwin (\APACyear2018).
Since the individual feedback contributions should sum to the total radiative response , feedback strengths should satisfy . However, because of ignored feedback interactions, imperfect radiative kernels and other limitations of the feedback contribution computations, a mismatch of up to is deemed inconsequential. Looking at the feedback parameters per mode in Table 1, we see a good balance for the intermediate time scale ( imbalance), but not for the short ( imbalance) or long time scales ( imbalance). Taking the large uncertainty into account for the shortest time scale, this imbalance might be insignificant still. However, for the long time scale, the imbalance is large and even the signs are not the same. This points to a missing negative feedback on this time scale (or inaccuracies in the computational methods for the feedback contributions ). Because the equilibrium values show a smaller imbalance (), the alleged missing feedback (or feedbacks) seem to be especially important during the transient state.
| Mode 1 | Mode 2 | Mode 3 | Equilibrium | |
| () | () | () | — | |
| () | () | () | () | |
| Planck (LW) | () | () | () | () |
| Lapse Rate (LW) | () | () | () | () |
| Surface Albedo (SW) | () | () | () | () |
| Water Vapour (LW) | () | () | () | () |
| Water Vapour (SW) | () | () | () | () |
| Clouds (SW + LW) | () | () | () | () |
| sum | () | () | () | () |
| residue | () | () | () | () |
3.2 Spatial distribution, abrupt4xCO2
With a slight modification of (8), the spatial structure of the (Koopman) modes can be included. Following a similar procedure in \citeAproistosescu2017slow, we take
| (14) |
and similar formulas for and . More details can be found in SI-Text S2.2.
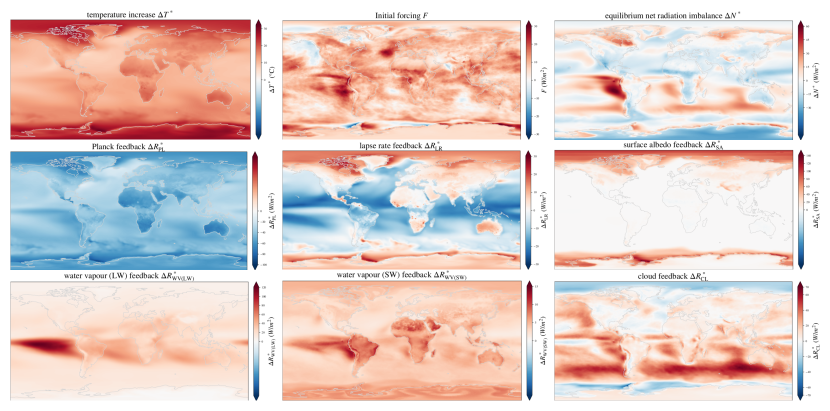
The space-dependent encompasses the spatial structure of the observable in the -th mode. Again, it is also possible to estimate equilibrium properties, leading to an estimation of the spatial distribution of feedback contributions and warming in equilibrium. Using the time scales from the fits of the global observables, the spatial coefficients can be computed efficiently using linear regression methods.
In SI-Figures S3–S10, the spatial modes of all feedback contributions, warming and radiative imbalance are given. The estimated equilibrium distributions are shown in Figure 3. The patterns of feedback contributions are in agreement with previous studies Proistosescu \BBA Huybers (\APACyear2017); Dong \BOthers. (\APACyear2020); Armour \BOthers. (\APACyear2013); Boeke \BOthers. (\APACyear2020); Andrews \BBA Webb (\APACyear2018); Dessler (\APACyear2013); Soden \BOthers. (\APACyear2008); Andrews \BOthers. (\APACyear2015), although they seem more pronounced here – probably due to a better incorporation of long-term behaviour. Near the poles, temperature increase gets close to (compared to near the equator) and large changes (up to ) in surface albedo are found related to sea-ice melting. Moreover, the lapse rate feedback contribution increases by about in these polar regions. Near the equator, the water vapour feedback gets much stronger (more than ) over the oceans – especially in the Pacific cold tongue where changes up to are found. Cloud feedback changes mostly over southern hemisphere oceans (up to ), and northern hemisphere changes are smaller (on average only ) compared to previous studies Andrews \BBA Webb (\APACyear2018); Dong \BOthers. (\APACyear2020); Armour \BOthers. (\APACyear2013).
3.3 Projections for 1pctCO2 experiment
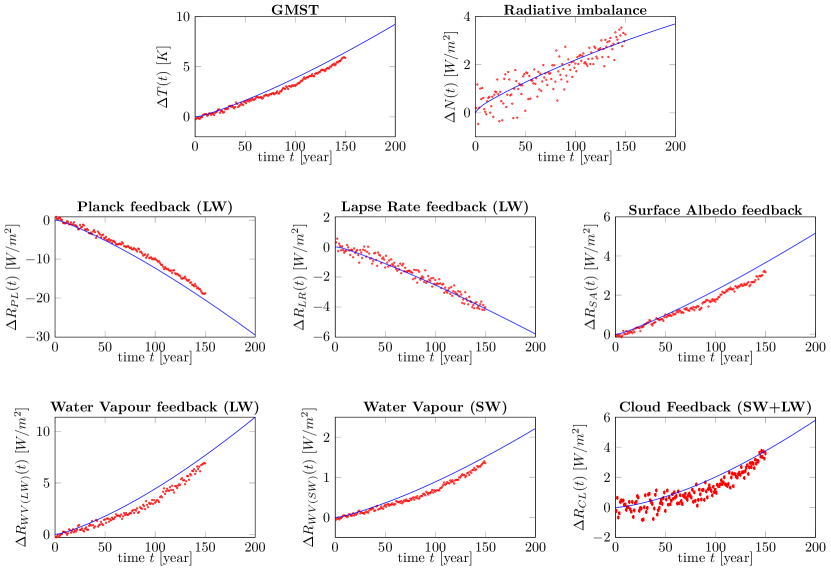
In the 1pctCO2 experiment, the forcing () is given by a yearly increase in atmospheric CO2. Replacing by in (8), while using the values for and as fitted with the abrupt4xCO2 experiment, gives a projection for feedback contributions and warming in the 1pctCO2 experiment. This procedure, following linear response theory Ruelle (\APACyear2009); Lucarini \BBA Sarno (\APACyear2011); Ragone \BOthers. (\APACyear2016), has been used for warming projections already in many models, including global climate models Lembo \BOthers. (\APACyear2020); Aengenheyster \BOthers. (\APACyear2018); Maier-Reimer \BBA Hasselmann (\APACyear1987); Hasselmann \BOthers. (\APACyear1993). Although typically used on an ensemble of model runs and for smaller forcings, we use it here nevertheless to illustrate its potency. More details can be found in SI-Text S3.
In Figure 4, projections for global feedback contributions are shown along with data coming directly from the CESM2 1pctCO2 experiment. Qualitatively, the projections are able to reproduce the actual trends in the globally averaged observables. The quantitative values overestimate feedback contributions by (less for the lapse rate feedback; more for cloud and long-wave water vapour feedbacks up to about ), which seems reasonable for this set-up. Projections for the temporal evolution of instantaneous feedback strengths in this scenario are given in Figure 2B. These show lasting changes over centuries – primarily in (long-wave) water vapour feedback, surface albedo feedback and cloud feedback – and a less negative total feedback parameter, indicating the climate system becomes more sensitive to radiative forcing over time.
Using the same approach, it is also possible to make projections for the evolution of the spatial distributions. In SI-Figures S11–S18 the projections for the feedback contributions , the radiative imbalance and the temperature increase at are shown. Videos showing these results for other times are also available (SI-videos). From all of these, it can be seen that the spatial projections reproduce the general larger spatial patterns and even some of the smaller features, although the internal variability is of course not present in the projections. The spatial patterns are similar to those found in the abrupt4xCO2 experiment (Figure 3) and show the same kind of response in polar and equatorial regions. In general, the projections seem to overestimate the spatial feedback contributions, similar to the overestimation of the global feedback contributions.
4 Summary and discussion
In this study, we have introduced a new multivariate feedback framework that enables analysis and projections of individual climate feedbacks, including their spatial distribution, over different time scales. This framework deviates from the common practice of linearly regressing feedback contributions to global warming Zelinka \BOthers. (\APACyear2020); Marvel \BOthers. (\APACyear2018); Klocke \BOthers. (\APACyear2013); Meraner \BOthers. (\APACyear2013) – which is not valid, especially when considering long-term effects Andrews \BOthers. (\APACyear2015); Armour (\APACyear2017); Knutti \BBA Rugenstein (\APACyear2015). Instead, these contributions are here taken into account directly, and temporal evolution is explicitly considered via a nonlinear regression to obtain (Koopman) modes for each feedback. These modes, indicating behaviour over different time scales, encapsulate the climate system’s dynamics and can thus be used both for analysis and projections of climate feedbacks – even for other forcing scenarios.
Using the presented framework, we have analyzed an abrupt4xCO2 experiment in CESM2. This clearly showed evolution of climate feedbacks over time, such as a diminishing of surface albedo feedback in the polar regions as sea-ice melts. Strikingly, the water vapour and cloud feedbacks showed a large increase over time: water vapour feedback, primarily over oceans around the equator, almost tripled in strength over a 1,000 year period and cloud feedback mainly changed over southern hemisphere oceans. Analysis also showed that the (commonly) considered feedback processes do not sum up to the total feedback for long time scales, pointing to a missing negative feedback on these time scales. Since estimated equilibrium feedback strengths do balance, the alleged missing feedback (or feedbacks) is expected to play a role primarily during the transient. As such, the ocean heat uptake is a good candidate to fill this gap. However, as of now, no radiative kernels exist for the ocean heat uptake’s effect on the top of atmosphere radiative balance, making it impossible to test this hypothesis. Nevertheless, tracking its effect over time seems necessary to accurately understand the long-term transient behaviour.
Another benefit of tracking the temporal evolution of climate feedbacks is that this makes it possible to project the climatic change for all sorts of emission scenarios without the need to have dedicated model experiments for them all. In this paper, we have shown the capabilities of such projections by comparing them to a (single) 1pctCO2 experiment with the same CESM2 model. The projections did capture the qualitative trends, but also showed an overestimation for almost all global and spatial climate feedback contributions. However, this possibly is due to internal variability associated with a single run. Hence, results are expected to be even better quantitatively when a (potentially small) ensemble of runs is used, as application of similar linear response techniques on e.g. temperature response have shown previously Lembo \BOthers. (\APACyear2020); Aengenheyster \BOthers. (\APACyear2018).
As climate models become more and more detailed, these models also become more computationally expensive. Therefore, it is practically impossible to compute climate responses for many forcing scenarios and/or on very long time scales. As climate feedbacks become more positive with rising temperatures, it is necessary to track these changes to prevent underestimation of climate change and adequately account for committed (long-term) warming. Hence, both extrapolation techniques and response theory can play a significant role to alleviate the gaps. The multivariate feedback framework in this study can contribute to this, allowing for long-term estimation and climate projections for different forcing scenarios. Moreover, as these projections are multivariate, they can inform us on more than global mean warming alone, and also indicate how a potential future climate state may behave differently compared to our current one.
Data statement
Radiative kernels from \citeApendergrass2018surface, CAM5kerneldata, CAM5kernelsoftware have been used; the kernels were downloaded from https://doi.org/10.5065/D6F47MT6 and accompanying software from https://doi.org/10.5281/zenodo.997899.
CESM2 data has been downloaded on the fly from Google’s cloud storage mirror of CMIP6 data using the ‘intake-esm’ utility package in Python (https://doi.org/10.5281/zenodo.4243421).
Acknowledgements
All MATLAB and Python codes are made available on https://github.com/Bastiaansen/Climate_Feedback_Projections. This project is TiPES contribution #114: this project has received funding from the European Union’s Horizon 2020 research and innovation programme under grant agreement 820970.
References
- Aengenheyster \BOthers. (\APACyear2018) \APACinsertmetastaraengenheyster2018point{APACrefauthors}Aengenheyster, M., Feng, Q\BPBIY., Van Der Ploeg, F.\BCBL \BBA Dijkstra, H\BPBIA. \APACrefYearMonthDay2018. \BBOQ\APACrefatitleThe point of no return for climate action: effects of climate uncertainty and risk tolerance The point of no return for climate action: effects of climate uncertainty and risk tolerance.\BBCQ \APACjournalVolNumPagesEarth System Dynamics931085–1095. {APACrefDOI} \doi10.5194/esd-9-1085-2018 \PrintBackRefs\CurrentBib
- Andrews \BOthers. (\APACyear2015) \APACinsertmetastarAndrews2015{APACrefauthors}Andrews, T., Gregory, J\BPBIM.\BCBL \BBA Webb, M\BPBIJ. \APACrefYearMonthDay2015. \BBOQ\APACrefatitleThe Dependence of Radiative Forcing and Feedback on Evolving Patterns of Surface Temperature Change in Climate Models The dependence of radiative forcing and feedback on evolving patterns of surface temperature change in climate models.\BBCQ \APACjournalVolNumPagesJournal of Climate2841630-1648. {APACrefDOI} \doi10.1175/JCLI-D-14-00545.1 \PrintBackRefs\CurrentBib
- Andrews \BBA Webb (\APACyear2018) \APACinsertmetastarandrews2018dependence{APACrefauthors}Andrews, T.\BCBT \BBA Webb, M\BPBIJ. \APACrefYearMonthDay2018. \BBOQ\APACrefatitleThe dependence of global cloud and lapse rate feedbacks on the spatial structure of tropical Pacific warming The dependence of global cloud and lapse rate feedbacks on the spatial structure of tropical pacific warming.\BBCQ \APACjournalVolNumPagesJournal of Climate312641–654. {APACrefDOI} \doi10.1175/JCLI-D-17-0087.1 \PrintBackRefs\CurrentBib
- Armour (\APACyear2017) \APACinsertmetastararmour2017energy{APACrefauthors}Armour, K\BPBIC. \APACrefYearMonthDay2017. \BBOQ\APACrefatitleEnergy budget constraints on climate sensitivity in light of inconstant climate feedbacks Energy budget constraints on climate sensitivity in light of inconstant climate feedbacks.\BBCQ \APACjournalVolNumPagesNature Climate Change75331–335. {APACrefDOI} \doi10.1038/nclimate3278 \PrintBackRefs\CurrentBib
- Armour \BOthers. (\APACyear2013) \APACinsertmetastararmour2013time{APACrefauthors}Armour, K\BPBIC., Bitz, C\BPBIM.\BCBL \BBA Roe, G\BPBIH. \APACrefYearMonthDay2013. \BBOQ\APACrefatitleTime-varying climate sensitivity from regional feedbacks Time-varying climate sensitivity from regional feedbacks.\BBCQ \APACjournalVolNumPagesJournal of Climate26134518–4534. {APACrefDOI} \doi10.1175/JCLI-D-12-00544.1 \PrintBackRefs\CurrentBib
- Arrhenius (\APACyear1896) \APACinsertmetastarArrhenius1896{APACrefauthors}Arrhenius, S. \APACrefYearMonthDay1896. \BBOQ\APACrefatitleOn the influence of carbonic acid in the air upon the temperature of the ground On the influence of carbonic acid in the air upon the temperature of the ground.\BBCQ \APACjournalVolNumPagesThe London, Edinburgh, and Dublin Philosophical Magazine and Journal of Science41251237–276. {APACrefDOI} \doi10.1086/121158 \PrintBackRefs\CurrentBib
- Bastiaansen \BOthers. (\APACyear2020) \APACinsertmetastarbastiaansen2020multivariate{APACrefauthors}Bastiaansen, R., Dijkstra, H\BPBIA.\BCBL \BBA von der Heydt, A\BPBIS. \APACrefYearMonthDay2020. \BBOQ\APACrefatitleMultivariate Estimations of Equilibrium Climate Sensitivity from Short Transient Warming Simulations Multivariate estimations of equilibrium climate sensitivity from short transient warming simulations.\BBCQ \APACjournalVolNumPagesGeophysical Research Letterse2020GL091090. {APACrefDOI} \doi10.1029/2020GL091090 \PrintBackRefs\CurrentBib
- Boeke \BOthers. (\APACyear2020) \APACinsertmetastarboeke2020nature{APACrefauthors}Boeke, R\BPBIC., Taylor, P\BPBIC.\BCBL \BBA Sejas, S\BPBIA. \APACrefYearMonthDay2020. \BBOQ\APACrefatitleOn the Nature of the Arctic’s Positive Lapse-rate Feedback On the nature of the Arctic’s positive lapse-rate feedback.\BBCQ \APACjournalVolNumPagesGeophysical Research Letterse2020GL091109. {APACrefDOI} \doi10.1029/2020GL091109 \PrintBackRefs\CurrentBib
- Boer \BOthers. (\APACyear2005) \APACinsertmetastarboer2005climate{APACrefauthors}Boer, G., Hamilton, K.\BCBL \BBA Zhu, W. \APACrefYearMonthDay2005. \BBOQ\APACrefatitleClimate sensitivity and climate change under strong forcing Climate sensitivity and climate change under strong forcing.\BBCQ \APACjournalVolNumPagesClimate Dynamics247-8685–700. {APACrefDOI} \doi10.1007/s00382-004-0500-3 \PrintBackRefs\CurrentBib
- Bony \BOthers. (\APACyear2006) \APACinsertmetastarbony2006well{APACrefauthors}Bony, S., Colman, R., Kattsov, V\BPBIM., Allan, R\BPBIP., Bretherton, C\BPBIS., Dufresne, J\BHBIL.\BDBLothers \APACrefYearMonthDay2006. \BBOQ\APACrefatitleHow well do we understand and evaluate climate change feedback processes? How well do we understand and evaluate climate change feedback processes?\BBCQ \APACjournalVolNumPagesJournal of Climate19153445–3482. {APACrefDOI} \doi10.1175/JCLI3819.1 \PrintBackRefs\CurrentBib
- Caldeira \BBA Myhrvold (\APACyear2013) \APACinsertmetastarcaldeira2013projections{APACrefauthors}Caldeira, K.\BCBT \BBA Myhrvold, N. \APACrefYearMonthDay2013. \BBOQ\APACrefatitleProjections of the pace of warming following an abrupt increase in atmospheric carbon dioxide concentration Projections of the pace of warming following an abrupt increase in atmospheric carbon dioxide concentration.\BBCQ \APACjournalVolNumPagesEnvironmental Research Letters83034039. {APACrefDOI} \doi10.1088/1748-9326/8/3/034039 \PrintBackRefs\CurrentBib
- Cess (\APACyear1975) \APACinsertmetastarcess1975global{APACrefauthors}Cess, R\BPBID. \APACrefYearMonthDay1975. \BBOQ\APACrefatitleGlobal climate change: An investigation of atmospheric feedback mechanisms Global climate change: An investigation of atmospheric feedback mechanisms.\BBCQ \APACjournalVolNumPagesTellus273193–198. {APACrefDOI} \doi10.3402/tellusa.v27i3.9901 \PrintBackRefs\CurrentBib
- Cess \BBA Potter (\APACyear1987) \APACinsertmetastarcess1987exploratory{APACrefauthors}Cess, R\BPBID.\BCBT \BBA Potter, G\BPBIL. \APACrefYearMonthDay1987. \BBOQ\APACrefatitleExploratory studies of cloud radiative forcing with a general circulation model Exploratory studies of cloud radiative forcing with a general circulation model.\BBCQ \APACjournalVolNumPagesTellus A395460–473. {APACrefDOI} \doi10.3402/tellusa.v39i5.11773 \PrintBackRefs\CurrentBib
- Curry \BOthers. (\APACyear1995) \APACinsertmetastarcurry1995sea{APACrefauthors}Curry, J\BPBIA., Schramm, J\BPBIL.\BCBL \BBA Ebert, E\BPBIE. \APACrefYearMonthDay1995. \BBOQ\APACrefatitleSea ice-albedo climate feedback mechanism Sea ice-albedo climate feedback mechanism.\BBCQ \APACjournalVolNumPagesJournal of Climate82240–247. {APACrefDOI} \doi10.1175/1520-0442(1995)008¡0240:SIACFM¿2.0.CO;2 \PrintBackRefs\CurrentBib
- Danabasoglu \BOthers. (\APACyear2020) \APACinsertmetastardanabasoglu2020community{APACrefauthors}Danabasoglu, G., Lamarque, J\BHBIF., Bacmeister, J., Bailey, D., DuVivier, A., Edwards, J.\BDBLothers \APACrefYearMonthDay2020. \BBOQ\APACrefatitleThe community earth system model version 2 (CESM2) The community earth system model version 2 (CESM2).\BBCQ \APACjournalVolNumPagesJournal of Advances in Modeling Earth Systems122. {APACrefDOI} \doi10.1029/2019MS001916 \PrintBackRefs\CurrentBib
- Dessler (\APACyear2013) \APACinsertmetastardessler2013observations{APACrefauthors}Dessler, A. \APACrefYearMonthDay2013. \BBOQ\APACrefatitleObservations of climate feedbacks over 2000–10 and comparisons to climate models Observations of climate feedbacks over 2000–10 and comparisons to climate models.\BBCQ \APACjournalVolNumPagesJournal of Climate261333–342. {APACrefDOI} \doi10.1175/JCLI-D-11-00640.1 \PrintBackRefs\CurrentBib
- Dong \BOthers. (\APACyear2020) \APACinsertmetastardong2020intermodel{APACrefauthors}Dong, Y., Armour, K\BPBIC., Zelinka, M\BPBID., Proistosescu, C., Battisti, D\BPBIS., Zhou, C.\BCBL \BBA Andrews, T. \APACrefYearMonthDay2020. \BBOQ\APACrefatitleIntermodel Spread in the pattern effect and its contribution to climate sensitivity in CMIP5 and CMIP6 models Intermodel spread in the pattern effect and its contribution to climate sensitivity in CMIP5 and CMIP6 models.\BBCQ \APACjournalVolNumPagesJournal of Climate33187755–7775. {APACrefDOI} \doi10.1175/JCLI-D-19-1011.1 \PrintBackRefs\CurrentBib
- Eyring \BOthers. (\APACyear2016) \APACinsertmetastareyring2016overview{APACrefauthors}Eyring, V., Bony, S., Meehl, G\BPBIA., Senior, C\BPBIA., Stevens, B., Stouffer, R\BPBIJ.\BCBL \BBA Taylor, K\BPBIE. \APACrefYearMonthDay2016. \BBOQ\APACrefatitleOverview of the Coupled Model Intercomparison Project Phase 6 (CMIP6) experimental design and organization Overview of the coupled model intercomparison project phase 6 (CMIP6) experimental design and organization.\BBCQ \APACjournalVolNumPagesGeoscientific Model Development951937–1958. {APACrefDOI} \doi10.5194/gmd-9-1937-2016 \PrintBackRefs\CurrentBib
- Goodwin (\APACyear2018) \APACinsertmetastargoodwin2018time{APACrefauthors}Goodwin, P. \APACrefYearMonthDay2018. \BBOQ\APACrefatitleOn the time evolution of climate sensitivity and future warming On the time evolution of climate sensitivity and future warming.\BBCQ \APACjournalVolNumPagesEarth’s Future691336–1348. {APACrefDOI} \doi10.1029/2018EF000889 \PrintBackRefs\CurrentBib
- Gregory \BBA Andrews (\APACyear2016) \APACinsertmetastargregory2016variation{APACrefauthors}Gregory, J\BPBIM.\BCBT \BBA Andrews, T. \APACrefYearMonthDay2016. \BBOQ\APACrefatitleVariation in climate sensitivity and feedback parameters during the historical period Variation in climate sensitivity and feedback parameters during the historical period.\BBCQ \APACjournalVolNumPagesGeophysical Research Letters4383911–3920. {APACrefDOI} \doi10.1002/2016GL068406 \PrintBackRefs\CurrentBib
- Gregory \BOthers. (\APACyear2004) \APACinsertmetastargregory2004new{APACrefauthors}Gregory, J\BPBIM., Ingram, W\BPBIJ., Palmer, M\BPBIA., Jones, G\BPBIS., Stott, P\BPBIA., Thorpe, R\BPBIB.\BDBLWilliams, K\BPBID. \APACrefYearMonthDay2004. \BBOQ\APACrefatitleA new method for diagnosing radiative forcing and climate sensitivity A new method for diagnosing radiative forcing and climate sensitivity.\BBCQ \APACjournalVolNumPagesGeophysical research letters313. {APACrefDOI} \doi10.1029/2003GL018747 \PrintBackRefs\CurrentBib
- Hasselmann \BOthers. (\APACyear1993) \APACinsertmetastarhasselmann1993cold{APACrefauthors}Hasselmann, K., Sausen, R., Maier-Reimer, E.\BCBL \BBA Voss, R. \APACrefYearMonthDay1993. \BBOQ\APACrefatitleOn the cold start problem in transient simulations with coupled atmosphere-ocean models On the cold start problem in transient simulations with coupled atmosphere-ocean models.\BBCQ \APACjournalVolNumPagesClimate Dynamics9253–61. {APACrefDOI} \doi10.1007/BF00210008 \PrintBackRefs\CurrentBib
- Heinze \BOthers. (\APACyear2019) \APACinsertmetastarheinze2019esd{APACrefauthors}Heinze, C., Eyring, V., Friedlingstein, P., Jones, C., Balkanski, Y., Collins, W.\BDBLothers \APACrefYearMonthDay2019. \BBOQ\APACrefatitleESD Reviews: Climate feedbacks in the Earth system and prospects for their evaluation ESD reviews: Climate feedbacks in the earth system and prospects for their evaluation.\BBCQ \APACjournalVolNumPagesEarth System Dynamics103379–452. {APACrefDOI} \doi10.5194/esd-10-379-2019 \PrintBackRefs\CurrentBib
- Klocke \BOthers. (\APACyear2013) \APACinsertmetastarklocke2013assessment{APACrefauthors}Klocke, D., Quaas, J.\BCBL \BBA Stevens, B. \APACrefYearMonthDay2013. \BBOQ\APACrefatitleAssessment of different metrics for physical climate feedbacks Assessment of different metrics for physical climate feedbacks.\BBCQ \APACjournalVolNumPagesClimate dynamics415-61173–1185. {APACrefDOI} \doi10.1007/s00382-013-1757-1 \PrintBackRefs\CurrentBib
- Knutti \BBA Rugenstein (\APACyear2015) \APACinsertmetastarknutti2015feedbacks{APACrefauthors}Knutti, R.\BCBT \BBA Rugenstein, M\BPBIA. \APACrefYearMonthDay2015. \BBOQ\APACrefatitleFeedbacks, climate sensitivity and the limits of linear models Feedbacks, climate sensitivity and the limits of linear models.\BBCQ \APACjournalVolNumPagesPhilosophical Transactions of the Royal Society A: Mathematical, Physical and Engineering Sciences373205420150146. {APACrefDOI} \doi10.1098/rsta.2015.0146 \PrintBackRefs\CurrentBib
- Lembo \BOthers. (\APACyear2020) \APACinsertmetastarlembo2020beyond{APACrefauthors}Lembo, V., Lucarini, V.\BCBL \BBA Ragone, F. \APACrefYearMonthDay2020. \BBOQ\APACrefatitleBeyond forcing scenarios: predicting climate change through response operators in a coupled general circulation model Beyond forcing scenarios: predicting climate change through response operators in a coupled general circulation model.\BBCQ \APACjournalVolNumPagesScientific Reports1011–13. {APACrefDOI} \doi10.1038/s41598-020-65297-2 \PrintBackRefs\CurrentBib
- Lucarini \BBA Sarno (\APACyear2011) \APACinsertmetastarlucarini2011statistical{APACrefauthors}Lucarini, V.\BCBT \BBA Sarno, S. \APACrefYearMonthDay2011. \BBOQ\APACrefatitleA statistical mechanical approach for the computation of the climatic response to general forcings A statistical mechanical approach for the computation of the climatic response to general forcings.\BBCQ \APACjournalVolNumPagesNonlinear Processes in Geophysics1817–28. {APACrefDOI} \doi10.5194/npg-18-7-2011 \PrintBackRefs\CurrentBib
- Maier-Reimer \BBA Hasselmann (\APACyear1987) \APACinsertmetastarmaier1987transport{APACrefauthors}Maier-Reimer, E.\BCBT \BBA Hasselmann, K. \APACrefYearMonthDay1987. \BBOQ\APACrefatitleTransport and storage of CO 2 in the ocean——an inorganic ocean-circulation carbon cycle model Transport and storage of co 2 in the ocean——an inorganic ocean-circulation carbon cycle model.\BBCQ \APACjournalVolNumPagesClimate dynamics2263–90. {APACrefDOI} \doi10.1007/BF01054491 \PrintBackRefs\CurrentBib
- Manabe \BBA Wetherald (\APACyear1967) \APACinsertmetastarmanabe1967thermal{APACrefauthors}Manabe, S.\BCBT \BBA Wetherald, R\BPBIT. \APACrefYearMonthDay1967. \BBOQ\APACrefatitleThermal equilibrium of the atmosphere with a given distribution of relative humidity Thermal equilibrium of the atmosphere with a given distribution of relative humidity.\BBCQ \APACjournalVolNumPagesJournal of the Atmospheric Sciences24241–259. {APACrefDOI} \doi10.1175/1520-0469(1967)024¡0241:TEOTAW¿2.0.CO;2 \PrintBackRefs\CurrentBib
- Marvel \BOthers. (\APACyear2018) \APACinsertmetastarmarvel2018internal{APACrefauthors}Marvel, K., Pincus, R., Schmidt, G\BPBIA.\BCBL \BBA Miller, R\BPBIL. \APACrefYearMonthDay2018. \BBOQ\APACrefatitleInternal variability and disequilibrium confound estimates of climate sensitivity from observations Internal variability and disequilibrium confound estimates of climate sensitivity from observations.\BBCQ \APACjournalVolNumPagesGeophysical Research Letters4531595–1601. {APACrefDOI} \doi10.1002/2017GL076468 \PrintBackRefs\CurrentBib
- Meraner \BOthers. (\APACyear2013) \APACinsertmetastarmeraner2013robust{APACrefauthors}Meraner, K., Mauritsen, T.\BCBL \BBA Voigt, A. \APACrefYearMonthDay2013. \BBOQ\APACrefatitleRobust increase in equilibrium climate sensitivity under global warming Robust increase in equilibrium climate sensitivity under global warming.\BBCQ \APACjournalVolNumPagesGeophysical Research Letters40225944–5948. {APACrefDOI} \doi10.1002/2013GL058118 \PrintBackRefs\CurrentBib
- Pendergrass (\APACyear2017\APACexlab\BCnt1) \APACinsertmetastarCAM5kerneldata{APACrefauthors}Pendergrass, A\BPBIG. \APACrefYearMonthDay2017\BCnt1. \BBOQ\APACrefatitleCAM5 Radiative Kernels CAM5 radiative kernels.\BBCQ \APACjournalVolNumPagesUCAR/NCAR Earth System Grid. {APACrefDOI} \doi10.5065/D6F47MT6 \PrintBackRefs\CurrentBib
- Pendergrass (\APACyear2017\APACexlab\BCnt2) \APACinsertmetastarCAM5kernelsoftware{APACrefauthors}Pendergrass, A\BPBIG. \APACrefYearMonthDay2017\BCnt2. \BBOQ\APACrefatitleCESM CAM5 Kernel Software CESM CAM5 kernel software.\BBCQ \APACjournalVolNumPagesZenodo. {APACrefDOI} \doi10.5281/zenodo.997899 \PrintBackRefs\CurrentBib
- Pendergrass \BOthers. (\APACyear2018) \APACinsertmetastarpendergrass2018surface{APACrefauthors}Pendergrass, A\BPBIG., Conley, A.\BCBL \BBA Vitt, F\BPBIM. \APACrefYearMonthDay2018. \BBOQ\APACrefatitleSurface and top-of-atmosphere radiative feedback kernels for CESM-CAM5 Surface and top-of-atmosphere radiative feedback kernels for CESM-CAM5.\BBCQ \APACjournalVolNumPagesEarth System Science Data101317–324. {APACrefDOI} \doi10.5194/essd-10-317-2018 \PrintBackRefs\CurrentBib
- Proistosescu \BBA Huybers (\APACyear2017) \APACinsertmetastarproistosescu2017slow{APACrefauthors}Proistosescu, C.\BCBT \BBA Huybers, P\BPBIJ. \APACrefYearMonthDay2017. \BBOQ\APACrefatitleSlow climate mode reconciles historical and model-based estimates of climate sensitivity Slow climate mode reconciles historical and model-based estimates of climate sensitivity.\BBCQ \APACjournalVolNumPagesScience advances37e1602821. {APACrefDOI} \doi10.1126/sciadv.1602821 \PrintBackRefs\CurrentBib
- Ragone \BOthers. (\APACyear2016) \APACinsertmetastarragone2016new{APACrefauthors}Ragone, F., Lucarini, V.\BCBL \BBA Lunkeit, F. \APACrefYearMonthDay2016. \BBOQ\APACrefatitleA new framework for climate sensitivity and prediction: a modelling perspective A new framework for climate sensitivity and prediction: a modelling perspective.\BBCQ \APACjournalVolNumPagesClimate Dynamics465-61459–1471. {APACrefDOI} \doi10.1007/s00382-015-2657-3 \PrintBackRefs\CurrentBib
- Ruelle (\APACyear2009) \APACinsertmetastarruelle2009review{APACrefauthors}Ruelle, D. \APACrefYearMonthDay2009. \BBOQ\APACrefatitleA review of linear response theory for general differentiable dynamical systems A review of linear response theory for general differentiable dynamical systems.\BBCQ \APACjournalVolNumPagesNonlinearity224855. {APACrefDOI} \doi10.1088/0951-7715/22/4/009 \PrintBackRefs\CurrentBib
- Rugenstein \BOthers. (\APACyear2020) \APACinsertmetastarrugenstein2020equilibrium{APACrefauthors}Rugenstein, M., Bloch-Johnson, J., Gregory, J., Andrews, T., Mauritsen, T., Li, C.\BDBLothers \APACrefYearMonthDay2020. \BBOQ\APACrefatitleEquilibrium climate sensitivity estimated by equilibrating climate models Equilibrium climate sensitivity estimated by equilibrating climate models.\BBCQ \APACjournalVolNumPagesGeophysical Research Letters474e2019GL083898. {APACrefDOI} \doi10.1029/2019GL083898 \PrintBackRefs\CurrentBib
- Senior \BBA Mitchell (\APACyear2000) \APACinsertmetastarsenior2000time{APACrefauthors}Senior, C\BPBIA.\BCBT \BBA Mitchell, J\BPBIF. \APACrefYearMonthDay2000. \BBOQ\APACrefatitleThe time-dependence of climate sensitivity The time-dependence of climate sensitivity.\BBCQ \APACjournalVolNumPagesGeophysical Research Letters27172685–2688. {APACrefDOI} \doi10.1029/2000GL011373 \PrintBackRefs\CurrentBib
- Shell \BOthers. (\APACyear2008) \APACinsertmetastarshell2008using{APACrefauthors}Shell, K\BPBIM., Kiehl, J\BPBIT.\BCBL \BBA Shields, C\BPBIA. \APACrefYearMonthDay2008. \BBOQ\APACrefatitleUsing the radiative kernel technique to calculate climate feedbacks in NCAR’s Community Atmospheric Model Using the radiative kernel technique to calculate climate feedbacks in NCAR’s community atmospheric model.\BBCQ \APACjournalVolNumPagesJournal of Climate21102269–2282. {APACrefDOI} \doi10.1175/2007JCLI2044.1 \PrintBackRefs\CurrentBib
- Sherwood \BOthers. (\APACyear2020) \APACinsertmetastarSherwood2020{APACrefauthors}Sherwood, S., Webb, M\BPBIJ., Annan, J\BPBID., Armour, K\BPBIC., Forster, P\BPBIM., Hargreaves, J\BPBIC.\BDBLZelinka, M\BPBID. \APACrefYearMonthDay2020. \BBOQ\APACrefatitleAn assessment of Earth’s climate sensitivity using multiple lines of evidence An assessment of Earth’s climate sensitivity using multiple lines of evidence.\BBCQ \APACjournalVolNumPagesReviews of Geophysics58e2019RG000678. {APACrefDOI} \doi10.1029/2019RG000678 \PrintBackRefs\CurrentBib
- Sinha (\APACyear1995) \APACinsertmetastarsinha1995relative{APACrefauthors}Sinha, A. \APACrefYearMonthDay1995. \BBOQ\APACrefatitleRelative influence of lapse rate and water vapor on the greenhouse effect Relative influence of lapse rate and water vapor on the greenhouse effect.\BBCQ \APACjournalVolNumPagesJournal of Geophysical Research: Atmospheres100D35095–5103. {APACrefDOI} \doi10.1029/94JD03248 \PrintBackRefs\CurrentBib
- Soden \BOthers. (\APACyear2008) \APACinsertmetastarsoden2008quantifying{APACrefauthors}Soden, B\BPBIJ., Held, I\BPBIM., Colman, R., Shell, K\BPBIM., Kiehl, J\BPBIT.\BCBL \BBA Shields, C\BPBIA. \APACrefYearMonthDay2008. \BBOQ\APACrefatitleQuantifying climate feedbacks using radiative kernels Quantifying climate feedbacks using radiative kernels.\BBCQ \APACjournalVolNumPagesJournal of Climate21143504–3520. {APACrefDOI} \doi10.1175/2007JCLI2110.1 \PrintBackRefs\CurrentBib
- Tsutsui (\APACyear2017) \APACinsertmetastartsutsui2017quantification{APACrefauthors}Tsutsui, J. \APACrefYearMonthDay2017. \BBOQ\APACrefatitleQuantification of temperature response to CO2 forcing in atmosphere–ocean general circulation models Quantification of temperature response to CO2 forcing in atmosphere–ocean general circulation models.\BBCQ \APACjournalVolNumPagesClimatic Change1402287–305. {APACrefDOI} \doi10.1007/s10584-016-1832-9 \PrintBackRefs\CurrentBib
- Von der Heydt \BOthers. (\APACyear2020) \APACinsertmetastaranna2020quantification{APACrefauthors}Von der Heydt, A\BPBIS., Ashwin, P., Camp, C\BPBID., Crucifix, M., Dijkstra, H\BPBIA., Ditlevsen, P.\BCBL \BBA Lenton, T\BPBIM. \APACrefYearMonthDay2020. \BBOQ\APACrefatitleQuantification and interpretation of the climate variability record Quantification and interpretation of the climate variability record.\BBCQ \APACjournalVolNumPagesGlobal and Planetary Change103399. {APACrefDOI} \doi10.1016/j.gloplacha.2020.103399 \PrintBackRefs\CurrentBib
- Zelinka \BOthers. (\APACyear2020) \APACinsertmetastarzelinka2020causes{APACrefauthors}Zelinka, M\BPBID., Myers, T\BPBIA., McCoy, D\BPBIT., Po-Chedley, S., Caldwell, P\BPBIM., Ceppi, P.\BDBLTaylor, K\BPBIE. \APACrefYearMonthDay2020. \BBOQ\APACrefatitleCauses of higher climate sensitivity in CMIP6 models Causes of higher climate sensitivity in CMIP6 models.\BBCQ \APACjournalVolNumPagesGeophysical Research Letters471e2019GL085782. {APACrefDOI} \doi10.1029/2019GL085782 \PrintBackRefs\CurrentBib