Topic-Aware Evidence Reasoning and Stance-Aware Aggregation for Fact Verification
Abstract
Fact verification is a challenging task that requires simultaneously reasoning and aggregating over multiple retrieved pieces of evidence to evaluate the truthfulness of a claim. Existing approaches typically (i) explore the semantic interaction between the claim and evidence at different granularity levels but fail to capture their topical consistency during the reasoning process, which we believe is crucial for verification; (ii) aggregate multiple pieces of evidence equally without considering their implicit stances to the claim, thereby introducing spurious information. To alleviate the above issues, we propose a novel topic-aware evidence reasoning and stance-aware aggregation model for more accurate fact verification, with the following four key properties: 1) checking topical consistency between the claim and evidence; 2) maintaining topical coherence among multiple pieces of evidence; 3) ensuring semantic similarity between the global topic information and the semantic representation of evidence; 4) aggregating evidence based on their implicit stances to the claim. Extensive experiments conducted on the two benchmark datasets demonstrate the superiority of the proposed model over several state-of-the-art approaches for fact verification. The source code can be obtained from https://github.com/jasenchn/TARSA.
1 Introduction
The Internet breaks the physical distance barrier among individuals to allow them to share data and information online. However, it can also be used by people with malicious purposes to disseminate misinformation or fake news. Such misinformation may cause ethnics conflicts, financial losses and political unrest, which has become one of the greatest threats to the public (Zafarani et al., 2019; Zhou et al., 2019b). Moreover, as shown in Vosoughi et al. (2018), compared with truth, misinformation diffuses significantly farther, faster, and deeper in all genres. Therefore, there is an urgent need for quickly identifying the misinformation spread on the web. To solve this problem, we focus on the fact verification task (Thorne et al., 2018), which aims to automatically evaluate the veracity of a given claim based on the textual evidence retrieved from external sources.

Recent approaches for fact verification are dominated by natural language inference models (Angeli and Manning, 2014) or textual entailment recognition models (Ma et al., 2019), where the truthfulness of a claim is verified via reasoning and aggregating over multiple pieces of retrieved evidence. In general, existing models follow an architecture with two main sub-modules: the semantic interaction module and the entailment-based aggregation module (Hanselowski et al., 2018a; Nie et al., 2019a; Soleimani et al., 2020; Liu et al., 2020). The semantic interaction module attempts to grasp the rich semantic-level interactions among multiple pieces of evidence at the sentence-level (Ma et al., 2019; Zhou et al., 2019a; Subramanian and Lee, 2020) or the semantic roles-level (Zhong et al., 2020). The entailment-based aggregation module aims to filter out irrelevant information to capture the salient information related to the claim by aggregating the semantic information coherently.
However, the aforementioned approaches typically learn the representation of each evidence-claim pair from the semantic perspective such as obtaining the semantic representation of each evidence-claim pair through pre-trained language models (Devlin et al., 2019) or graph-based models (Velickovic et al., 2018), which largely overlooked the topical consistency between claim and evidence. For example in Figure 1, given the claim “A high school student named Cole Withrow was charged for leaving an unloaded shotgun in his vehicle while parking at school” and the retrieved evidence sentences (i.e., -), we would expect a fact checking model to automatically filter evidence which is topically-unrelated to the claim such as and and only relies on the evidence which is topically-consistent with the claim such as and for veracity assessment of the claim. In addition, we also expect the topical coherence of multiple pieces of supporting evidence such as and . Furthermore, in previous approaches, the learned representations of multiple pieces of evidence are aggregated via element-wise max pooling or simple dot-product attention, which inevitably fails to capture the implicit stances of evidence toward the claim (e.g., and support the claim implicitly, and are unrelated to the claim) and leads to the combination of irrelevant information with relevant one.
To address these problems, in this paper, we propose a novel neural structure reasoning model for fact verification, named TARSA (Topic-Aware Evidence Reasoning and Stance-Aware Aggregation Model). A coherence-based topic attention is developed to model the topical consistency between a claim and each piece of evidence and the topical coherence among evidence built on the sentence-level topical representations. In addition, a semantic-topic co-attention is created to measure the coherence between the global topical information and the semantic representation of the claim and evidence. Moreover, the capsule network is incorporated to model the implicit stances of evidence toward the claim by the dynamic routing mechanism.
The main contributions are listed as follows:
-
•
We propose a novel topic-aware evidence reasoning and stance-aware aggregation approach, which is, to our best knowledge, the first attempt of jointly exploiting semantic interaction and topical consistency to learn latent evidence representation for fact verification.
-
•
We incorporate the capsule network structure into our proposed model to capture the implicit stance relations between the claim and the evidence.
-
•
We conduct extensive experiments on the two benchmark datasets to demonstrate the effectiveness of TARSA for fact verification.
2 Related Work
In general, fact verification is a task to assess the authenticity of a claim backed by a validated corpus of documents, which can be divided into two stages: fact extraction and claim verification (Zhou and Zafarani, 2020). Fact extraction can be further split into the document retrieval phase and the evidence selection phase to shrink the search space of evidence (Thorne et al., 2018). In the document retrieval phase, researchers typically reuse the top performing approaches in the FEVER1.0 challenge to extract the documents with high relevance for a given claim (Hanselowski et al., 2018b; Yoneda et al., 2018; Nie et al., 2019a). In the evidence selection phase, to select relevant sentences, researchers generally train the classification models or rank models based on the similarity between the claim and each sentence from the retrieved documents (Chen et al., 2017; Stammbach and Neumann, 2019; Soleimani et al., 2020; Wadden et al., 2020; Zhong et al., 2020; Zhou et al., 2019a).
Many fact verification approaches focus on the claim verification stage, which can be addressed by natural language inference methods (Parikh et al., 2016; Ghaeini et al., 2018; Luken et al., 2018). Typically, these approaches contain the representation learning process and evidence aggregation process. Hanselowski et al. (2018b) and Nie et al. (2019a) concatenate all pieces of evidence as input and use the max pooling to aggregate the information for claim verification via the enhanced sequential inference model (ESIM) (Chen et al., 2017). In a similar vein, Yin and Roth (2018) incorporate the identification of evidence to further improve claim verification using ESIM with different granularity levels. Ma et al. (2019) leverage the co-attention mechanism between claim and evidence to generate claim-specific evidence representations which are used to infer the claim.
Benefiting from the development of pre-trained language models, Zhou et al. (2019a) are the first to learn evidence representations by BERT (Devlin et al., 2019), which are subsequently used in a constructed evidence graph for claim inference by aggregating all claim-evidence pairs. Zhong et al. (2020) further establish a semantic-based graph for representation and aggregation with XLNet (Yang et al., 2019). Liu et al. (2020) incorporate two sets of kernels into a sentence-level graph to learn a more fine-grained evidence representations. Subramanian and Lee (2020) further incorporate evidence set retrieval and hierarchical attention sum block to improve the performance of claim verification.
Different from all previous approaches, our work for the first time handles the fact verification task by considering the topical consistency and the semantic interactions between claim and evidence. Moreover, we employ the capsule network to model the implicit stance relations of evidence toward the claim.
3 Method
In this section, we present an overview of the architecture of the proposed framework TARSA for fact verification. As shown in Figure 2, our approach consists of three main layers: 1) the representation layer to embed claim and evidence into three types of representations by a semantic encoder and a topic encoder; 2) the coherence layer to incorporate the topic information into our model by two attention components; 3) the aggregation layer to model the implicit stances of evidence toward claim using the capsule network.
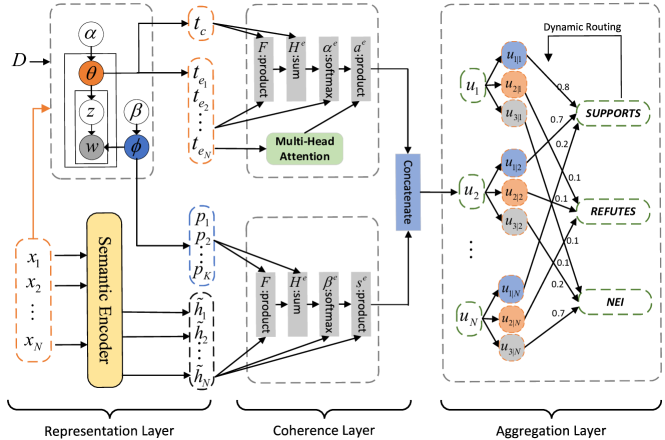
3.1 Representation Layer
This section describes how TARSA extracts semantic representations, sentence-level topic representations, and global topic information through a semantic encoder and a topic encoder separately.
Semantic Encoder
The semantic encoder in TARSA is a vanilla transformer (Vaswani et al., 2017) with the eXtra hop attention (Zhao et al., 2020). For each claim paired with pieces of retrieved evidence sentences , TARSA constructs the evidence graph by treating each evidence-claim pair as a node (i.e., ) and build a fully-connected evidence graph . We also add a self-loop to every node to perform message propagation from itself.
Specifically, we first apply the vanilla transformer on each node to generate the claim-dependent evidence representation using the input ,
| (1) |
where denotes the -th node in . We treat the first token representation as the local context of node .
Then the eXtra hop attention takes the token in each node as a “hub token”, which is to attend on hub tokens of all other connected nodes to learn the global context. One layer of eXtra hop attention can be viewed as a single-hop message propagation among all the nodes along the edges,
| (2) |
where denotes that there is an edge between the node and the node , denotes the query vector of the token of node , and denote the key vector and the vector of the token of node , respectively, and denotes the scaling factor.
The local context and the global context are concatenated to learn the semantic representation of all the nodes:
| (3) | ||||
By stacking layers of the transformer with the eXtra hop attention which takes the semantic representation of the previous layer as input, we learn the semantic representation of evidence from the graph .
Topic Encoder
We extract topics in the following two forms via latent Dirichlet allocation (LDA) (Blei et al., 2003):
Sentence-level topic representation: Given a claim and pieces of the retrieved evidence , we extract latent topic distribution for each sentence as the sentence-level topic representation, where is the number of topics. More concretely, we denote for claim and for evidence . Each scalar value denotes the contribution of topic in representing the claim or evidence.
Global topic information: We extract global topic information from the topic-word distribution by treating each sentence (i.e., claim or evidence) in corpus as a document, where denotes the vocabulary size.
3.2 Coherence Layer
This section describes how to incorporate the topic information into our model with two attention components.
Coherence-based Topic Attention
Based on the observation as illustrated in Figure 1, we assume that given a claim, the sentences used as evidence should be topically coherent with each other and the claim should be topically consistent with the relevant evidence. Therefore, two kinds of topical relationship are considered: 1) topical coherence among multiple pieces of evidence (); 2) topical consistency between the claim and each evidence ().
Specifically, to incorporate the topical coherence among multiple pieces of evidence into our model, we disregard the order of evidence and treat each evidence independently. Then we utilize the multi-head attention (Vaswani et al., 2017) without position embedding to generate the new topic representation of evidence based on the sentence-level topic representation of the retrieved evidence for a given claim.
| (4) |
Moreover, we utilize the co-attention mechanism (Chen and Li, 2020) to weigh each evidence based on the topic consistency between the claim and the evidence. Given the sentence-level topic representation for claim and for the corresponding evidence, the co-attention attends to the claim and the evidence simultaneously. We first compute the proximity matrix ,
| (5) |
where is the learnable weight matrix. The proximity matrix can be viewed as a transformation from the claim attention space to the evidence attention space. Then we can predict the interaction attention by treating as the feature,
| (6) |
where , are the learnable weight matrices. Finally we can generate a topic similarity score between the claim and each evidence using the softmax function,
| (7) |
where is the learnable weight, is the attention score of each piece of evidence for the claim. Eventually, the topic representation can be computed as follows,
| (8) |
where is the dot product operation.
Semantic-Topic Co-attention
We weigh each piece of evidence to indicate the importance of the evidence and infer the claim based on the coherence between the semantic representation and the global topic information via the co-attention mechanism, which is similar to the coherence-based topic attention in Section 3.2. More concretely, taking and as input, we compute the proximity matrix to transform the topic attention space to the semantic attention space by Eq. (5). As a result, the attention weights of evidence can be obtained by Eq. (6) and (7). Eventually, the semantic representation can be updated via .
3.3 Aggregation Layer
To model the implicit stances of evidence toward claim, we incorporate the capsule network (Sabour et al., 2017) into our model. As illustrated in Figure 2, we concatenate both the semantic representation and the topical representation to form the low-level evidence capsules . Let denote the high-level class capsules, where denotes the number of classes. The capsule network models the relationship between the evidence capsules and the class capsules by the dynamic routing mechanism (Yang et al., 2018), which can be viewed as the implicit stances of each evidence toward three classes.
Formally, let be the predicted vector from the evidence capsule to the class capsule ,
| (9) |
where denotes the transformation matrix from the evidence capsule to the class capsule . Each class capsule aggregates all of the evidence capsules by a weighted summation over all corresponding predicted vectors:
| (10) |
where is a non-linear squashing function which limits the length of to , is the coupling coefficient that determines the probability that the evidence capsule should be coupled with the class capsule . The coupling coefficient is calculated by the unsupervised and iterative dynamic routing algorithm on original logits , which is summarized in Algorithm 1. We can easily classify the claim by choosing the class capsule with the largest via the capsule loss (Sabour et al., 2017). Moreover, the cross entropy loss is applied on the evidence capsules to identify whether the evidence is the ground truth evidence.
4 Experimental Setting
This section describes the datasets, evaluation metrics, baselines, and implementation details in our experiments.
Datasets
We conduct experiments on two public fact checking datasets: (1) FEVER (Thorne et al., 2018) is a large-scale dataset consisting of 185,455 claims along with 5,416,537 Wikipedia pages from the June 2017 Wikipedia dump. The ground truth evidence and the label (i.e., “SUPPORTS”, “REFUTES” and “NOT ENOUGH INFO (NEI)”) are also available except in the test set. (2) UKP Snopes (Hanselowski et al., 2019) is a mixed-domain dataset along with 16,508 Snopes pages. To maintain the consistency of two datasets, we merge the verdicts {false, mostly false}, {true, mostly true}, {mixture, unproven, undetermined} as “REFUTES”,“SUPPORTS” and “NEI”, respectively. And we omit all other labels (i.e., legent, outdated, and miscaptioned) as these instances are difficult to distinguish. Table 1 presents the statistics of the two datasets.
| Datasets | Train | Dev | Test | Vocabulary size |
|---|---|---|---|---|
| FEVER | 145,449 | 19,998 | 19,998 | 25,753 |
| UKP Snopes | 4,659 | 582 | 583 | 2,258 |
Evaluation Metrics
The official evaluation metrics111https://github.com/sheffieldnlp/fever-scorer for the FEVER dataset are Label Accuracy (LA) and FEVER score (F-score). LA measures the accuracy of the predicted label matching the ground truth label without considering the retrieved evidence. The FEVER score labels a prediction as correct if the predicted label is correct and the retrieved evidence matches at least one gold-standard evidence, which is a better indicator to reflect the inference capability of the model. We use precision, recall, and macro F1 on UKP Snopes to evaluate the performance.
Baselines
The following approaches are employed as the baselines, including three top performing models on FEVER1.0 shared task (UKP Athene (Hanselowski et al., 2018b), UCL MRG (Yoneda et al., 2018) and UNC NLP (Nie et al., 2019a)), HAN (Ma et al., 2019), BERT-based models (SR-MRS (Nie et al., 2019b), BERT Concat (Soleimani et al., 2020) and HESM (Subramanian and Lee, 2020)), and graph-based models (GEAR (Zhou et al., 2019a), Transformer-XH (Zhao et al., 2020), KGAT (Liu et al., 2020) and DREAM (Zhong et al., 2020)).
Implementation Details
We describe our implementation details in this section.
Document retrieval takes a claim along with a collection of documents as the input, then returns most relevant documents. For the FEVER dataset, following Hanselowski et al. (2018a), we adopt the entity linking method since the title of a Wikipedia page can be viewed as an entity and can be linked easily with the extracted entities from the claim. For the UKP Snopes dataset, following Hanselowski et al. (2019), we adopt the tf-idf method where the tf-idf similarity between claim and concatenation of all sentences of each Snopes page is computed, and then the 5 highest ranked documents are taken as retrieved documents.
Evidence selection retrieves the related sentences from retrieved documents in ranking setting. For the FEVER dataset, we follow the previous method from Zhao et al. (2020). Taking the concatenation of claim and each sentence as input, the token representation is learned through BERT which is then used to learn a ranking score through a linear layer. The hinge loss is used to optimize the BERT model. For the UKP Snopes dataset, we adopt the tf-idf method from Hanselowski et al. (2019), which achieves the best precision.
Claim verification. During the training phase, each claim is paired with 5 pieces of evidence, we set the batch size to 1 and the accumulate step to 8, the layer is 3, the head number is 5, the is 100, the number of class capsules is 3, the dimension of class capsules is 10, the topic number ranges from 25 to 100. In our implementation, the maximum length of each claim-evidence pair is 130 for both datasets.
5 Experimental Results
In this section, we evaluate our TARSA model in different aspects. Firstly, we compare the overall performance between our model and the baselines. Then we conduct an ablation study to explore the effectiveness of the topic information and the capsule network structure. Finally, we also explore the advantages of our model in single-hop and multi-hop reasoning scenarios.
5.1 Overall Performance
Table 2 and Table 3 report the overall performance of our model against the baselines for the FEVER dataset and the UKP Snopes dataset 222 Note that we did not compare HESM, SR-MES and DREAM with our model on the UKP Snopes dataset for the following reasons. HESM requires hyperlinks to construct the evidence set, which are not available in UKP Snopes; SR-MRS concatenates query and context as the input to BERT, which is similar to the BERT Concat model; The composition of a claim in the UKP Snopes is more complicated than FEVER, which is more difficult for DERAM to construct a graph at the semantic level.. As shown in Table 2, our model significantly outperforms BERT-based models on both development and test sets. However, compared with the graph-based models, TARSA outperforms previous systems, GEAR and KGAT, except DREAM for LA on the test set. One possible reason is that DREAM constructs an evidence graph based on the semantic roles of claim and evidence, which leverages an explicit graph-level semantic structure built from semantic roles extracted by Semantic Role Labeling (Shi and Lin, 2019) in a fine-grained setting. Nevertheless, TARSA shows superior performance than DREAM on the FEVER score, which is a more desirable indicator to demonstrate the reasoning capability of the model. As shown in Table 3, TARSA performs the best compared with all previous approaches on the UKP Snopes dataset.
| Models | FEVER | |||
|---|---|---|---|---|
| Dev | Test | |||
| LA | F-score | LA | F-score | |
| UKP Athene | 68.49 | 64.74 | 65.46 | 61.58 |
| UCL MRG | 69.66 | 65.41 | 67.62 | 62.52 |
| UNC NLP | 69.72 | 66.49 | 68.21 | 64.21 |
| HAN | 72.00 | 57.10 | - | - |
| BERT(base) | 73.51 | 71.38 | 70.67 | 68.50 |
| BERT(large) | 74.59 | 72.42 | 71.86 | 69.66 |
| BERT Pair | 73.30 | 68.90 | 69.75 | 65.18 |
| BERT Concat | 73.67 | 68.89 | 71.01 | 65.64 |
| SR-MRS | 75.12 | 70.18 | 72.56 | 67.26 |
| HESM(ALBERT Base) | 75.77 | 73.44 | 73.25 | 70.06 |
| GEAR | 74.84 | 70.69 | 71.60 | 67.10 |
| KGAT(BERT base) | 78.02 | 75.88 | 72.81 | 69.40 |
| KGAT(BERT large) | 77.91 | 75.86 | 73.61 | 70.24 |
| DREAM | 79.16 | - | 76.85 | 70.60 |
| Transformer-XH | 78.05 | 74.98 | 72.39 | 69.07 |
| our TARSA | 81.24 | 77.96 | 73.97 | 70.70 |
| Models | UKP Snopes | ||
|---|---|---|---|
| Precision | Recall | macro F1 | |
| Random baseline | 0.333 | 0.333 | 0.333 |
| Majority vote | 0.170 | 0.198 | 0.249 |
| BERTEmb | 0.493 | 0.477 | 0.485 |
| BERT Concat | 0.485 | 0.474 | 0.478 |
| GEAR | 0.368 | 0.337 | 0.352 |
| KGAT | 0.493 | 0.440 | 0.465 |
| Transformer-XH | 0.532 | 0.529 | 0.531 |
| ours TARSA | 0.611 | 0.540 | 0.573 |
5.2 Effect of Topic Number
Table 4 shows the results of our TARSA model with different number of topics on the development set of FEVER and UKP Snopes. It can be observed that the optimal topic number is 25 for FEVER and 50 for UKP Snopes. One possible reason is that UKP Snopes is retrieved from multiple domains which includes more diverse categories than those of FEVER.
| #Topic | FEVER (%) | UKP Snopes | |||
|---|---|---|---|---|---|
| LA | F-score | P. | R. | macro F1 | |
| 25 | 81.24 | 77.96 | 0.560 | 0.539 | 0.549 |
| 50 | 80.30 | 77.13 | 0.611 | 0.540 | 0.573 |
| 75 | 80.62 | 77.38 | 0.563 | 0.564 | 0.564 |
| 100 | 80.30 | 77.13 | 0.592 | 0.533 | 0.561 |
5.3 Ablation Study
To further illustrate the effectiveness of the topic information and the capsule-level aggregation modeling, we perform an ablation study on the development set of FEVER.
Effect of Topic Information:
We first explore how the model performance is impacted by the removal of various topic components. The first six rows in Table 5 present the label accuracy (LA) and the FEVER score on the development set of FEVER after removing various components, where STI denotes the semantic-topic information in Section 3.2, denotes the topical coherence among multiple pieces of evidence, denotes the topical consistency between the claim and each piece of evidence. As expected, LA and the FEVER score decrease consistently with a gradual removal of various components, which demonstrates the effectiveness of incorporating topic information in three aspects. We find that after all modules are removed, the performance of TARSA is still nearly 2% higher than our base model, Transformer-XH, due to the use of the capsule network in TARSA.
Effect of Capsule-level Aggregation:
We explore the effectiveness of the capsule-level aggregation by comparing it with four different aggregation methods. The last four rows in Table 5 show the results of aggregation analysis in the development set on FEVER. The max pooling, sum, and mean aggregation consider the learned representations of evidence as a single matrix, then apply a linear layer to classify the input claim as SUPPORTS, REFUTES, or NEI. The attention-based aggregation method is used in Zhou et al. (2019a), where the dot-product attention is computed between the claim and each evidence to weigh them differently. Finally, our TARSA model aggregates the information of all pieces of evidence using the capsule network, which connects the evidence capsules to the class capsules in a clustered way. From the results, our model outperforms all other aggregation methods.
| Models | LA | F-score | |
|---|---|---|---|
| our TARSA | 81.24 | 77.96 | |
| -STI | 80.62 | 77.38 | |
| - | 80.51 | 77.31 | |
| - | 80.35 | 77.16 | |
| - - | 80.06 | 76.88 | |
| - - - STI | 79.93 | 76.80 | |
| Aggregation | max pooling | 79.36 | 76.33 |
| sum | 79.60 | 76.57 | |
| mean | 79.28 | 76.19 | |
| attention-based | 79.52 | 76.45 | |
| Models | Single-hop | Multi-hop | ||
|---|---|---|---|---|
| LA | F-score | LA | F-score | |
| BERT Concat | 89.93 | 84.23 | 92.74 | 89.92 |
| GEAR | 81.56 | 76.62 | 89.21 | 86.66 |
| KGAT | 90.99 | 85.22 | 93.73 | 90.93 |
| Transformer-XH | 89.23 | 83.50 | 93.39 | 90.71 |
| our TARSA | 91.30 | 85.48 | 94.82 | 92.03 |
5.4 Performance on Different Scenarios
Table 6 presents the performance of our model on single-hop and multi-hop reasoning scenarios on the FEVER dataset compared with several baselines. The single-hop mainly focuses on the denoising ability of the model with the retrieved evidence, which selects the salient evidence for inference. The multi-hop mainly emphasizes the relatedness of different pieces of evidence for the joint reasoning, which is a more complex task.
We build the training and testing sets for both single-hop and multi-hop scenarios based on the number of gold-standard evidence of a claim. If more than one gold-standard evidence is required, then the claim would require multi-hop reasoning. The instances with the NEI label are removed because there is no gold-standard evidence matching this label. The single-hop reasoning set contains 78,838 and 9,682 instances for training and testing, respectively, while the multi-hop reasoning set contains 30,972 and 3,650 instances for training and testing, respectively. As Table 6 shows, TARSA outperforms all other baselines on LA by at least 0.31% in the single-hop scenario and 1.09% in the multi-hop scenario, respectively, which shows a consistent improvement in both scenarios. In addition, TARSA is more effective on the multi-hop scenario as the capsule-level aggregation helps better aggregate the information of all pieces of evidence.
| Example: REFUTES | |
|---|---|
| Claim | During an interview with the Washington Post, President Obama stated that Americans would be better off under martial law. |
| Evidence | e1: In a statement appearing in the Washington Post, United States President Barrack Hussein Obama said Americans would be better living under martial law. |
| e2: The Washington Post, a long time democratic mouth piece and Obama supporter, downplayed the statement by suggesting it was made in jest and that President Obama had been joking around” with the reporter at the time the statement was made. | |
| e3: A Washington insider, speaking under conditions of anonymity, reveals that Obama made additional inflammatory comments not reported by the Washington Post. | |
| e4: Americans have had their chance to aspire to be better, to rise to the occasion, but time and again they fail. | |
| e5: Would tighter restrictions really be such an imposition? | |
5.5 Case Study
Table 7 illustrates an example from the UKP Snopes dataset which is correctly detected as REFUTES, where the topic words extracted by LDA are marked in blue. From the table we can observe: 1) the top two pieces of evidence (i.e., and ) have higher topical overlap with the claim and also with each other; 2) the lower two pieces of evidence (i.e., and ) seem less important because they are less topically relevant to the claim; 3) for , it is difficult to judge its relevance from either the topical or the semantic perspective, which is ambiguous for the identification of the truthfulness of the claim.
5.6 Error Analysis
We randomly select 100 incorrectly predicted instances from FEVER and UKP Snopes datasets and categorize the main errors. The first type of errors is caused by the quality of topics extracted by LDA. This is because the average length of sentences in both datasets is much shorter after removing the low- and high-frequency tokens, which poses a challenge for LDA to extract high quality topics to match the topical consistency between a claim and each evidence. The second type of errors is due to the failure of detecting multiple entity mentions referring to the same entity. For example, the claim describes “Go Ask Alice was the real life diary of a teenager girl”, where evidence describes that “This book is a work of fiction”. The model fail to understand the relationship between diary and fiction.
6 Conclusion
We have presented a novel topic-aware evidence reasoning and stance-aware aggregation model for fact verification. Our model jointly exploits the topical consistency and the semantic interaction to learn evidence representations at the sentence level. Moreover, we have proposed the use of the capsule network to model the implicit stances of evidence toward a claim for a better aggregation of information encoded in evidence. The results on two public datasets demonstrate the effectiveness of our model. In the future, we plan to explore an iterative reasoning mechanism for more efficient evidence aggregation for fact checking.
Acknowledgements
We would like to thank anonymous reviewers for their valuable comments and helpful suggestions. This work was funded by the National Key Research and Development Program of China (2016YFC1306704), the National Natural Science Foundation of China (61772132), and the EPSRC (grant no. EP/T017112/1, EP/V048597/1). YH is supported by a Turing AI Fellowship funded by the UK Research and Innovation (UKRI) (grant no. EP/V020579/1).
References
- Angeli and Manning (2014) Gabor Angeli and Christopher D. Manning. 2014. Naturalli: Natural logic inference for common sense reasoning. In Proceedings of the 2014 Conference on Empirical Methods in Natural Language Processing, pages 534–545, Doha, Qatar.
- Blei et al. (2003) David M. Blei, Andrew Y. Ng, and Michael I. Jordan. 2003. Latent dirichlet allocation. the Journel of machine Learning research, 3:993–1022.
- Chen and Li (2020) Hsin-Yu Chen and Cheng-Te Li. 2020. HENIN: learning heterogeneous neural interaction networks for explainable cyberbullying detection on social media. In Proceedings of the 2020 Conference on Empirical Methods in Natural Language Processing, pages 2543–2552, Online.
- Chen et al. (2017) Qian Chen, Xiaodan Zhu, Zhen-Hua Ling, Si Wei, Hui Jiang, and Diana Inkpen. 2017. Enhanced LSTM for natural language inference. In Proceedings of the 55th Annual Meeting of the Association for Computational Linguistics, pages 1657–1668, Vancouver, Canada.
- Devlin et al. (2019) Jacob Devlin, Ming-Wei Chang, Kenton Lee, and Kristina Toutanova. 2019. BERT: pre-training of deep bidirectional transformers for language understanding. In Proceedings of the 2019 Conference of the North American Chapter of the Association for Computational Linguistics: Human Language Technologies, pages 4171–4186, Minneapolis, MN.
- Ghaeini et al. (2018) Reza Ghaeini, Sadid A. Hasan, Vivek V. Datla, Joey Liu, Kathy Lee, Ashequl Qadir, Yuan Ling, Aaditya Prakash, Xiaoli Z. Fern, and Oladimeji Farri. 2018. Dr-bilstm: Dependent reading bidirectional LSTM for natural language inference. In Proceedings of the 2018 Conference of the North American Chapter of the Association for Computational Linguistics: Human Language Technologies, pages 1460–1469, Louisiana, LA.
- Hanselowski et al. (2018a) Andreas Hanselowski, Avinesh P. V. S., Benjamin Schiller, Felix Caspelherr, Debanjan Chaudhuri, Christian M. Meyer, and Iryna Gurevych. 2018a. A retrospective analysis of the fake news challenge stance-detection task. In Proceedings of the 27th International Conference Amiron Computational Linguistics, pages 1859–1874, Santa Fe, NM.
- Hanselowski et al. (2019) Andreas Hanselowski, Christian Stab, Claudia Schulz, Zile Li, and Iryna Gurevych. 2019. A richly annotated corpus for different tasks in automated fact-checking. In Proceedings of the 23rd Conference on Computational Natural Language Learning, pages 493–503, Hong Kong, China.
- Hanselowski et al. (2018b) Andreas Hanselowski, Hao Zhang, Zile Li, Daniil Sorokin, Benjamin Schiller, Claudia Schulz, and Iryna Gurevych. 2018b. Ukp-athene: Multi-sentence textual entailment for claim verification. CoRR, abs/1809.01479.
- Liu et al. (2020) Zhenghao Liu, Chenyan Xiong, Maosong Sun, and Zhiyuan Liu. 2020. Fine-grained fact verification with kernel graph attention network. In Proceedings of the 58th Annual Meeting of the Association for Computational Linguistics, pages 7342–7351, Online.
- Luken et al. (2018) Jackson Luken, Nanjiang Jiang, and Marie-Catherine de Marneffe. 2018. QED: A fact verification system for the FEVER shared task. In Proceedings of the First Workshop on Fact Extraction and VERification (FEVER), pages 156–160, Brussels, Belgium.
- Ma et al. (2019) Jing Ma, Wei Gao, Shafiq R. Joty, and Kam-Fai Wong. 2019. Sentence-level evidence embedding for claim verification with hierarchical attention networks. In Proceedings of the 57th Annual Meeting of the Association for Computational Linguistics, pages 2561–2571, Florence, Italy.
- Nie et al. (2019a) Yixin Nie, Haonan Chen, and Mohit Bansal. 2019a. Combining fact extraction and verification with neural semantic matching networks. In Proceedings of the Thirty-Third AAAI Conference on Artificial Intelligence, pages 6859–6866, Honolulu, HI.
- Nie et al. (2019b) Yixin Nie, Songhe Wang, and Mohit Bansal. 2019b. Revealing the importance of semantic retrieval for machine reading at scale. In Proceedings of the 2019 Conference on Empirical Methods in Natural Language Processing and the 9th International Joint Conference on Natural Language Processing, pages 2553–2566, Hong Kong, China.
- Parikh et al. (2016) Ankur P. Parikh, Oscar Täckström, Dipanjan Das, and Jakob Uszkoreit. 2016. A decomposable attention model for natural language inference. In Proceedings of the 2016 Conference on Empirical Methods in Natural Language Processing, pages 2249–2255, Austin, TX.
- Sabour et al. (2017) Sara Sabour, Nicholas Frosst, and Geoffrey E. Hinton. 2017. Dynamic routing between capsules. In Advances in Neural Information Processing Systems 30, pages 3856–3866, Long Beach, CA.
- Shi and Lin (2019) Peng Shi and Jimmy Lin. 2019. Simple BERT models for relation extraction and semantic role labeling. CoRR, abs/1904.05255.
- Soleimani et al. (2020) Amir Soleimani, Christof Monz, and Marcel Worring. 2020. BERT for evidence retrieval and claim verification. In Proceedings of 42nd European Conference on Information Retrieval, pages 359–366, Lisbon, Portugal.
- Stammbach and Neumann (2019) Dominik Stammbach and Guenter Neumann. 2019. Team domlin: Exploiting evidence enhancement for the fever shared task. In Proceedings of the Second Workshop on Fact Extraction and VERification (FEVER), pages 105–109, Hong Kong, China.
- Subramanian and Lee (2020) Shyam Subramanian and Kyumin Lee. 2020. Hierarchical evidence set modeling for automated fact extraction and verification. In Proceedings of the 2020 Conference on Empirical Methods in Natural Language Processing, pages 7798–7809, Online.
- Thorne et al. (2018) James Thorne, Andreas Vlachos, Christos Christodoulopoulos, and Arpit Mittal. 2018. FEVER: a large-scale dataset for fact extraction and verification. In Proceedings of the 2018 Conference of the North American Chapter of the Association for Computational Linguistics: Human Language Technologies, pages 809–819, New Orleans, LA.
- Vaswani et al. (2017) Ashish Vaswani, Noam Shazeer, Niki Parmar, Jakob Uszkoreit, Llion Jones, Aidan N. Gomez, Lukasz Kaiser, and Illia Polosukhin. 2017. Attention is all you need. In Advances in Neural Information Processing Systems 30, pages 5998–6008, Long Beach, CA.
- Velickovic et al. (2018) Petar Velickovic, Guillem Cucurull, Arantxa Casanova, Adriana Romero, Pietro Liò, and Yoshua Bengio. 2018. Graph attention networks. In Proceedings of 6th International Conference on Learning Representations, Vancouver, Canada.
- Vosoughi et al. (2018) Soroush Vosoughi, Deb Roy, and Sinan Aral. 2018. The spread of true and false news online. Science, 359(6380):1146–1151.
- Wadden et al. (2020) David Wadden, Shanchuan Lin, Kyle Lo, Lucy Lu Wang, Madeleine van Zuylen, Arman Cohan, and Hannaneh Hajishirzi. 2020. Fact or fiction: Verifying scientific claims. In Proceedings of the 2020 Conference on Empirical Methods in Natural Language Processing, pages 7534–7550, Online.
- Yang et al. (2018) Min Yang, Wei Zhao, Jianbo Ye, Zeyang Lei, Zhou Zhao, and Soufei Zhang. 2018. Investigating capsule networks with dynamic routing for text classification. In Proceedings of the 2018 Conference on Empirical Methods in Natural Language Processing, pages 3110–3119, Brussels, Belgium.
- Yang et al. (2019) Zhilin Yang, Zihang Dai, Yiming Yang, Jaime G. Carbonell, Ruslan Salakhutdinov, and Quoc V. Le. 2019. Xlnet: Generalized autoregressive pretraining for language understanding. In Advances in Neural Information Processing Systems 32, pages 5754–5764, Vancouver, Canada.
- Yin and Roth (2018) Wenpeng Yin and Dan Roth. 2018. Twowingos: A two-wing optimization strategy for evidential claim verification. In Proceedings of the 2018 Conference on Empirical Methods in Natural Language Processing, pages 105–114, Brussels, Belgium.
- Yoneda et al. (2018) Takuma Yoneda, Jeff Mitchell, Johannes Welbl, Pontus Stenetorp, and Sebastian Riedel. 2018. Ucl machine reading group: Four factor framework for fact finding (hexaf). In Proceedings of the First Workshop on Fact Extraction and VERification (FEVER), pages 97–102, Brussels, Belgium.
- Zafarani et al. (2019) Reza Zafarani, Xinyi Zhou, Kai Shu, and Huan Liu. 2019. Fake news research: Theories, detection strategies, and open problems. In Proceedings of the 25th ACM SIGKDD International Conference on Knowledge Discovery & Data Mining, pages 3207–3208, Anchorage, AK.
- Zhao et al. (2020) Chen Zhao, Chenyan Xiong, Corby Rosset, Xia Song, Paul N. Bennett, and Saurabh Tiwary. 2020. Transformer-xh: Multi-evidence reasoning with extra hop attention. In Proceedings of 8th International Conference on Learning Representations, Addis Ababa, Ethiopia.
- Zhong et al. (2020) Wanjun Zhong, Jingjing Xu, Duyu Tang, Zenan Xu, Nan Duan, Ming Zhou, Jiahai Wang, and Jian Yin. 2020. Reasoning over semantic-level graph for fact checking. In Proceedings of the 58th Annual Meeting of the Association for Computational Linguistics, pages 6170–6180, Online.
- Zhou et al. (2019a) Jie Zhou, Xu Han, Cheng Yang, Zhiyuan Liu, Lifeng Wang, Changcheng Li, and Maosong Sun. 2019a. GEAR: graph-based evidence aggregating and reasoning for fact verification. In Proceedings of the 57th Annual Meeting of the Association for Computational Linguistics, pages 892–901, Florence, Italy.
- Zhou and Zafarani (2020) Xinyi Zhou and Reza Zafarani. 2020. A survey of fake news: Fundamental theories, detection methods, and opportunities. ACM Computing Surveys, 53(5):109:1–109:40.
- Zhou et al. (2019b) Xinyi Zhou, Reza Zafarani, Kai Shu, and Huan Liu. 2019b. Fake news: Fundamental theories, detection strategies and challenges. In Proceedings of the Twelfth ACM International Conference on Web Search and Data Mining, pages 836–837, Melbourne, Australia.