11email: {lwl501, helen.petrie, siamak.shahandashti}@york.ac.uk
Performance and Usability of Visual and Verbal Verification of Word-based Key Fingerprints††thanks: This is an accepted manuscript to appear in the proceedings of the 15th International Symposium on Human Aspects of Information Security & Assurance, HAISA 2021.
Abstract
The security of messaging applications against person-in-the-middle attacks relies on the authenticity of the exchanged keys. For users unable to meet in person, a manual key fingerprint verification is necessary to ascertain key authenticity. Such fingerprints can be exchanged visually or verbally, and it is not clear in which condition users perform best. This paper reports the results of a -participant study that investigated differences in performance and perceived usability of visual and verbal comparisons of word-based key fingerprints, and the influence of the individual’s cognitive learning style. The results show visual comparisons to be more effective against non-security critical errors and are perceived to provide increased confidence, yet participants perceive verbal comparisons to be easier and require less mental effort. Besides, limited evidence was found on the influence of the individual’s learning style on their performance.
Keywords:
Key Fingerprint Verification Verbal and Visual Comparisons Usability Evaluation Index of Learning Styles (ILS)1 Introduction
The use of secure messaging applications has grown rapidly over the last decade, as users seek to reclaim their privacy. An as yet unsolved problem, particularly when users are unable to meet in person, is a usable protocol for authenticated key exchange that eliminates the risk of person-in-the-middle attacks.
Current solutions begin with the exchange of a key-dependent verification message via an out-of-band channel (OOB), which assures the integrity of ‘short’ messages [7]. If users can meet in person, they may create an OOB channel between their devices and automatically verify the authenticity of each other’s public key material (e.g. through NFC or scanning a QR code). This solves the problem for the in-person context, yet such applications are mainly intended for remote communication as it is not always feasible for users to meet in person.
In the remote setting, the OOB channel cannot be directly implemented between devices. The solution is to directly involve users in the comparison of their key fingerprints, short strings usually computed through cryptographic hashing of key materials. If the received fingerprint from the manual OOB channel is identical to that from the communication channel, both users can be assured of the authenticity of the keys they hold and hence the security of their communication. Fingerprints are usually encoded into easy-to-use formats such as chunked numbers (e.g. in Signal/WhatsApp), or dictionary words (e.g. in Pretty Easy Privacy (PEP, www.pep.security)) for Pretty Good Privacy (PGP) keys.
Though comparison of fingerprints avoids the requirement to meet in person, it introduces significant potential for human error and opens an additional attack vector for adversaries. The adversary need only identify a near-collision fingerprint with sufficient similarity to the authentic fingerprint that it is likely to be accepted by an inattentive user. This is a considerably easier task than finding full collisions necessary for a successful attack in the in-person setting.
Historically users tended to compare fingerprints visually, but secure messaging applications increasingly encourage a verbal comparison, a substantially different task that places very different demands upon the user. As there has been no previous investigation of user performance and perceived usability between visual and verbal fingerprint comparisons, a within-participants study is designed to investigate such differences in the context of word-based fingerprints.
The study also investigates the influence of an individual’s preferred method to receive and process information, known as cognitive or learning style, as measured by the Visual–Verbal subscale of the Index of Learning Styles (ILS) [4]. It may be that users have a preference for processing information either verbally or visually, which would affect the development of usable and secure fingerprint verification protocols and to our knowledge is yet to be investigated.
A within-participants study with 62 participants assessed the effectiveness, efficiency and perceived usability of each comparison mode. The results provide valuable insight and demonstrate a complex picture. The answer of which comparison mode is best remains unclear, with the more effective comparison mode also perceived to be less usable.
2 Background and Related Work
Usability issues in secure messaging applications have been extensively studied [12, 13, 14, 20]. Recent work has identified usability issues specific to the authentication procedures of modern secure messaging applications. Schröder et al. investigated the usability of Signal and found that from a sample of computer science students, 21 were unable to successfully verify their recipient’s public key [15]. Related work identified similar issues with WhatsApp, Viber and Telegram, finding that participants were both unaware of the need to verify their recipient’s key and unable to do so without additional instruction [6, 19].
Dechand et al. performed a detailed investigation of textual fingerprint representations, finding that word-based formats led to higher usability scores and increased attack detection rates than the traditional hexadecimal format [3]. In a similar study, Tan et al. investigated a range of visual and textual fingerprint formats, finding that the performance of visual formats varied and that text-based formats achieved some of the lowest error rates [17]. Both studies simulated visual fingerprint comparisons, with the received fingerprint displayed on a business card. Though verbal comparisons were mentioned by Dechand et al., neither study performed a comparison between visual and verbal modes.
Studies investigating a range of existing device pairing methods identified interesting differences in usability between visual and verbal fingerprint comparisons, but they involve substantially shorter fingerprints that provide sufficient security only for short-range device pairing scenarios [8, 9].
There has been considerable psychological and educational research into the concept of different cognitive or learning styles, with many different dimensions and models proposed. However, one of the more robust is visual-verbal processing. While the concept of learning style is controversial [21], and people are undoubtedly flexible in the ways they can process information, they may have preferences which would affect their perception of the usability of an authentication system. The Index of Learning Styles (ILS) was developed to gain insight into the preferred learning styles of engineering students and provide recommendations of how teaching can be adapted accordingly [4]. The ILS is a reliable and valid instrument to assess learning styles, and each of its four dimensions display high test-retest correlation coefficients after intervals of between four weeks and eight months [10, 16, 22, 5]. The Visual–Verbal subscale of the ILS assesses individual preference to receive and process information visually (e.g., through pictures and diagrams) or verbally (e.g., through written or spoken-aloud text).
3 Method
3.1 Design
The study involved a within-participants design with two conditions, with each participant comparing 20 pairs of key fingerprints visually and 20 verbally. The order of taking conditions was counterbalanced. Two of the 20 comparisons were simulated attacks and the others were non-attack comparisons. A low attack rate was used to avoid raising participants’ awareness of the possibility of attack and because attacks are uncommon in practice. Participants were asked to simulate an authentication task by matching a fingerprint of five words, either visually or verbally. The five words were selected from the Trustwords word base [11].
Performance was measured by time to make correct comparisons and errors, for both attack and non-attack comparisons. Usability was measured on a set of five-level rating items. Standard usability instruments such as the System Usability Scale (SUS) [1] do not capture all the aspects of the user experience of interest, e.g. trust that the comparison provides security and confidence in one’s judgement. Therefore, a specific set of questions was developed (see Table 1).
| Dimension | Rating items | ||||
|---|---|---|---|---|---|
| Efficiency |
|
||||
| Ease of use |
|
||||
|
|
||||
| Confidence |
|
||||
| Repeat use |
|
||||
| Trust |
|
The Hypotheses investigated were:
-
There is a significant difference in time to make the correct decision between the visual and verbal fingerprint comparisons.
-
There is a significant difference in the number of errors made using the visual and verbal fingerprint comparisons.
-
There is a significant difference in perceived usability ratings between the visual and verbal fingerprint comparisons.
-
Participants perform significantly better and report significantly greater perceived usability when the comparison mode aligns with their preferred method to receive and process information.
Ethical principles of no harm and informed consent were followed and formal ethical approval was obtained from the authors’ departmental ethics committee.
3.1.1 Security Assumptions.
The study assumed the adversary randomly generates a large set of public keys before implementing a person-in-the-middle attack. During the attack, they replace the authentic keys with ones from this set that display maximal similarity to the target fingerprint. This study simulated such an adversary using distinct PGP public keys scraped from PGP key servers, with optimal attacks found to possess fingerprints with three out of five identical words. The structure of the attacks remained consistent throughout, with all differences confined to the third and fourth words, which is consistent with previous studies [3, 17]. The adversary was also assumed to be unable to manipulate any messages exchanged over the OOB channel.
3.2 Participants
Several methods of participant recruitment were used: through the University of York network, the authors’ personal contacts, and through Amazon Mechanical Turk (MTurk). Participants recruited from local networks were entered into a prize draw, whilst participants from MTurk were paid USD 2.00. Some researchers have raised doubts about the care with which MTurk participants undertake tasks [2], but others have found that MTurk participants produce data of equal quality to those recruited in more traditional ways [18]. Therefore, it was decided to use both more traditional recruitment methods and MTurk and compare data from the two sources. No differences in responses were detected between the two groups (comparisons were made on times, errors and responses to rating questions), so results are presented for the whole sample.
In total, 75 people responded to the study, but data from 13 participants were eliminated: 2 experienced network errors, 8 provided a partial response, and 1 failed to identify a totally mismatching attention check. Data from 2 participants who are dyslexic was also eliminated. Both comparison modes involve reading words, including unusual words, which may be difficult for people with dyslexia. All participants whose data were excluded were still rewarded for their time.
| Age | Count |
|---|---|
| 18–24 | 2 |
| 25–34 | 22 |
| 35–44 | 22 |
| 45–64 | 14 |
| 65 and over | 1 |
| Prefer not to say | 1 |
| Highest Education level | Count |
|---|---|
| High School education | 9 |
| Vocational training | 4 |
| Bachelors degree | 32 |
| Postgraduate degree | 13 |
| Other | 3 |
| Prefer not to say | 1 |
Data from 62 participants were analysed, 25 men (40%), 36 women (58%) and one who identified as non-binary. Age ranged from 18–24 to over 65, with the majority being in the 25–44 years range (71%, see Table 3). Educational level ranged from high school education to postgraduate degree, with the majority having a bachelors or postgraduate degree (73%, see Table 3). As the experimental task involves reading and listening, participants were asked whether they had a visual or hearing impairment, none reported any. For the same reason, participants were asked about their proficiency in English; 98% (61/62) rated it as good or excellent, and one as average. There were 29 participants recruited via the local networks, all located in the UK except one from the USA. There were 33 participants recruited via MTurk, all in the USA. Participants responses showed 94% (58/62) use at least one secure messaging application, and 60% (37/62) do so every day. Furthermore, 87% (54/62) of participants agree that ‘it is important to be able to have private conversations using secure messaging applications’, yet 82% (51/62) of participants have never performed a fingerprint comparison.
3.3 Materials and Task
A web application was developed to enable participants to interact with mockups of two mobile devices and compare fingerprints, with PEP over PGP used as a template for the secure messaging application. PEP was chosen as it includes a word-based fingerprint representation which have been shown to provide high usability and low error rates. PEP uses a word list called Trustwords to replace every 16 bits of the hashed key with one word from Trustwords, hence resulting in five-word fingerprints to represent 80-bit hashes [11]. PEP is supported by popular email clients such as Mozilla Thunderbird.
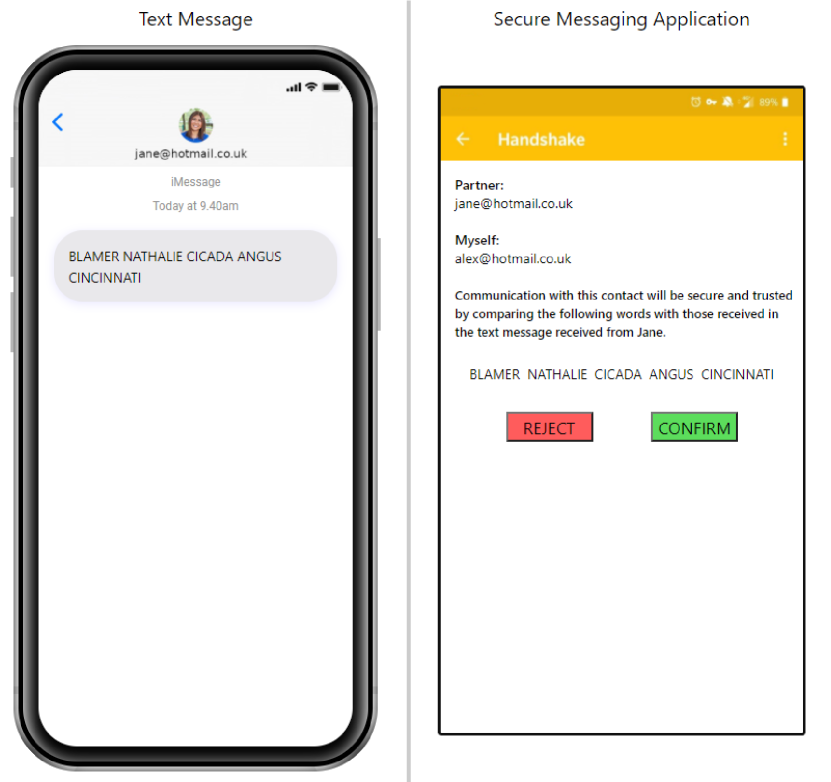
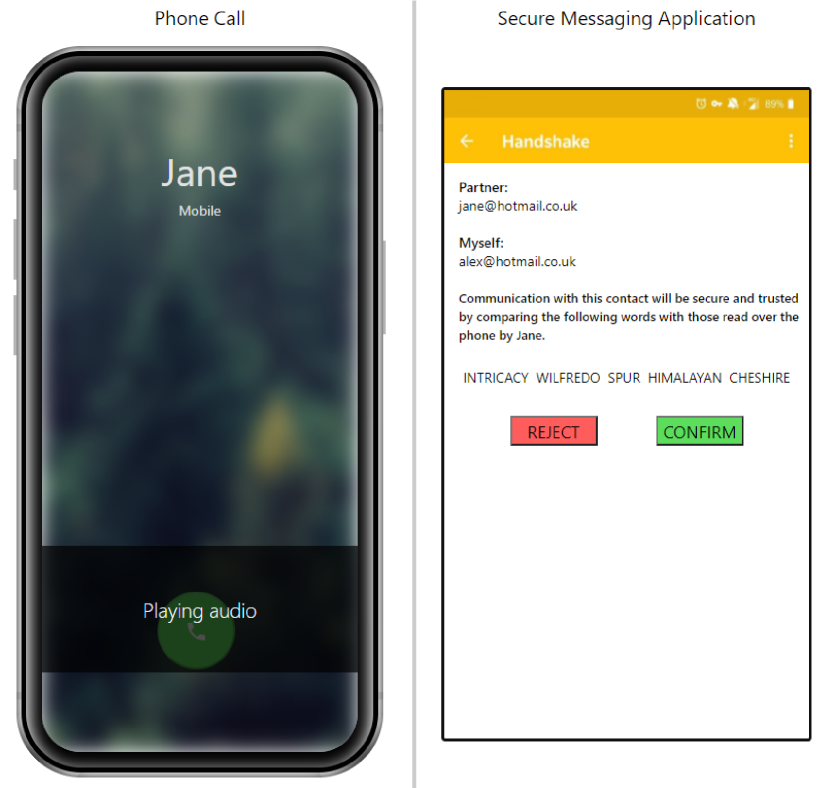
The visual condition simulated a fingerprint exchange by text message (see Fig. 2). The verbal condition simulated an exchange by voice (e.g. by phone) by playing a recorded reading of the words (see Fig. 2). The web application did not allow study completion on small screens, e.g. smartphones, that could not display the two virtual devices side by side. The 11 forced-choice questions of the ILS Visual–Verbal subscale (see Section 2) were used to measure individuals’ preferences for receiving and processing information. The subscale is scored from -11 (if all questions are answered with a verbal preference) to +11 (if all questions are answered with a visual preference).
A post-task questionnaire assessed the perceived usability of each condition. Six dimensions of usability and related concepts were identified as being of interest and two five-level rating scale items were used to measure each dimension (see Table 1). The scoring of items was reversed as appropriate so that a high number always indicates high usability. A post-study questionnaire asked participants which condition they preferred, their previous experiences using secure messaging applications and also collected demographic information.
3.4 Procedure
Before running the main study, a pilot study was conducted with four participants similar in characteristics to the target sample. This led to improvements in the explanation of the task (e.g. to clarify that participants were expected to make multiple comparisons in each condition). Several issues identified in the web application were also resolved. The main study procedure was as follows:
-
1.
An information sheet explained the aims of the study, described the tasks participants would undertake and the data to be collected. Participants were asked to confirm that they were over 18 and to consent to participation.
-
2.
Participants were asked two screening questions: if they could view an image displayed upon their device and if they could play and hear a sound clip. This ensured that participants’ devices supported the experimental conditions.
-
3.
Participants then completed the Visual–Verbal subscale of the ILS.
-
4.
Participants were randomly assigned to complete either the visual or verbal condition, compared the 20 fingerprints in that condition, and answered a post-task questionnaire to assess the perceived usability of that condition.
-
5.
The above step was then repeated for the other condition.
-
6.
Participants then answered the post-study questionnaire.
-
7.
Participants were then thanked and provided with the relevant reward.
4 Results
Data did not meet the requirements for parametric statistics (normality, homogeneity of variance), so non-parametric statistics were used, with medians and semi-interquartile range (SIQR) as measures of central tendency and spread. To compare between conditions, Wilcoxon related samples non-parametric tests were used. To compare participants with different information styles, Kruskal–Wallis tests were used.
4.1 Performance: task completion time and errors
The time to complete correct comparisons did not differ significantly between the visual and verbal modes for either the attack or non-attack trials, as tested by Wilcoxon signed-rank tests for related samples (see Table 4). Thus , that there is a difference between the times on the two conditions, was not supported.
| Verbal | Visual | Wilcoxon W | p-value | |
|---|---|---|---|---|
| Attack comparisons | 5.49 (0.75) | 5.50 (1.04) | 0.22 | 0.83 |
| Non-attack comparisons | 6.15 (0.55) | 6.52 (1.96) | 1.20 | 0.23 |
In general, participants did not make many errors (i.e. identifying a non-attack comparison as an attack or missing an attack comparison). There were only 2 attack comparisons in each condition, so errors could range from to . There were 17 non-attack comparisons, so errors could range from 0 to 17. Figs. 4 and 4 show the distribution of errors for the non-attack and attack comparisons. There was a difference in errors between the two conditions, with participants making significantly more errors in the verbal non-attack condition than in the visual non-attack condition (see Table 5). Thus , that there will be a difference between the errors on the two conditions, was supported.
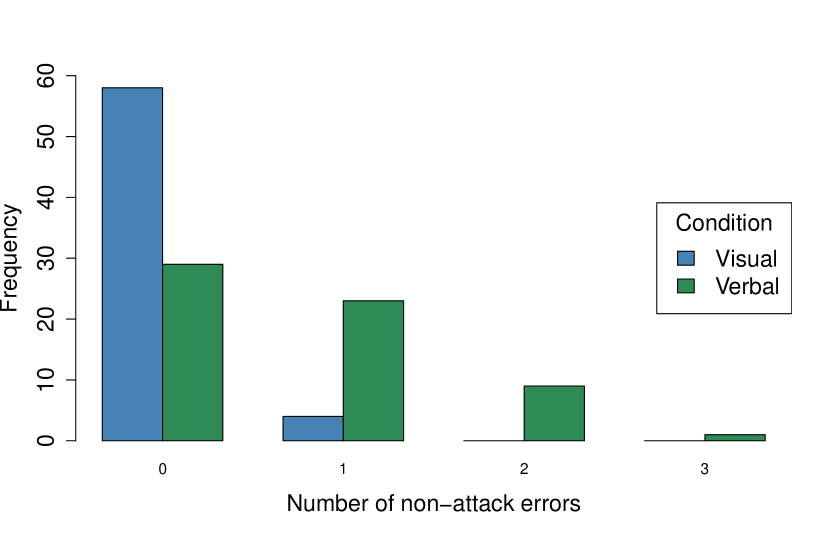
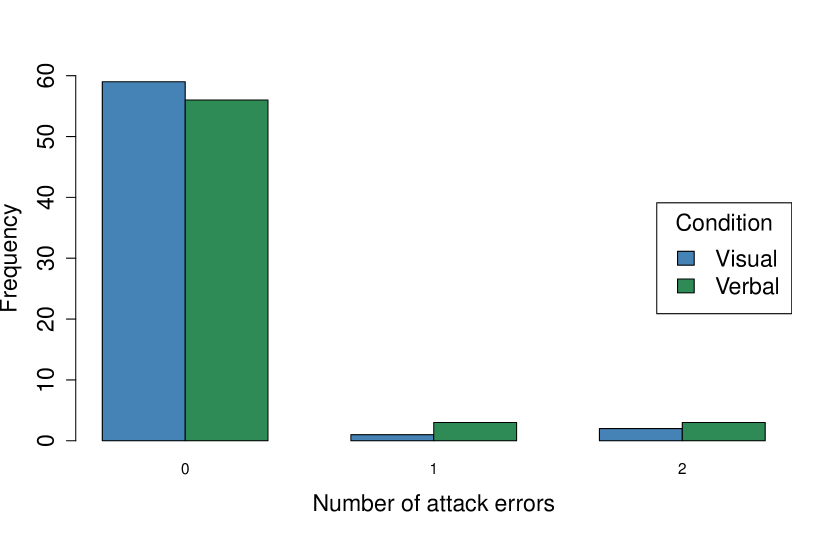
| Verbal | Visual | Wilcoxon W | p-value | |
|---|---|---|---|---|
| Attack comparisons | 0 (0.0) | 0 (0.0) | 1.19 | 0.23 |
| Non-attack comparisons | 1 (0.5) | 0 (0.0) | 4.84 | <0.01 |
4.2 Perceived usability and related concepts
The ratings on the two items for all six dimensions of perceived usability and related concepts were all highly correlated (Spearman’s between 0.31 and 0.82, all ), so median scores were calculated for each dimension and used in subsequent analyses. Table 6 shows participants’ median ratings for the six dimensions for the visual and verbal conditions. There was a significant difference on the low mental workload dimension (), with the verbal condition perceived to require less mental workload than the visual condition. There was a strong trend towards a difference on the ease of use dimension (), with the verbal condition rated as easier than the visual condition. There was also a significant difference on the confidence dimension (). Although the median ratings were the same, inspection of the distributions showed that more participants had confidence in the visual condition than the verbal condition. These results show partial support for , that there is a difference in the perceived usability of the two conditions, with the verbal condition being perceived as more usable on two out of six dimensions. In addition, at the end of the study, participants were asked which comparison mode they would prefer to use, verbal or visual. There was an almost even split between preferences for each system, with 53.2% choosing verbal and 46.8% choosing visual. This was not a significant difference (, ).
| Dimension | Verbal | Visual | Wilcoxon W | p-value |
| Efficiency | 4.00 (1.00) | 4.00 (1.00) | 0.22 | 0.83 |
| Ease of use | 4.50 (0.50) | 4.25 (0.75) | 1.84 | 0.06 |
| Low mental workload | 4.00 (0.82) | 3.00 (1.00) | 4.21 | <0.01 |
| Confidence | 4.50 (0.50) | 4.50 (0.75) | 2.39 | 0.02 |
| Repeat use | 4.00 (0.75) | 3.50 (1.00) | 1.35 | 0.18 |
| Trust | 4.00 (0.82) | 4.00 (1.00) | 0.76 | 0.45 |
4.3 Effect of preferred information style: Verbal versus Visual
The participants’ scores on the Visual–Verbal subscale of the ILS were skewed towards the visual end of the scale. To create groups of approximately equal size for analysis, participants were divided into three groups: Very Visual (scores 7 to 11, 23 participants); Moderately Visual (scores 1 to 5, 21 participants); and Verbal (scores to , 18 participants).
There were no significant differences in time to complete correct comparisons in either the verbal or visual conditions between the three groups of participants. Nor were there any significant differences in the errors made on the attack comparisons. However, all three groups made significantly more errors in the verbal condition than in the visual condition (Wilcoxon related samples tests, Very Visual: , Moderately Visual: , Verbal: , all ). This does not support , which predicted verbal users make more errors on the visual condition and visual users make more errors on the verbal condition.
5 Discussion and Conclusions
This paper reported the results of the first investigation of differences in effectiveness, efficiency and perceived usability between visual and verbal comparisons of word-based key fingerprints.
Participants were found to make more non-attack errors when using a verbal comparison mode. One explanation for this result is that it is easier to mishear than misread a word. Without asking for the word to be spelt out, users are unable to check the spelling of any unfamiliar spoken words, and this uncertainty may cause users to reject fingerprints that they would otherwise accept if a visual comparison mode was used. This explanation gains further support since participants perceived that the visual condition provided increased confidence that they were getting the comparisons correct. In contrast, the verbal condition was perceived to require less mental effort and be easier to use. Since fingerprint comparisons are a secondary task to actual communication, these factors may motivate them to choose a verbal comparison mode even though visual comparisons would provide increased effectiveness and confidence.
Even though visual comparisons were shown to be effective and perceived to provide increased usability in two of the six dimensions assessed, practical examples of secure messaging applications largely encourage the use of a verbal comparison mode and tend not to support or encourage visual comparisons. Given these findings, it seems some users would benefit from applications adding increased support for both visual and verbal fingerprint comparisons.
A surprising result was the lack of effect between comparison mode and Visual–Verbal subscale score. One interpretation is that the main effect of comparison mode dominates, and visual comparisons are significantly more effective against non-attack errors for all users. However, care must be taken before reaching this conclusion given the sample’s skew towards participants with a visual preference to receive and process information. Further research, that includes a greater proportion of participants with a verbal preference, is required to clarify this. Another explanation is that the Visual–Verbal subscale does not measure the intended phenomena and an alternative scale may be more appropriate. 7 of the 11 Visual–Verbal subscale questions actually provide 2 visual responses (e.g. written text or diagrams). Future work will attempt to identify a measure of difference between auditory and visual preferences to receive information.
All the fingerprints in this study were based on the Trustwords representation of PEP over PGP. The Trustwords word base contains many unusual and unfamiliar words which may have contributed to the increased number of non-attack errors in the verbal condition. Future research may include fingerprints in other representations (e.g. the numeric representation used by Signal/WhatsApp) to determine if the effects observed in this study are specific to the Trustwords representation or fundamental properties of a fingerprint verification.
A limitation of the study was that each condition included only two attacks. Though there were good reasons for the low attack rate, it made identification of a significant effect between conditions difficult. Furthermore, attacks lacked enough similarity and participants identified them with ease. Future work will include a greater number of attack trials that display greater similarity.
The answer to which comparison mode is best remains unclear. Visual comparisons were found to be more effective against non-security errors and perceived to provide increased confidence, yet verbal comparisons were perceived to be easier and require less mental effort. Though participants often displayed a preference for a particular comparison mode (based on measures of both performance and perceived usability), this did not correlate with their score on the Visual–Verbal subscale of the ILS. The results show that identification of the optimal comparison mode and the related influence of a user’s cognitive learning style on key fingerprint comparisons remain unclear. These present complex and interesting research questions that require further investigation.
References
- [1] J. Brooke. SUS: a “quick and dirty’ usability scale. Usability Evaluation in Industry, 1996.
- [2] J. Chandler, P. Mueller, and G. Paolacci. Nonnaïveté among Amazon Mechanical Turk workers: consequences and solutions for behavioral researchers. Behav. Res. Methods, 46(1):112–130, Mar. 2014.
- [3] S. Dechand, D. Schürmann, K. Busse, Y. Acar, S. Fahl, and M. Smith. An empirical study of textual key-fingerprint representations. In USENIX Security, pages 193–208, 2016.
- [4] R. M. Felder, L. K. Silverman, et al. Learning and teaching styles in engineering education. Engineering education, 78(7):674–681, 1988.
- [5] R. M. Felder and J. Spurlin. Applications, reliability and validity of the index of learning styles. Int’l Iournal of Engineering Education, 21(1):103–112, 2005.
- [6] A. Herzberg and H. Leibowitz. Can Johnny finally encrypt? evaluating E2E-encryption in popular IM applications. In STAST ’16, pages 17–28. ACM, 2016.
- [7] R. Kainda, I. Flechais, and A. W. Roscoe. Usability and security of out-of-band channels in secure device pairing protocols. In SOUPS, page 11. ACM, July 2009.
- [8] A. Kobsa, R. Sonawalla, G. Tsudik, E. Uzun, and Y. Wang. Serial hook-ups: a comparative usability study of secure device pairing methods. In SOUPS, pages 1–12. ACM, 2009.
- [9] A. Kumar, N. Saxena, G. Tsudik, and E. Uzun. Caveat eptor: A comparative study of secure device pairing methods. In IEEE PerCom, pages 1–10, Mar. 2009.
- [10] G. A. Livesay, K. C. Dee, E. A. Nauman, and L. S. Hites, Jr. Engineering student learning styles: a statistical analysis using felder’s index of learning styles. In Annual Conference of the American Society for Engineering Education, 2002.
- [11] H. Marques and B. Hoeneisen. pretty Easy privacy (pEp): Contact and Channel Authentication through Handshake. IETF Network Working Group, Draft, 2020.
- [12] H. Orman. Why won’t Johnny encrypt? IEEE Internet Comput., 19(1):90–94, 2015.
- [13] S. Ruoti, J. Andersen, D. Zappala, and K. Seamons. Why Johnny still, still can’t encrypt: Evaluating the usability of a modern PGP client. arXiv: 1510.08555, 2015.
- [14] S. Ruoti, N. Kim, B. Burgon, T. van der Horst, and K. Seamons. Confused Johnny: when automatic encryption leads to confusion and mistakes. In SOUPS, pages 1–12. ACM, 2013.
- [15] S. Schröder, M. Huber, D. Wind, and C. Rottermanner. When SIGNAL hits the fan: On the usability and security of State-of-the-Art secure mobile messaging. In 1st European Workshop on Usable Security. Internet Society, 2016.
- [16] N. Seery, W. F. Gaughran, and T. Waldmann. Multi-modal learning in engineering education. In ASEE Conference and Exposition. Society for Eng. Education, 2003.
- [17] J. Tan, L. Bauer, J. Bonneau, L. F. Cranor, J. Thomas, and B. Ur. Can unicorns help users compare crypto key fingerprints? In CHI’17, pages 3787–3798, 2017.
- [18] K. A. Thomas and S. Clifford. Validity and Mechanical Turk: An assessment of exclusion methods and interactive experiments. Comput. Human Behav., 77:184–197, Dec. 2017.
- [19] E. Vaziripour, J. Wu, M. O’Neill, J. Whitehead, S. Heidbrink, K. Seamons, and D. Zappala. Is that you, Alice? a usability study of the authentication ceremony of secure messaging applications. In SOUPS 2017, pages 29–47, 2017.
- [20] A. Whitten and J. D. Tygar. Why Johnny can’t encrypt: A usability evaluation of PGP 5.0. In USENIX Security, volume 348. USENIX, 1999.
- [21] D. T. Willingham, E. M. Hughes, and D. G. Dobolyi. The Scientific Status of Learning Styles Theories. Teach. Psychol., 42(3):266–271, July 2015.
- [22] M. S. Zywno. A contribution to validation of score meaning for Felder-Soloman’s index of learning styles. In ASEE Annual Conference, volume 119, 2003.