MS-0001-1922.65
Bertsimas and Orfanoudaki
Algorithmic Insurance
Algorithmic Insurance
Dimitris Bertsimas \AFFSloan School of Management, Massachusetts Institute of Technology, MA, USA \EMAILdbertsim@mit.edu \AUTHORAgni Orfanoudaki \AFFSaïd Business School, Oxford University, United Kingdom, \EMAILagni.orfanoudaki@sbs.ox.ac.uk
As machine learning algorithms start to get integrated into the decision-making process of companies and organizations, insurance products are being developed to protect their owners from liability risk. Algorithmic liability differs from human liability since it is based on a single model compared to multiple heterogeneous decision-makers and its performance is known a priori for a given set of data. Traditional actuarial tools for human liability do not take these properties into consideration, primarily focusing on the distribution of historical claims. We propose, for the first time, a quantitative framework to estimate the risk exposure of insurance contracts for machine-driven liability, introducing the concept of algorithmic insurance. Specifically, we present an optimization formulation to estimate the risk exposure of a binary classification model given a pre-defined range of premiums. We adjust the formulation to account for uncertainty in the resulting losses using robust optimization. Our approach outlines how properties of the model, such as accuracy, interpretability, and generalizability, can influence the insurance contract evaluation. To showcase a practical implementation of the proposed framework, we present a case study of medical malpractice in the context of breast cancer detection. Our analysis focuses on measuring the effect of the model parameters on the expected financial loss and identifying the aspects of algorithmic performance that predominantly affect the risk of the contract.
Algorithmic Insurance; Machine Learning; Algorithmic Risk; Insurance Contracts
1 Introduction
Data-driven analytical models and machine learning (ML) algorithms have started transforming large facets of the economy, becoming the driver of innovation in digital marketing, self-driving cars, and medical imaging, among others (Brynjolfsson and Mcafee 2017). While the use of artificial intelligence (AI) expands across all segments of society, algorithms are expected to replace human judgment in many cases (Coglianese and Lehr 2016). However, there is still a lot of resistance to employing these tools in practice as different types of concerns are emerging about algorithmic decision-making (Char et al. 2018). Dietvorst et al. (2015) defined this phenomenon as algorithm aversion, identifying a wide range of factors, including ethical issues, related to the use of algorithms that are not resolved yet (Dietvorst et al. 2018). One of the persistent challenges related to the implementation of ML models in practice is centered around the question of responsibility in case of erroneous algorithmic decisions making (Singh et al. 2016).
This is not the first time that society is reluctant to use new technology in the presence of tangible evidence for its benefits. A similar dilemma that gained the spotlight in the past was regarding the adoption of automobiles by the broader consumer audience in urban areas after World War I. Motor vehicles at that time had become fast and less expensive. Nevertheless, the vast majority of households were still reluctant to adopt the technology due to potentially high financial risks. Injured victims would seldom receive any compensation in an accident, and drivers often faced considerable costs for damage to their cars and property. To protect vehicle owners and drivers against the risk of car accidents, the Road Traffic Act was established in 1930, introducing the first compulsory car insurance scheme (Senn 1930) and solving the issue. Over the years, legal questions related to responsibility became inextricably linked to third-party liability (Reed et al. 2016). Nowadays, liability coverage is required for automotive insurance policies, product manufacturers, and anyone who practices medicine or law.
Today, an analogous problem is present. decision-makers assume the liability risk for algorithmic mistakes without any insurance protection, similarly to how commercial car drivers were called to operate their vehicles at the beginning of the 20th century. As a result, even though algorithms can improve upon the accuracy and performance of humans, their integration in critical decision-making settings is still limited (Burton et al. 2020). For example, even though technology permits the production of semi or fully autonomous vehicles, policymakers choose not to allow them (Geistfeld 2017). One of the reasons is that third-party liability lies on the human driver and would not account for the vehicle navigation algorithm (Schellekens 2015). In the medical setting, physicians are reluctant to assume the liability risk for assessments of ML models as it lies beyond their control (Stern et al. 2022, Price et al. 2019).
We argue that in order to replace or augment human decision-making with ML models in settings of high financial or life risk, a new type of liability insurance is required. We will refer to this new type of liability as Algorithmic Liability and to the corresponding contracts as Algorithmic Insurance. Potential examples are self-driving cars (third-party liability), preventive maintenance based on ML (general liability), and image recognition systems for MRI machines (medical liability). Several regulators have recognized the need for tailored liability rules for artificial intelligence.
The United Kingdom recently established that algorithmic liability will fall within the category of strict liability, where one contract will cover the risk for both human and algorithmic mistakes (UK Ministry for Transport 2022). China has also legislated various levels of liability protections for users of automated vehicles (China Government 2022). The European Union has issued a specific directive on adapting non-contractual civil liability rules to artificial intelligence algorithms (European Union Commission 2022, Stöger et al. 2021). The increasing number of legal frameworks from all over the world around algorithmic liability highlights the need for corresponding insurance products from the policy makers’ perspective (Rafter et al. 2022).
Other than providing a timely solution to the issue of legal liability, algorithmic insurance contracts will also provide another layer of financial incentives for ML adoption. This claim is based on the assumption that ML-based decision support tools are only considered for decision systems where they are expected to improve the quality or accuracy of the rendered services and products. Thus, they are expected to reduce the frequency of erroneous decisions. For example, in the clinical setting, computer vision systems are considered as a first layer of screening in radiology departments due to proven improvements in cancer detection (Yala et al. 2019). A higher detection rate should lead to less liability risk for the department and thus lower premiums. Thus, part of the value proposition for ML integration would be the reduction of insurance fees for liability purposes and thus direct financial incentives for the users.
The insurance industry has recently started to explore this new class of products (MunichRe 2022). An increasing number of services are being developed to offer this new type of legal contract that individuals and organizations could sign to protect themselves from algorithmic mistakes (MunichRe 2022). However, traditional methodologies from the field of actuarial science are based on the distribution of past claims assuming that decisions are based on a heterogeneous pool of decision-makers. Algorithmic insurance contracts require a different risk estimation approach.
1.1 Summary of Contributions
We propose the first quantitative framework for algorithmic insurance. We introduce the concept of algorithmic insurance contracts and present, for the first time, a data-driven methodology to evaluate the risk of such contracts in situations where decisions are made by ML algorithms. Algorithmic insurance can address some of the most pertinent issues regarding the connection between human decision-makers and algorithms, including algorithmic aversion, transparency, generalizability, and adoption. Therefore, our work complements the growing literature that aims to advance human and algorithm interactions (Kawaguchi 2021, Dai and Singh 2020, Ibrahim et al. 2021). Our contributions can be summarized as follows:
-
1.
We propose a comprehensive framework to estimate the risk of algorithmic liability based on the properties of accuracy, interpretability, and generalizability of a binary classification model.
-
2.
We show how a tractable optimization formulation that leverages measures of risk from the financial literature can be adapted to estimate the risk exposure for a given premium range and binary classification model. We provide an example of how this formulation can be extended to account for uncertainty around historical scenarios of loss using robust optimization.
-
3.
We apply the framework to a case study for medical liability and analyze the potential effect of the model parameters in simulated experiments.
-
4.
We show that the most impactful determinant of a predictive model’s risk exposure is the chosen classification threshold. Thus, we provide decision-makers with a new way of assessing the balance between desired levels of sensitivity and specificity.
-
5.
We translate the degree of algorithmic interpretability to a measure of human and machine interactions and model them with a class of functions. Our analysis illustrates that the convexity of the selected interpretability function dictates whether a smaller or larger degree of transparency is needed to significantly reduce the expected risk exposure of the contract. Thus, our framework help guide decision-makers and ML vendor to financially quantify the trade-offs between more or less interpretable algorithms and their synergies with humans.
-
6.
We propose the use of Generative Adversarial Networks (GANs) to estimate the impact of changes in the underlying data distribution on the liability risk. Our approach offers a data-driven way to test the generalizability of algorithmic performance.
The structure of the paper is as follows: in Section 2 we describe the setting of algorithmic insurance, clarifying the context and assumptions based on which the proposed framework is structured. In Section 3, we introduce a case study of medical liability in the context of breast cancer detection that serves to define in a concrete way the problem we are addressing. In Section 4, we present the baseline optimization formulation to estimate algorithmic risk exposure. In Section 5, we incorporate the predictive accuracy of a binary classification model into the estimation process of future expected loss. In Section 6, we demonstrate how to include a ML algorithm’s interpretability into the pricing strategy. Section 7 focuses on data generalizability and its effect on premium determination. In each of the Sections 5-7, we use the medical liability case study to showcase a practical implementation of the framework and highlight the effect of the model parameters. In Section 8, we discuss the key findings from the computational experiments, the limitations of the framework, and future applications of the proposed approach. We conclude in Section 9.
2 The Algorithmic Insurance Setting
The algorithmic insurance setting refers to situations where ML model providers seek to establish an insurance contract that offers financial protection against the damage that potential erroneous predictions of their algorithms could cause to their clients. These contracts are offered by insurance companies in exchange for a premium that is paid by the ML provider. To build a quantitative framework that evaluates the financial risk of algorithmic insurance contracts, we first need to address three fundamental questions: (1) What are the properties of ML models that affect algorithmic risk? (2) What are the synergies with the current actuarial approach? (3) Who pays for the premium? Below we answer these questions, outlining the assumptions and key aspects of the algorithmic insurance framework.
What are the properties of ML models that affect algorithmic risk?
We focus on the context of binary classification algorithms and address how the properties of accuracy, interpretability, and generalizability can influence risk exposure. We define accuracy as the ability of the model to discriminate between the two classes prevalent in the data (Bertsimas and Dunn 2019). We measure interpretability as the degree to which humans can understand the reasoning behind the predictions of a model (Krishnan 2020). Past studies have shown that transparent models allow for more synergies between human and algorithmic decision-making as humans can rationalize the algorithmic recommendations and potentially improve upon them using their intuition (Wang et al. 2022). Thus, we assume that machine intelligence, when combined with human intelligence, can lead to fewer errors compared to each one of them individually (Ibrahim et al. 2021). However, empirical validation is needed to confirm this hypothesis in practice. Last but not least, we propose ways to adjust the estimated risk exposure based on the distribution of the data provided to the algorithm beyond the original testing set (Futoma et al. 2020). We refer to the latter as the generalizability of the ML model. We assume that these model properties do not change over time for the duration of the contract.
What are the synergies with the current actuarial approach?
The prerequisites to form this type of contract are, as in all cases of insurance, (i) an agreement between the parties, (ii) the existence of a risk to the insured party or potential third parties, (iii) the payment of a premium (Bertolini 2013). We determine the premium as a function of the assumed risk. Hence the premium varies according to both the likelihood of its occurrence (frequency) and the magnitude of the consequences that may arise once it materializes (severity) (Shavell 2018). Thus, the main focus of this work is the estimation of the expected risk exposure given a certain pricing range.
Pricing traditional non-life insurance products is usually conducted using the fundamental principles of actuarial science and asset pricing theory (Cummins 1990). Leveraging historic observations from prior realizations of risk, underwriters are able to create probabilistic models that estimate the potential risk exposure as well as the relative frequency of adverse events and associate an appropriate price (Embrechts 2000). decision-maker heterogeneity is thus only embedded in an actuarial framework by subsetting the empirical distribution to historical cases with the same characteristics. For example, in the context of car insurance, drivers may be charged a premium according to the distribution of all past clients with similar ages and years of driving experience. Due to a lack of data availability, other types of contextual information that characterize the risk exposure are not included. Algorithmic insurance does not have to follow this paradigm. The underlying decision model is known and thus the insurance policy does not have to be based on past models for the same task. It can rather leverage the characteristics of the data and model at hand.
Though risk estimation can be personalized to the model, one key challenge of algorithmic insurance is the absence of historic claims that could be used to directly apply existing underwriting processes. During the initial implementation of ML-driven decision-making tools, very limited information regarding past algorithmic mistakes is available. For example, since fully autonomous cars have not been deployed yet, it is impossible to collect information with respect to past accidents they have caused. We overcome this limitation by assuming that the distributions of the testing set in the data used for model development and the distribution of the population where the algorithm is deployed are the same. We relax this assumption in Section 7.
Who pays for the premium?
A key question in algorithmic insurance that needs to be answered is who is the primary risk holder. In a traditional setting, the decision-maker is responsible for establishing insurance coverage (Landsman and Sherris 2001). For example, third-party liability insurance is paid by the driver, while medical liability insurance is sought by the physician. However, in the case of algorithmic decision-making, policymakers and regulators recognize that users (e.g., driver or physician) are unlikely to neither have control over the ML model nor access to the underlying training data and thus cannot be considered legally liable (Evas 2018, European Union Commission 2022). In this setting, risk exposure is considered a function of the model to be deployed and the associated testing distribution (Čerka et al. 2015, Kingston 2016). In our setting, the insurance contract will be formed between the AI provider and an insurance company as part of the company offering. The ML model vendor will be responsible to pay for the premium in case of prediction errors, even if there is no established causal evidence for the error but just an association. This is in line with the most recent algorithmic liability legislation and the only algorithmic insurance products that are offered in practice (MunichRe 2022, European Union Commission 2022). For instance, autonomous vehicle providers will include third-party liability as part of the final product (Gorzelany 2015). AI solution providers for medical applications will offer algorithms with liability coverage to healthcare institutions (Stern et al. 2022). Under this assumption, our goal is to estimate the expected risk exposure of a given contract based on an agreed premium range. We will also hypothesize that the algorithm’s performance and the respective premium are stationary for the duration of the contract. Competition concerning the same product or service by other ML providers remains out of the scope of this work.
3 A Case Study of Medical Liability for Malignant Tumor Detection
Throughout the manuscript, we motivate and illustrate the proposed framework through the lens of a case study in medical liability for breast cancer detection. In this section, we introduce the case study background and present information related to both the data used and the general context of medical liability for malignant tumor detection.
The setting of disease detection is one of the most celebrated application areas of AI (Topol 2019). Yet, only a tiny fraction of ML models for medical applications have been integrated into major healthcare institutions (Panch et al. 2019). Among the multitude of factors that have led to the limited deployment of ML models in the medical practice, algorithmic aversion and lack of financial incentives play a major role (Dai and Singh 2021). Medical liability is also a setting where both type I and type II errors can have profound implications, calling for a fine balance in algorithmic decision-making (Baicker et al. 2007, Harned et al. 2019, Price et al. 2019). Moreover, it is a context where algorithmic transparency and generalizability are prerequisites for successful implementation (Cutillo et al. 2020, Parikh et al. 2019). For these reasons, medical liability for ML models is an intuitive example of the value that algorithmic insurance contracts will bring into practice and is used as a case study. However, we recognize that the healthcare field faces many other regulatory challenges and constraints, such as data privacy and biases, that we will not consider and could be the focus of future research (Price and Cohen 2019, Obermeyer et al. 2019).
We delve into breast cancer, a carcinoma that is estimated to affect one out of eight women at some point in their lifetime (SEER 2020). According to the American Cancer Society, more than 250,000 women are diagnosed with invasive breast cancer annually in the US (Siegel et al. 2018). Due to widely established screening policies and improved therapies, breast cancer now has one of the lowest mortality rates among carcinomas (Berry et al. 2005). Nevertheless, medical malpractice related to breast cancer and breast imaging remains common and costly for radiologists and healthcare organizations involved (Lee et al. 2020). In the future, the widespread implementation of artificial intelligence algorithms is expected to improve diagnostic accuracy and reduce diagnostic errors in carcinomas (Kim et al. 2020, Yala et al. 2019).
Given the transformative role that ML can play in this application area, we focus on a case study for breast cancer detection to illustrate a practical implementation of the proposed pricing framework. First, we present an overview of historical medical malpractice lawsuits for breast cancer detection. Subsequently, we describe the dataset we use to train the underlying predictive model.
3.1 Medical Malpractice Lawsuits for Breast Cancer
Lawsuits involving breast cancer are the most common cause of medical malpractice litigation in the United States (Whang et al. 2013). An analysis from credentialing data of 8401 radiologists revealed that breast cancer was the most frequently missed diagnosis, followed by non-vertebral fractures and spinal fractures (Whang et al. 2013). Breast cancer imaging lawsuits involve physicians from multiple specialties, radiology being the most common. Lee et al. (2020) identified 253 cases in the US from 2005 to 2015 that resulted in plaintiff payment where the average award amount was $978,858. The median award amount in cases with a verdict was $862,500 with interquartile range (IQR), defined as , ranging between $500,000 and $2,009,460. In cases that concluded with a settlement, it was as high as $1,162,500 with IQR varying from $17,000 to $2,000,000.
Our work will focus on Fine Needle Aspirate (FNA) analyses. FNA biopsies are recommended for women suspected of suffering from breast cancer. During this procedure, a small amount of breast tissue or fluid is taken from the suspicious area and checked for cancer cells. In a study conducted from 1995 to 1997, 218 surgical pathology and FNA claims were reviewed. Breast FNA corresponded to 6% of those records, while breast biopsy accounted for another 14% (Anderson and Troxel 2005). 54% of breast biopsy claims referred to false-negative diagnoses of breast carcinoma, whereas 35% were for the false positive diagnosis of cancer, demonstrating the importance of high sensitivity and specificity for the binary classification model (Le et al. 2016). Malpractice claims from false positive FNAs are usually attributed to wrong interpretations by the medical team. The most common case is when a fibroadenoma is misclassified as carcinoma resulting in unnecessary mastectomy or axillary node sampling if breast conservation is elected (Anderson and Troxel 2005). Such cases can result in malpractice claims of more than $800,000 (Rosen&Perry 2021, Gismondi&Associates 2012).
3.2 Data Description
For our analysis, we will use the Breast Cancer Wisconsin Diagnostic dataset from the UCI ML Repository (Dua and Graff 2017). The dataset’s features represent characteristics of the cell nuclei of a breast mass (Street et al. 1993). This information was acquired from digitized images of FNA. The dataset contains ten features related to the cell nucleus of each sample, including radius, texture, perimeter, area, smoothness, degree of compactness, concavity, presence of concave points, symmetry, and fractal dimension. The outcome of interest is whether the sample belongs to a benign or malignant tumor.
3.3 Binary Classification Model Development
The data were randomly split into training (75%) and testing sets (25%). Missing values in each partition were imputed using the MedImpute algorithm (Bertsimas et al. 2021). We use the Random Forests algorithm to train the binary classification models (Breiman 2001). We apply 10-fold cross-validation to set the number of estimators and the maximum depth of the individual tree-based models. The average AUC of the final model on the testing set is 99.36%. The statistical analysis was conducted using Python 3.7 and Julia 1.3 (Pedregosa et al. 2011, Bezanson et al. 2017). The codebase for all experiments is available as a GitHub repository upon request.
4 Quantifying the Risk Exposure
In the following sections, we will present a general framework to estimate risk and analyze the impact of predictive performance, interpretability, and generalizability. We will apply the proposed methodology to the binary classification models from the case study for each of these properties. The goal is to understand the effect of the model parameters and highlight the algorithmic aspects that may significantly affect the risk exposure of an insurance contract. Our first objective is to provide a baseline optimization framework to quantify the risk exposure of the insurance contract given a price range. First, we present a baseline nominal formulation for the problem based on the expected severity and frequency of the claims. Subsequently, we show how it can be extended to account for uncertainty in loss scenarios using robust optimization.
Our framework estimates risk exposure using tools from the finance literature. We resort to two well-established statistical techniques used to measure the level of financial risk within a firm or an investment portfolio over a specific time frame; the Value-at-Risk (VaR) and the Conditional-Value-at-Risk (CVaR). VaR answers the question of what is the maximum loss with a specified confidence level (Jorion 2000). CVaR is the expected loss if that confidence level is ever crossed. VaR is a widely accepted and used measure, but it is not coherent as it violates the subadditivity property of coherent measures (Artzner et al. 1999). VaR is neither convex nor smooth, and it may result in multiple local extrema (Rockafellar and Uryasev 2000). As a result, optimizing this measure under different constraints is quite complex. For this reason, we focus on CVaR, which is a coherent and convex risk measure and can be optimized using linear optimization (Uryasev 2000, Artzner et al. 1999).
We consider premium categories, corresponding to the different classes of claims that we insure. For example, referring to the medical malpractice problem, we could classify the patients into three age groups , in which case . We assume that the determination of the insurance premium is a function of how much risk the organization or the modeler is willing to assume. Let be a loss function that takes as input a decision vector of premiums and a random vector of losses . The decision vector belongs to a feasible set of prices . The random vector of losses is realized in practice. The loss function is equal to the difference between the price and the future loss in case there is a claim above the premium:
| (1) |
We do not consider cases of loss in which the resulting claim had a lower value than the premium. Uryasev (2000) proposed a framework for the simultaneous calculation of VaR and CVaR as well as the determination of the associated premium based on the distribution of the losses (see Section 10 for an overview). In practice, we do not have the analytical representation of the density function of to estimate the probability that the loss function does not exceed a threshold value . However, using past observations of claims, we have access to historic scenarios with , sampled from the density . These scenarios are empirical realizations of the true distribution . Thus, the following CVaR approximation was introduced:
| (2) |
where is a given confidence level, is a constant calibrating the function by the number of scenarios and confidence level , and is the variable that represents VaR. If is convex w.r.t. to , then is a convex non-smooth function w.r.t. to . Thus, linear optimization can be used to solve the minimum value of CVaR. Several studies have shown that this approach provides a very powerful, fast, and numerically stable technique that can solve problems with a large number of variables and past scenarios (McNeil et al. 2015, Markowitz 2010, Bertsimas et al. 2004).
A Nominal Formulation for Algorithmic Insurance
We adjust the formulation introduced by Uryasev (2000) to the algorithmic insurance setting. The proposed framework is based on a linear optimization formulation that leverages data-driven historical scenarios of loss . The scenarios refer to past payment claims that were covered by the insurance provider. We present in the following sections a quantitative process to simulate scenarios for a given number of observations . The loss function is not linear since it is defined as . We restrict the price vector within a fixed upper bound () that reflects the pricing constraints of the insured party. We let represent the set of premium categories that are included in the contract. Our objective is to minimize the empirical CVaR given past scenarios of loss where , and an upper bound on the contract prices. Thus, each scenario refers to a past claim for a premium category . We set as the baseline the following formulation:
| (3) |
Notice that the constraint is always binding since the formulation aims at minimizing the loss. Thus, the formulation allows the insurer to estimate the risk exposure of the contract for a given price . We can solve Equation (3) by linearizing the constraints, which results in:
| (4) |
A Robust Optimization Extension
Solutions to optimization problems can exhibit high sensitivity to perturbations in the problem parameters (Ben-Tal and Nemirovski 2000). In the setting of algorithmic insurance, uncertainty lies at the center of the problem, gaining even higher significance. In the absence of real-world past scenarios , we propose a data-driven way to generate them in Sections 5-7, combining the model properties with historical claims of past cases based on human decisions. Undoubtedly, the presented modeling approach contains noise in the proposed scenarios , which can be attributed either to the probabilistic assumptions or to the model performance. Robust optimization offers a solution to this problem proposing uncertainty models that are not stochastic but rather deterministic and set-based.
We will apply the notion of -Robustness proposed by (Bertsimas and Sim 2004). We assume that the scenarios lie in the uncertainty set:
| (5) |
The uncertainty set defines the limits of uncertainty in the magnitude of the losses for a given scenario. The goal of the robust optimization approach is to provide a risk evaluation that will address any possible uncertainty lying within the set and protect the insurer even for worst-case scenarios of loss. controls the degree of conservatism of the set while and determine the potential range of losses for each price category and scenario. Bertsimas and Thiele (2006) provide for further intuition behind this type of uncertainty set. Incorporating the uncertainty in our original formulation and utilizing robust optimization techniques, enable us to obtain the following formulation:
| (6) |
We refer the reader to Section 11 and the work of Bertsimas and den Hertog (2021) for the detailed derivation of the robust counterpart from the nominal problem. Note that this is a well-established type of uncertainty for such formulations. Our goal with this extension is to showcase in an example how robust optimization techniques can address considerations regarding loss uncertainty in the context of algorithmic insurance.
5 The Effect of Predictive Performance
The optimization formulations in Section 4 are based on historical scenarios of loss . In this section, our goal is to derive these scenarios of loss in the absence of historical claims based on the predictive performance of a ML model. To achieve this objective, we propose a data-driven approach that leverages available information regarding both the frequency and severity of liability claims. We argue that the claim frequency of an erroneous algorithmic decision is a function of the model’s predictive performance (e.g., AUC). The expected claims cost (severity), though, will depend on the nature of the decision and the type of error.
Going back to the case study, suppose that a pathologist receives FNA samples from which, using their knowledge and experience, determines whether a patient has a malignant breast tumor or not. Depending on the doctor’s response, the patient will or will not follow cancer treatment. In the case the physician proposes an erroneous diagnosis, there is an associated cost with this decision:
-
•
If the patient is diagnosed with cancer but does not actually have it, there is the toll of unnecessary treatment that may even result in a needless mastectomy. We will assume that this cost is captured by a random variable with mean and variance .
-
•
If the patient is not diagnosed with cancer but actually has the disease, the severity of the outcome for the patient is likely increased since it is known that early detection is critical in cancer patients. This increase in severity is associated with a higher litigation cost, which is captured by a random variable with mean and variance .
Suppose now that instead of a doctor, a ML model is taking up the task of deciding, based on the FNA samples, whether the patient has cancer or not. Note that this example is not far from reality; in fact, Massachusetts General Hospital’s radiology department has deployed a ML model that is partially responsible for the screening process of patients that receive a mammogram (Yala et al. 2019). Typically, the output of such binary classification algorithms is a prediction score. The model assigns to each input observation an individual risk score that indicates how likely it is for each sample to be associated with the outcome of interest (e.g., cancer diagnosis). To map each observation to a crisp class label, a classification threshold must be defined. For example, if the pathology department has specified a classification threshold , then all patients whose FNA outcome has a probability of being positive are diagnosed with breast cancer. In the same example, all samples for which the model predicts a score of are classified as cancer-free.
Depending on the value of this threshold , the ability of the algorithm to identify false positives and false negative cases varies. Higher values of improve the specificity of the model, avoiding unnecessary alerts to healthy patients. On the other hand, lower values of improve the sensitivity of the model, resulting in the timely warning of a higher number of cancer cases. Both measures are threshold-dependent. Thus, we can formally define them as follows:
-
•
Let be the specificity of the ML model for a classification threshold . The probability that a sick patient will be erroneously classified is then .
-
•
Let be the sensitivity of the ML model for a classification threshold . Thus, the probability that a healthy patient will be wrongly classified is .
Taking all the above into consideration, the claim cost of a new patient that is diagnosed by the ML model is captured by the random variable :
| (7) |
Therefore, the expected value of the individual claim cost is equal to:
| (8) |
The corresponding variance is , where is the correlation parameter between the random variables . If we assume that patients are expected to arrive at the hospital during the contract period, then the total expected loss of the insurance is:
| (9) |
Case Study: Experimental Setup
We perform a series of computational experiments in the case study of interest. The goal is to evaluate the effect of the model parameters on the risk appreciation framework. We fix the number of scenarios to and assume that patients are served within the contract period. We hypothesized that the litigation cost variables follow independent normal distributions. In this setting, we do not distinguish between different price segments, assuming that . We vary the values of between the lower and upper ranges obtained from historic medical malpractice cases of breast cancer such as the ones presented in Section 3. We study the impact of the classification threshold as well as the confidence level . We constrain the contract premium to $10,000 and $50,000. We quantify the effect of the parameter in the robust optimization formulation. We use bootstrapping across 10 random seeds. We report the average performance across all iterations. The parameter ranges are detailed in Table 2 in the Appendix.
Case Study: The Implementation Framework
The proposed formulation enables decision-makers to estimate for a given confidence level () and a vector of historic claims (): (i) the prices () for each product class (i.e., age groups, vehicle types); (ii) the VaR (); (iii) the CVaR which corresponds to the objective function ().
The input necessary to apply it involves:
-
•
A binary classification model (e.g., image recognition classifier for mammograms) with representative training and testing sets;
-
•
Random variables that represent the litigation cost for false negative and false positive cases with means , variances , and covariance Cov respectively;
-
•
The number of patients that the algorithm will serve during the contract, ;
-
•
The number of past scenarios for the optimization formulation, ;
-
•
Upper bounds for the price, .
If past data from the implemented algorithm with prior cases of litigation claims were available, we would use the historical observations. In the absence of such information, we use random variable realizations to get the cost approximation of false positive and negative cases. This is a valid assumption since the amount of a liability claim is determined based on the damage caused and not who was responsible for it (Danzon 2000). Generally, the total cost for scenario of a fixed contract period for price segment can be computed as follows:
| (10) |
However, since in our case , the equation is simplified to:
| (11) |
The proposed process that combines all the components of our approach is summarized in Algorithm 1 in Section 12.
Case Study: The Effect of the Classification Threshold
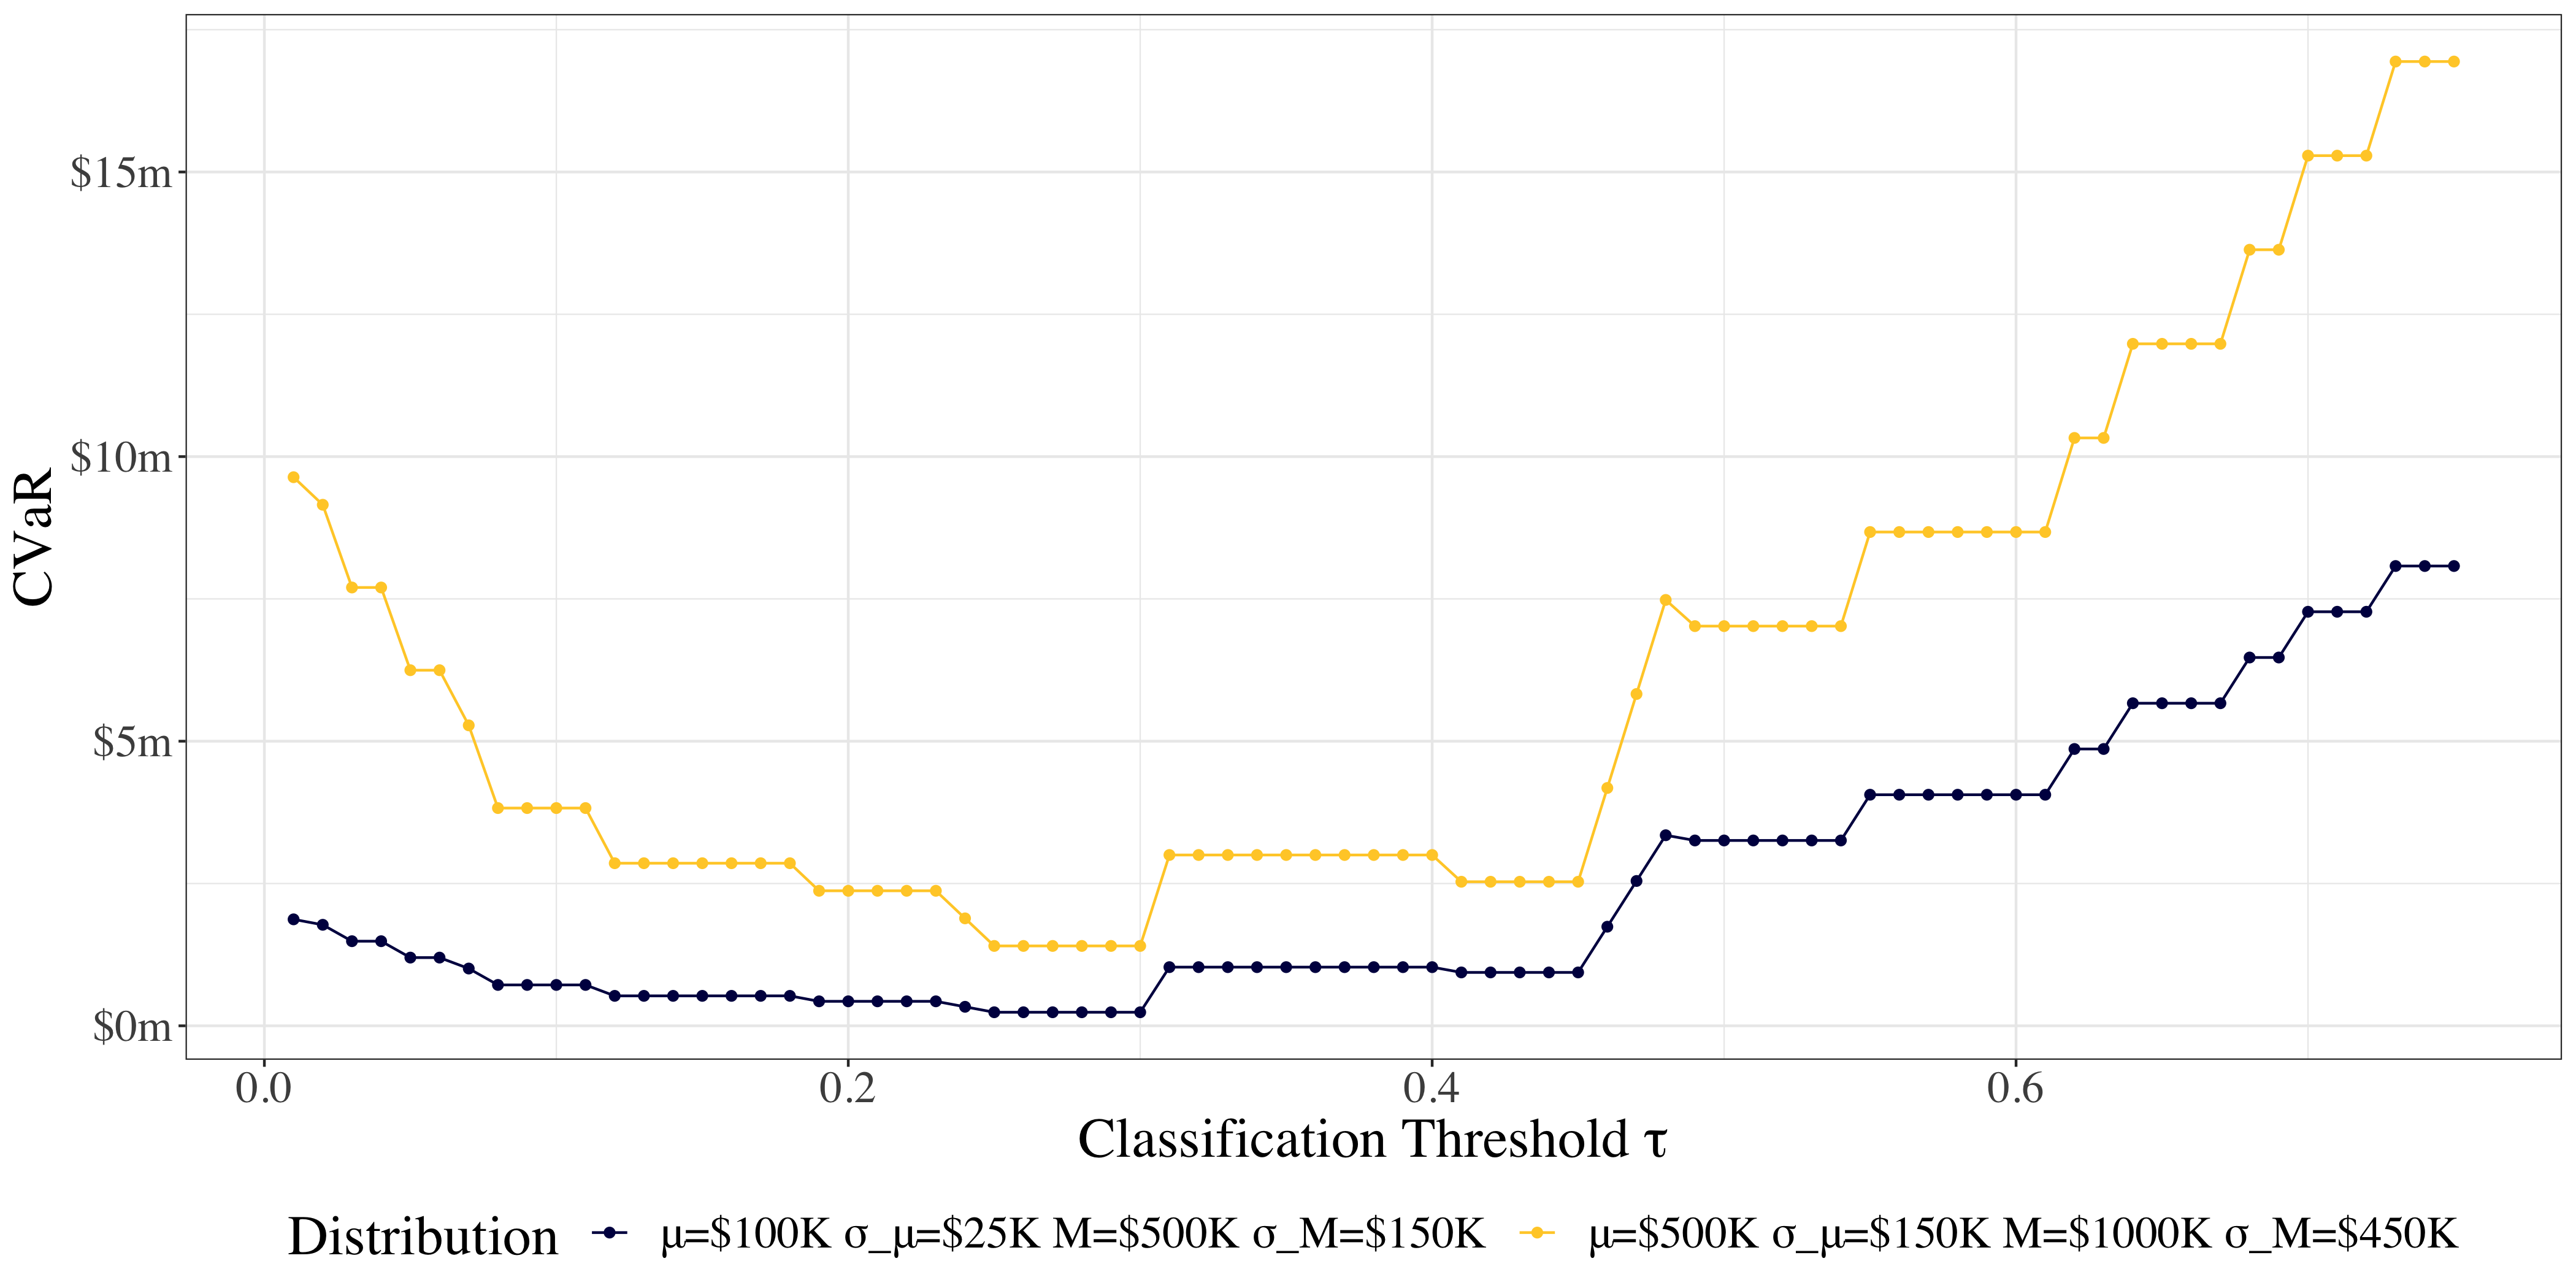
The first question we aim to answer is the effect of the classification threshold on the estimated CVaR of the contract. In Figure 1, we depict the CVaR for two litigation claims’ distributions as a function of the classification threshold . The blue curve corresponds to a low-cost scenario and the yellow curve represents a high-cost scenario. We select each distribution’s mean and standard deviation based on historical records from the literature (Lee et al. 2020). The blue curve corresponds to . The yellow curve corresponds to . On the horizontal axis we project the threshold values and on the vertical axis the CVaR. The findings of this analysis reveal that the most significant determinant of CVaR is the selected classification threshold . The expected costs for the false positive and false negative case re-scale the CVaR function. Moreover, the effect of is more prominent for lower values of that negatively impact the model’s specificity. On the contrary, gains more significance for higher values of . The average AUC of the binary classification models is and thus for any given threshold, the probability of a false negative and a false positive is very low. Notice that the CVaR of both curves in Figure 1 is minimized for . This is due to the fact that when , the model sensitivity on the testing set is equal to one. Therefore, for the model specificity is maximized for the best possible value of sensitivity. This analysis demonstrates that the selected classification threshold can dramatically affect the CVaR value even for fixed distributions of litigation costs. In the presence of algorithmic liability, we show that the choice of threshold can have substantial financial implications for the organization.


when .

when .
These findings can extend beyond the context of healthcare. For example, in the context of autonomous vehicles, the goal of the classifier could be to predict whether a car has to stop at a given point. The choice of would be based on the relative risks between a false continuation or pause of the vehicle’s movement. Thus, in settings where false negative errors are associated with more expensive claims (like the case study), the model favors low values of and vice versa. Essentially, captures the trade-offs between type I and type II errors for the application of interest.
| Premium | Formulation | |||
|---|---|---|---|---|
| $ 10,000 | robust | $ 300,536 | $ 302,959 | $ 306,714 |
| $ 10,000 | nominal | $ 276,117 | $ 278,071 | $ 281,631 |
| $ 50,000 | robust | $ 260,536 | $ 262,959 | $ 266,714 |
| $ 50,000 | nominal | $ 236,117 | $ 238,071 | $ 241,631 |
Case Study: The Effect of the Claims Cost Expected Value
The next question that we address relates to quantifying the impact of the means of the random variables on the contract’s risk exposure. Figure 2 provides three-dimensional and two-dimensional illustrations of CVaR as we vary the expected values and for . In these experiments, and correspond to 20% of and respectively. Figure 2(a) shows CVaR as a function of both and . When , the model does not include any litigation cost for false negative claims, and CVaR is a linear function of the model specificity. This is evident in Figures 2(b)-2(c) too. For a fixed value of , any increase or decrease of does not affect the contract’s financial risk. On the other hand, as illustrated in Figures 2(b)-2(c), when both model sensitivity and specificity affect the exposed risk of the contract in a linear fashion. In this case, CVaR depends on the distribution of both and , and thus it is a linear function of and . As we decrease the value of below 0.3, the probability of a false positive claim is increasing and as a result, CVaR is also increasing. For example, when the model specificity is 97.24%, while when the specificity drops to 94.49%. These results highlight that CVaR is a linear function of both and .
Case Study: The Effect of Robust Optimization, the Premium, and the Confidence Level
Subsequently, we investigate the role of the premium, the type of formulation, and the confidence level in the determination of CVaR. We summarize our findings in Table 1. The premium value is set by the upper bound . Naturally, higher premium values result to lower VaR and CVaR for the contract. The parameter also has a linear effect on the final risk estimation as it is incorporated as a scalar in the objective function of the formulation. In addition, the results in Table 1 reveal the benefit of the robust optimization approach. As we expected, the latter yields very similar results to the nominal problem while also accounting for uncertainty in the scenarios .
6 The Effect of Interpretability
In the effort to price the risk of algorithmic decision-making, transparency may play a crucial role. In this section, we incorporate the degree of a ML model’s interpretability in the proposed pricing framework. We outline a class of functions that capture the impact of transparency on algorithmic risk evaluation and showcase a practical application in the case study of medical liability.
Consequential decision-making up until recently has been strictly controlled by humans. In this setting, the outcome of any decision can be associated with the reasoning that would justify the action. Thus, a human decision can be evaluated based on the logic followed and, subsequently, the decision agent can be held accountable for their judgment. Supervised learning algorithms do not necessarily provide a reason why a given observation should receive a specific label. They can only state that certain inputs are correlated with that label. As a result, interpretability has remained an ill-defined term of ML (Lipton 2018).
In the context of algorithmic liability, one could argue that the transparency of a model is a measure of how much human input could be involved in the risk estimation process. We will focus on the setting of complete automation where human input is possible only prior to the model implementation in practice. In this context, experts may be called to review and approve the algorithm prior to its integration to avoid erroneous decision rules in the learner. Consider the case of a fully interpretable, tree-based model for malignant tumor detection. The physician in charge can easily review the algorithm’s recommendations based on their own knowledge and experience prior to its implementation. The level of algorithmic transparency directly affects the degree to which human judgment can be involved. Interpretable models allow for synergies between the ML algorithm and the experts’ input. Therefore, we argue that the combination of artificial and human intelligence is likely to lead to more accurate estimations and may improve the risk exposure of the contract (Ibrahim et al. 2021).
Our goal is to quantify this effect and measure how synergies between a human and an ML model can impact algorithmic risk evaluation. Suppose that is the risk exposure for an insurance contract when a human expert is making all the decisions. Notice that is known from historical claims and is fixed. is the risk exposure for the same contract when a ML model is the sole decision-maker and is variable depending on the algorithm. We assume that to ensure that there are financial incentives from the use of the ML model. We let be the interpretability parameter that measures the degree of algorithmic transparency or human input and assume that a model’s risk exposure is a function of the transparency parameter.
When , the ML model is treated as a “black box” and thus a human agent is unable to provide additional input that may improve the model’s performance (). On the contrary, when , the model is intuitive and explainable for the decision-maker. As a result, there are synergies between the ML model and the human agent, resulting in a lower cost , .

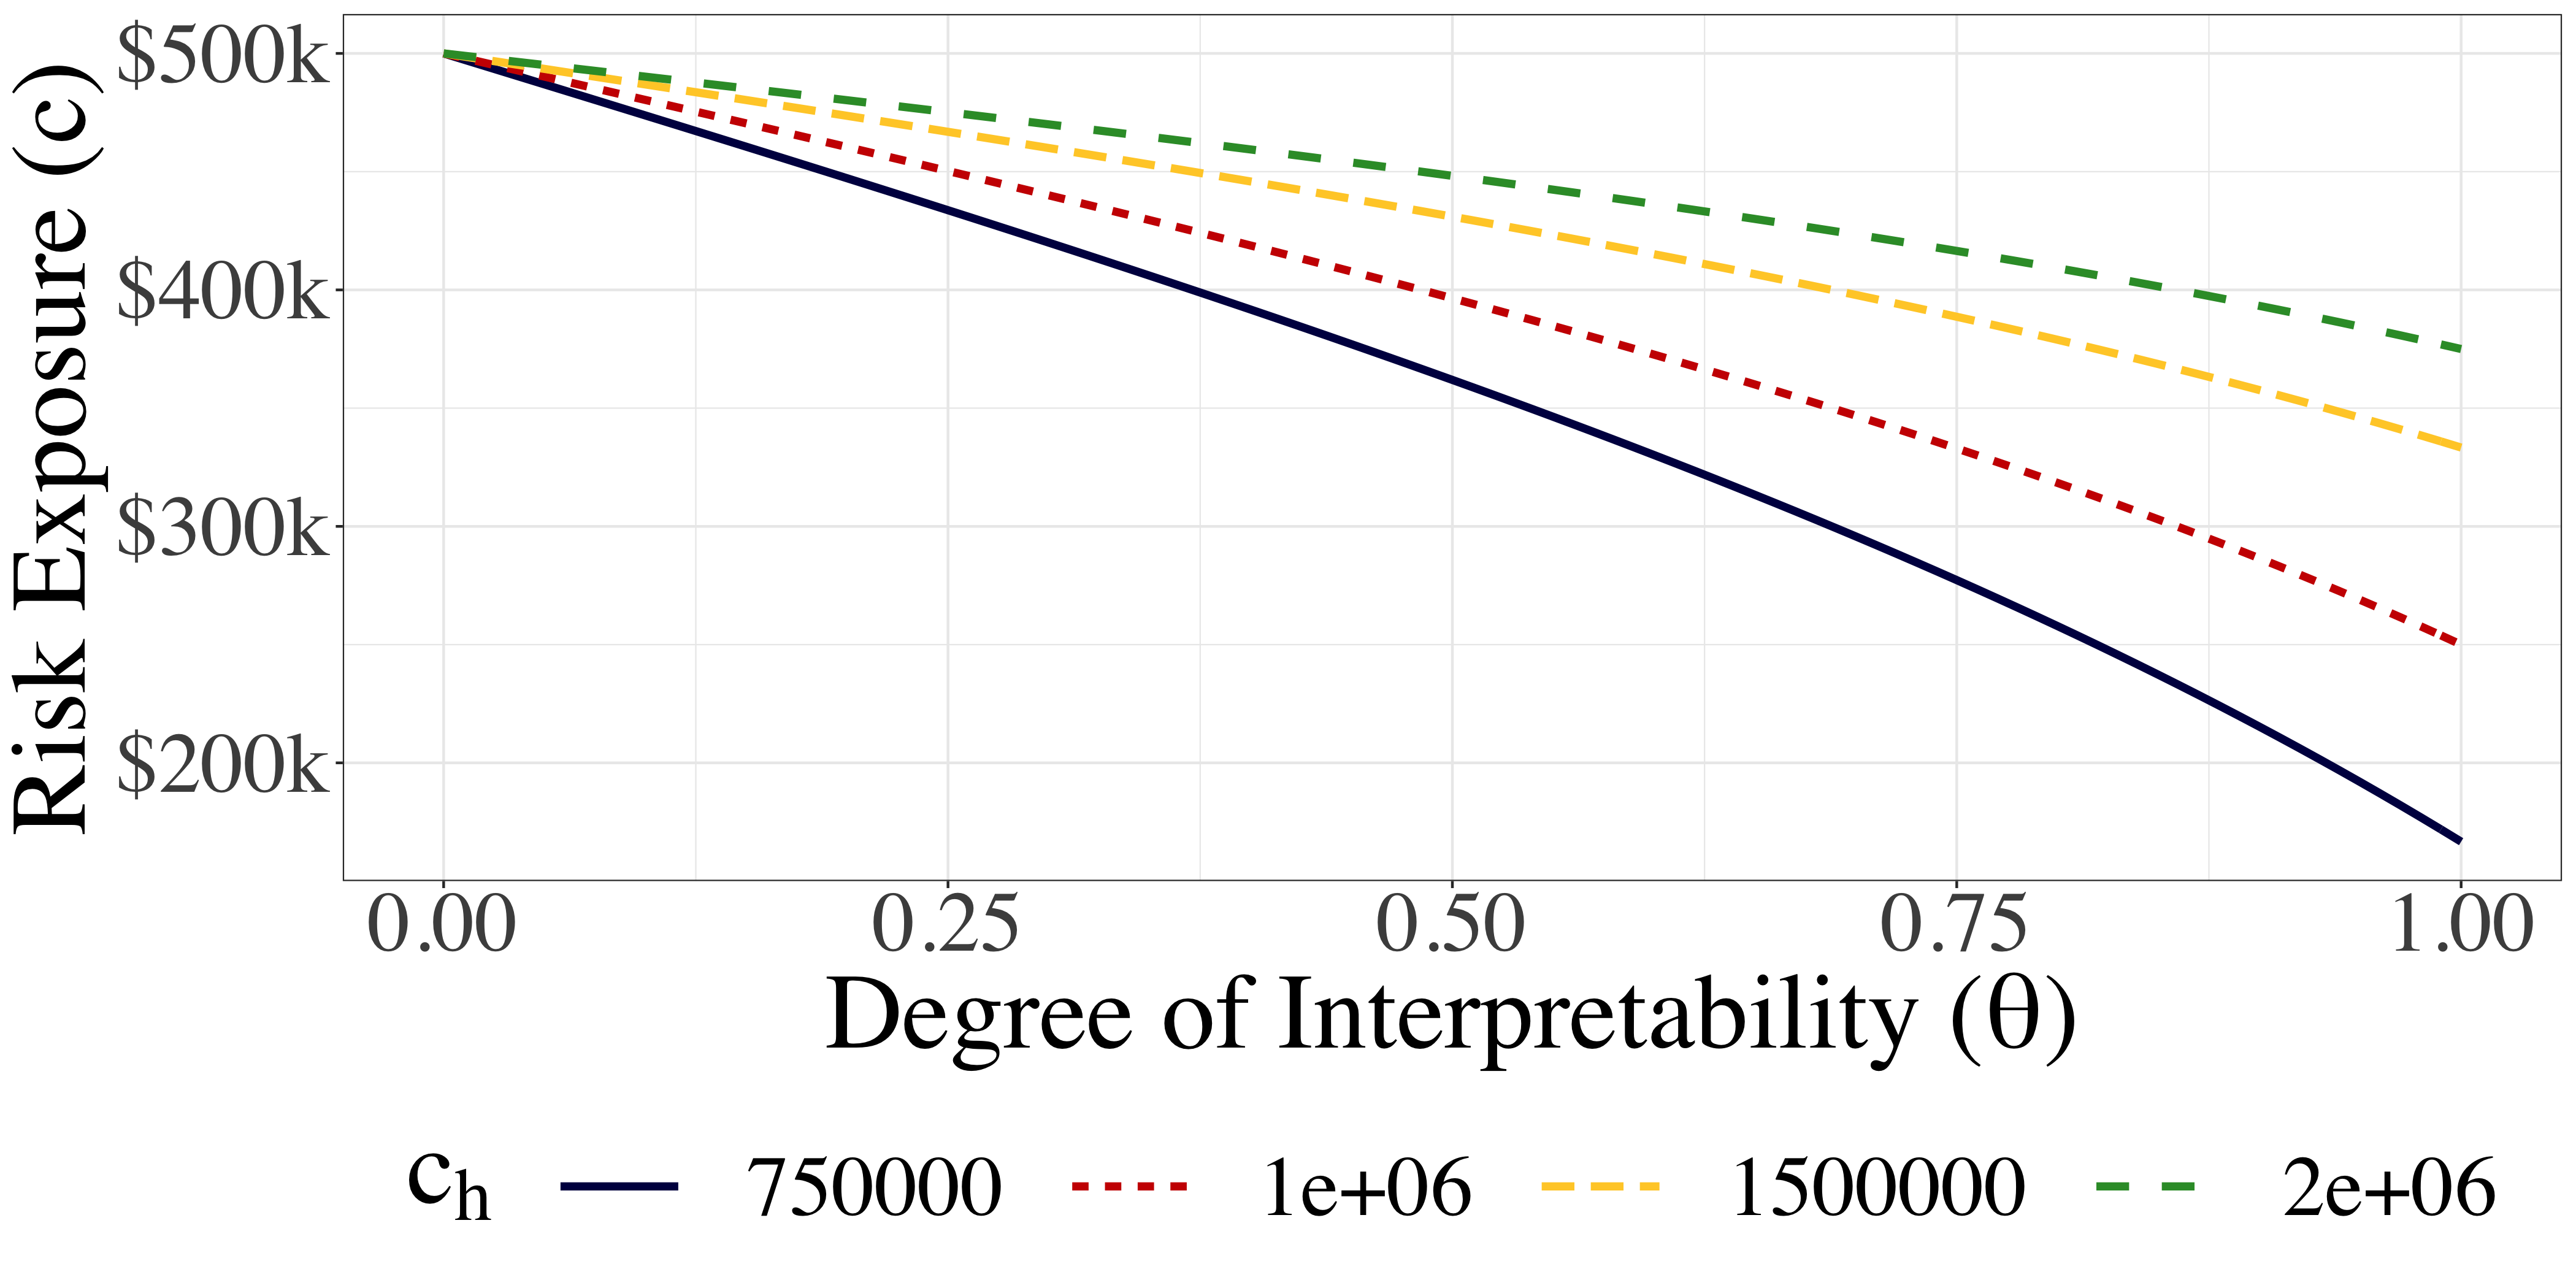
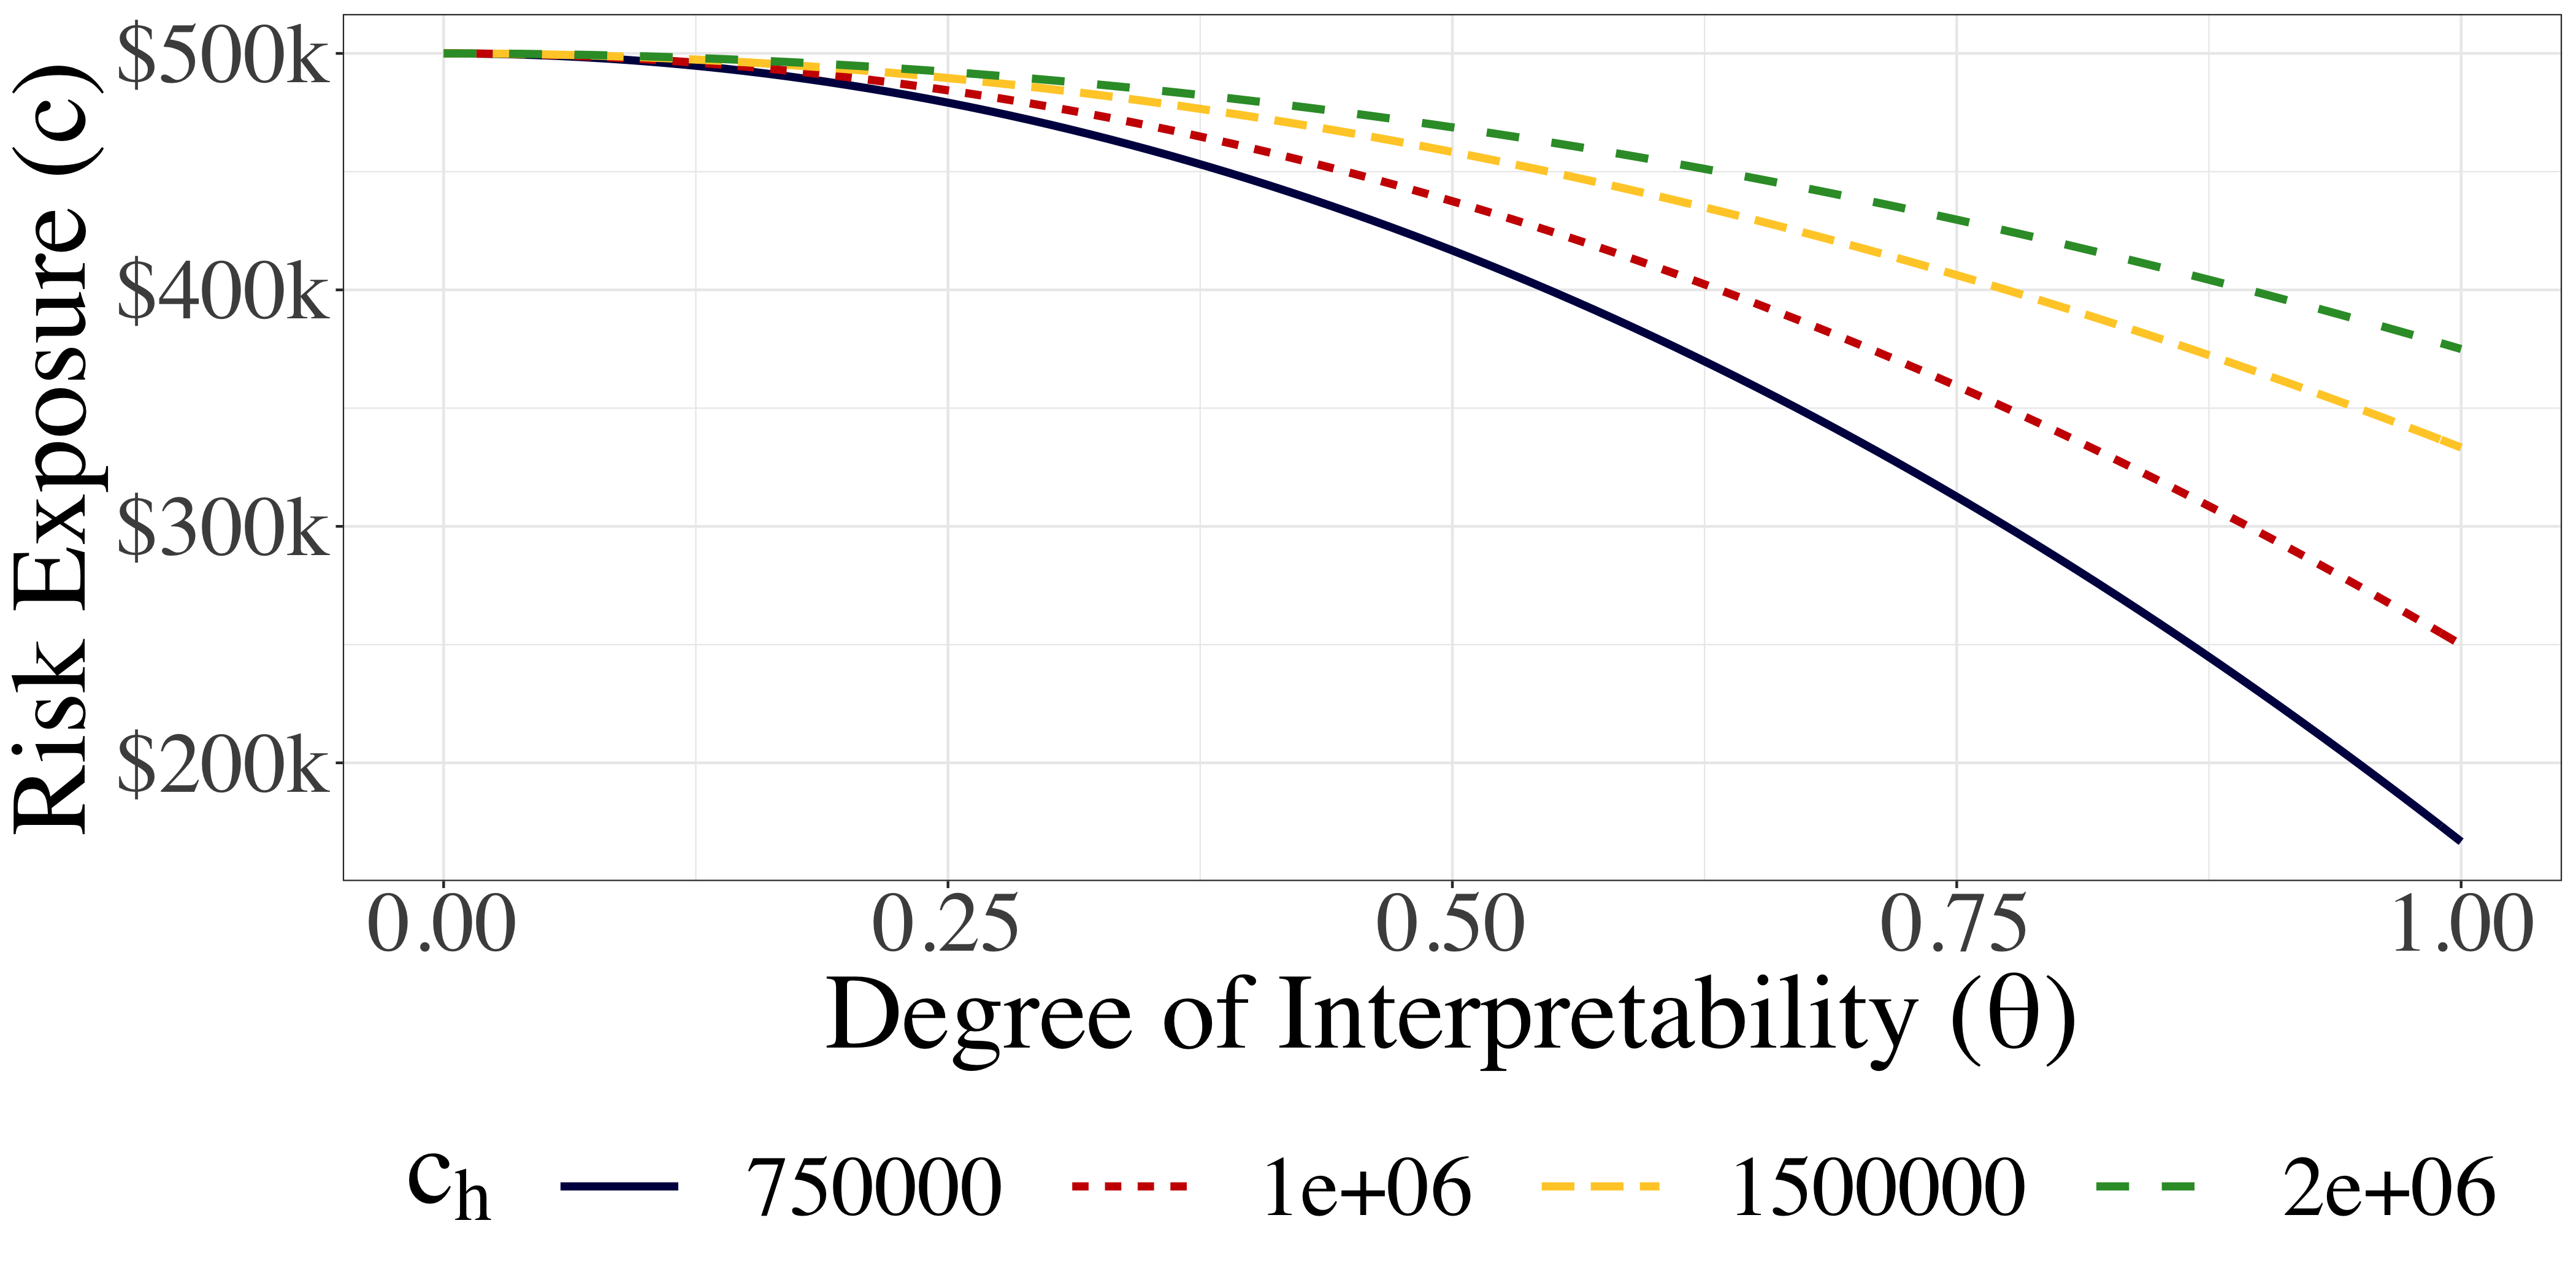
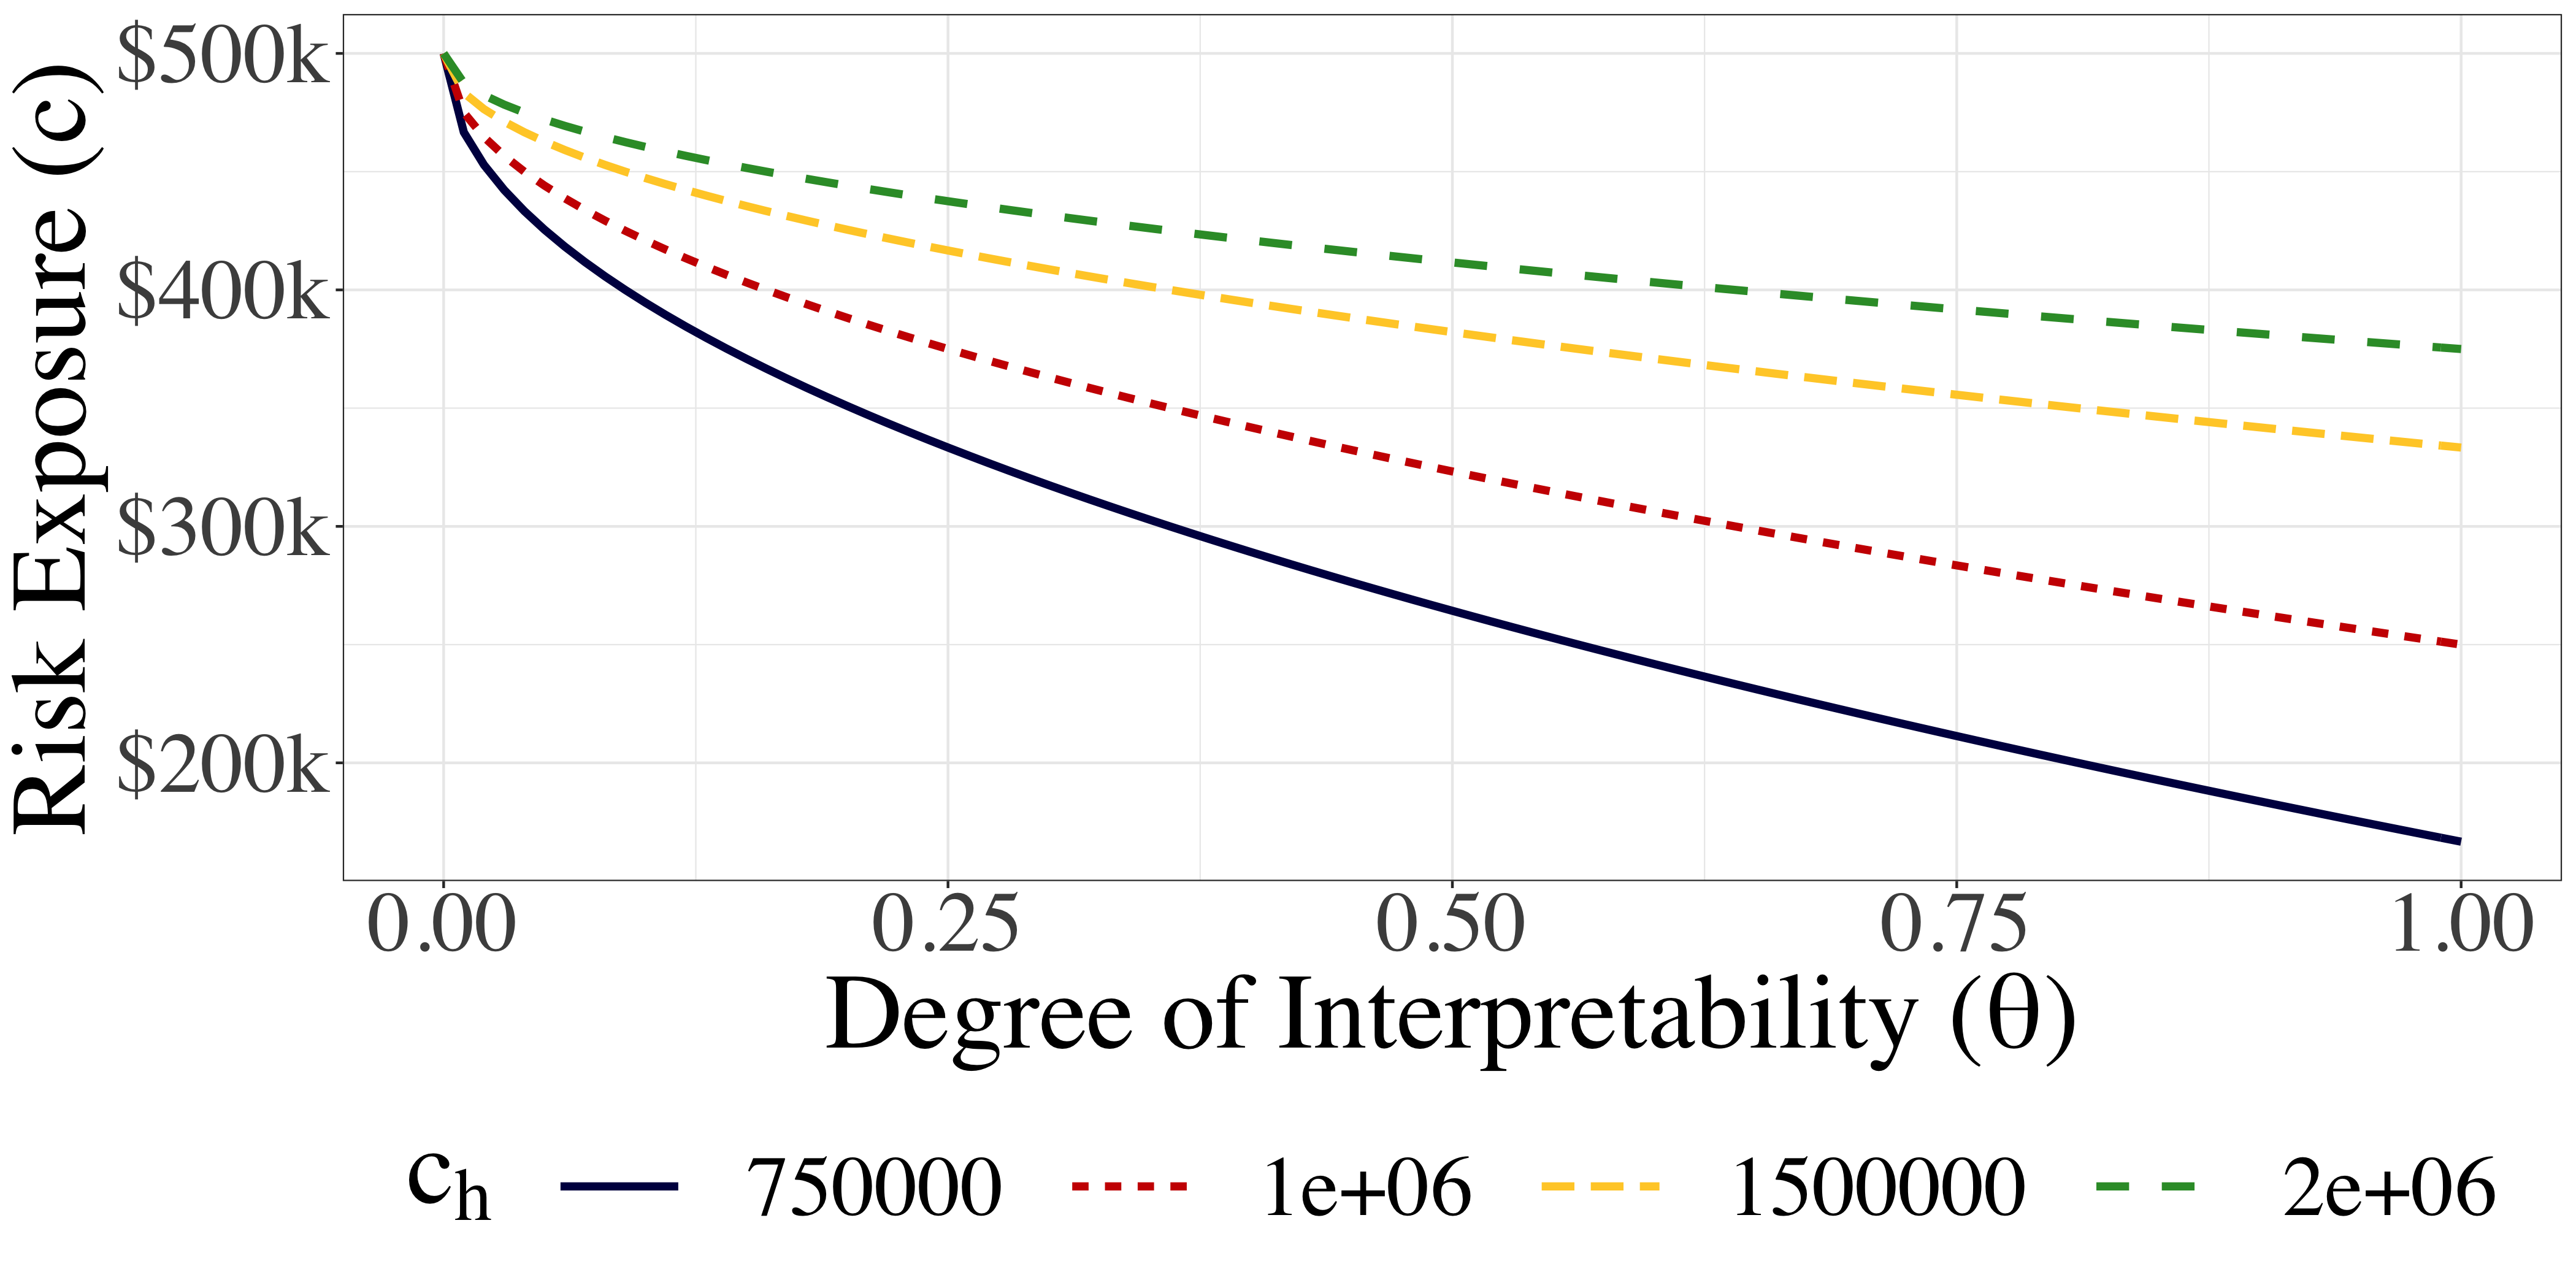
The determination of the parameter depends on the ML model, the application, and the problem under consideration. We assume that the relative benefit of interpretability directly depends on the relative ratio of . The latter ratio captures the relative improvement of a ML model over human judgment in economic terms. In cases where the edge of algorithmic decision-making is small , the value of transparency is high, since an expert’s opinion can yield equivalent results to an algorithm. In this setting, the synergies between the decision-maker and the machine are stronger, correspondingly decreasing the expected risk exposure. On the other hand, when is significantly higher than , transparency gains less importance as human input might not be as informative. Based on these assumptions, a potential value for is , capturing the synergies between the two types of decision-makers. It follows that when , the cost is equal to . If we model the contractual risk exposure for all values of as the linear interpolation of these two scenarios (see Figure 3), then
However, interpretability does not necessarily have a linear effect on risk exposure and model performance. One can hypothesize that the effect of interpretability on the cost is non-linear. If is a concave function, the positive effect of interpretability on the risk exposure is more prominent for higher values of . On the contrary, if we assume that is convex, even with small degrees of interpretability, we can observe significant reductions in the expected risk. Though it remains challenging to fully characterize the interpretability effect, our approach provides flexible options to decision-makers to measure its impact as a function of the parameter.


Identifying a single value for this parameter and determining a specific definition or degree of interpretability has been a major challenge in the ML field (Carvalho et al. 2019). Most definitions involve human input in the evaluation process which impedes systematic quantitative analysis (Lipton 2016). Bertsimas et al. (2019) have recently introduced a quantitative approach to specify the price of interpretability as the tradeoff with predictive accuracy for a given model. Alternative approaches that could be directly incorporated into the pricing framework include the work of Schmidt and Biessmann (2019) and Ribeiro et al. (2016). We expect that an increasing number of interpretability definitions will be available in the future considering the importance of understanding a model’s proposed associations between the input variables and the output labels.
Case Study: The Effect of Transparency
In Figure 4, we provide concrete examples of functions that model the effect of interpretability in the risk estimation process for the case study of medical liability. On the horizontal axis, we project the parameter and on the vertical axis the CVaR. Each graph corresponds to a different function , including concave, convex, and linear examples. In this setting, we assume that , , and consider four distinct scenarios of . Notice when is convex, such as in Figures 4(b) and 4(d), even with low degrees of interpretability, we can derive effective synergies between the model and the human agent that can significantly reduce the risk exposure. Respectively, when modeling the effect of interpretability with a concave function, like the ones presented in Figures 4(a),4(c), the majority of the risk reductions will only be observed for higher values of . This intuition can guide the determination of the interpretability function in future applications of the framework.
7 The Effect of Model Generalizability
In this section, the goal is to quantify the effect of algorithmic generalizability on the pricing framework. We propose the generation of synthetic data based on the case study data using GANs to measure the impact on the performance of the ML model and apply our approach to the case study of interest.
Generalizability refers to a model’s ability to properly adapt to new, previously unseen data, drawn from the same or a different distribution as the one used to create the model. In the context of algorithmic insurance, generalizability becomes pertinent when the model is applied to a new population whose data have not been tested by the algorithm in the past. Going back to the case study of interest, let the binary classification model for malignant tumor detection be primarily trained on samples with a family history of breast cancer at an academic hospital in Massachusetts. Suppose that a community hospital from a different state that involves patients with and without a family history of breast cancer is now interested to integrate the system into its electronic health records database which started collecting medical data only one year ago. What is the appropriate pricing strategy for this center? If the hospital had at its disposal data from the patient population it serves throughout a span of multiple years, we would directly be able to validate its performance externally. However, in the absence of this valuable resource, an alternative approach is needed to adjust the pricing strategy of the contract.
We propose testing the predictive performance of the algorithm on synthetic observations that resemble the original training set, controlling the degree of similarity to get estimations of risk variability. While the robust optimization approach addresses the uncertainty in the magnitude of the losses for erroneous decisions, in this section, we focus on differences in the testing population’s distribution. Our goal is to quantify the impact of changes in the data characteristics on algorithmic performance and ultimately litigation risk. To answer this question, we propose a mechanism to create new data under different distributions while controlling the degree of similarity with the original population. Multiple approaches have been proposed in the literature to address this problem. A common approach is to induce noise with Gaussian random variables in the existing dataset. Nevertheless, this simple technique directly affects the existing correlations and associates between the covariates distorting the true geometry of the feature space. Another well-established technique for data augmentation is referred to as the Synthetic Minority Oversampling Technique (SMOTE) which is very frequently applied in classification datasets that have a severe class imbalance (Chawla et al. 2002). However, this approach does not let the user directly control the degree of similarity between the newly created instances and the original data distribution.
The proposed framework requires the use of parameters that effectively control the degree of similarity between the real and the synthetic data. Our objective is to introduce a mechanism that would allow decision-makers to quantitatively compare the additional cost of the insurance contract with respect to the ability of the model to generalize to datasets with different levels of variability from the original training and testing sets. Though it is not possible to provide theoretical guarantees about the predictive performance of a given classifier in a new unknown distribution, we can conduct extensive simulations that test the discrimination capability of the learner in adverse scenarios.
Generative Adversarial Networks to Generate Synthetic Data
To perform this analysis we resort to GANs. This neural network architecture was first introduced in 2014 with the goal of synthesizing artificial images that are indistinguishable from authentic figures (Goodfellow et al. 2014). Since then, GANs have become the predominant method of data augmentation for images and text (Wang et al. 2017). They are used to increase the amount of data by adding slightly modified copies of already existing samples or newly created synthetic data from existing observations (Radford et al. 2015, Goodfellow 2017, Zhang et al. 2017).
GANs involve a unique architecture in which a pair of networks are trained simultaneously and in competition with each other. Training a robust GAN architecture is a non-trivial task due to problems like vanishing gradients and mode-collapse which may result in poor discrimination performance and synthetic samples with limited diversity (Radford et al. 2015, Salimans et al. 2016). The Wasserstein GANs (WGAN) architecture was introduced to remedy these issues using the Wasserstein distance as the loss function (Arjovsky et al. 2017). The Conditional GAN (CGAN) is a specific class of GANs that involves the conditional generation of images by a generator model, resulting in new data observations with associated class labels (Mirza and Osindero 2014). This modification to the GAN architecture permits learning the distributions specific to each class label, producing samples for both labels with higher quality.
Recently, researchers showed that a combined Wasserstein Conditional GAN (WCGAN) can lead to very promising results in synthesizing tabular data, comprising only densely connected layers (McKeever and Singh Walia 2020, Somorjit and Verma 2020). These efforts highlighted the potential impact that GANs may have on structured data sources, providing researchers with higher flexibility and control in the data generation process. This technique also offers a promising alternative to solve the problem of interest; creating synthetic data while explicitly controlling the degree of similarity. By varying the number of epochs, we will control the differences in the distributions between the synthetic and the real-world data. This parameter constitutes the number of complete passes through the training process. A higher number of epochs gives the opportunity for the algorithm to converge, minimizing the loss function. Thus, we can directly compare the discriminator loss function to the number of epochs, adjusting the degree of dissimilarity between the synthetic samples and the real training set.
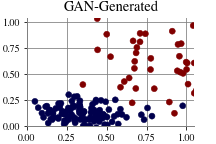
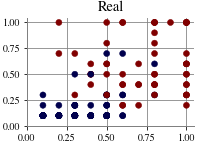
Due to their complicated structure and despite large strides in terms of theoretical progress, evaluating and comparing GANs remains a challenging task. While several metrics have been proposed, there is no consensus in the scientific community as to which measure provides a more holistic and objective model evaluation (Alqahtani et al. 2019, Borji 2019). We propose the use of the GAN quality index (GQI) for our analysis (Ye et al. 2018). To compute this metric, we will compare the performance of the generator and the model we are seeking to price . First, we generate the synthetic samples with the associated class labels using the GAN architecture. A second classifier, called the GAN-induced classifier , is trained on the generated data. The GQI is defined as the ratio of the accuracies (or AUCs) of the two classifiers when applied to the real test data:
Higher GQI means that the GAN distribution better matches the real data distribution.
Case Study: The Effect of Generalizability
We apply the proposed approach to the case study of medical liability using a GAN architecture. The goal is to investigate the effect of generalizability on the contract’s risk exposure using synthetic samples while controlling the degree of similarity to the original dataset. The GAN network was built leveraging the GAN-Sandbox package and was implemented in Python using the Keras library with a Tensorflow backend (Dietz 2017, Chollet et al. 2015, Abadi et al. 2016).
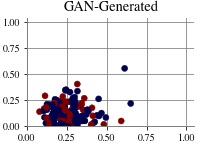
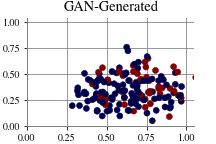
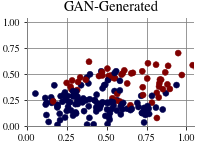
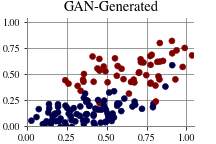
In Figure 5, we present the changes in the features’ distribution as a function of the number of epochs parameter in a WCGAN architecture. Following the architecture presented by Vega-Márquez et al. (2019), the GAN model comprises a generator network with one input layer and three dense layers and an adversarial network with one input layer and four dense layers. We measure the similarity of the derived distributions between the synthetic (GAN-Generated) and the real data for a different number of epochs in the training process. An epoch is defined as one cycle through the training process of the network, corresponding to the number of training iterations between the generator and the adversarial network. The hypothesis in Section 7 is validated, as we observe that a higher number of epochs results in feature distributions that better resemble the real data distribution (Figure 5). This effect is directly present in quantitative metrics, such as the GQI index, which is also positively correlated with the number of epochs in the model.
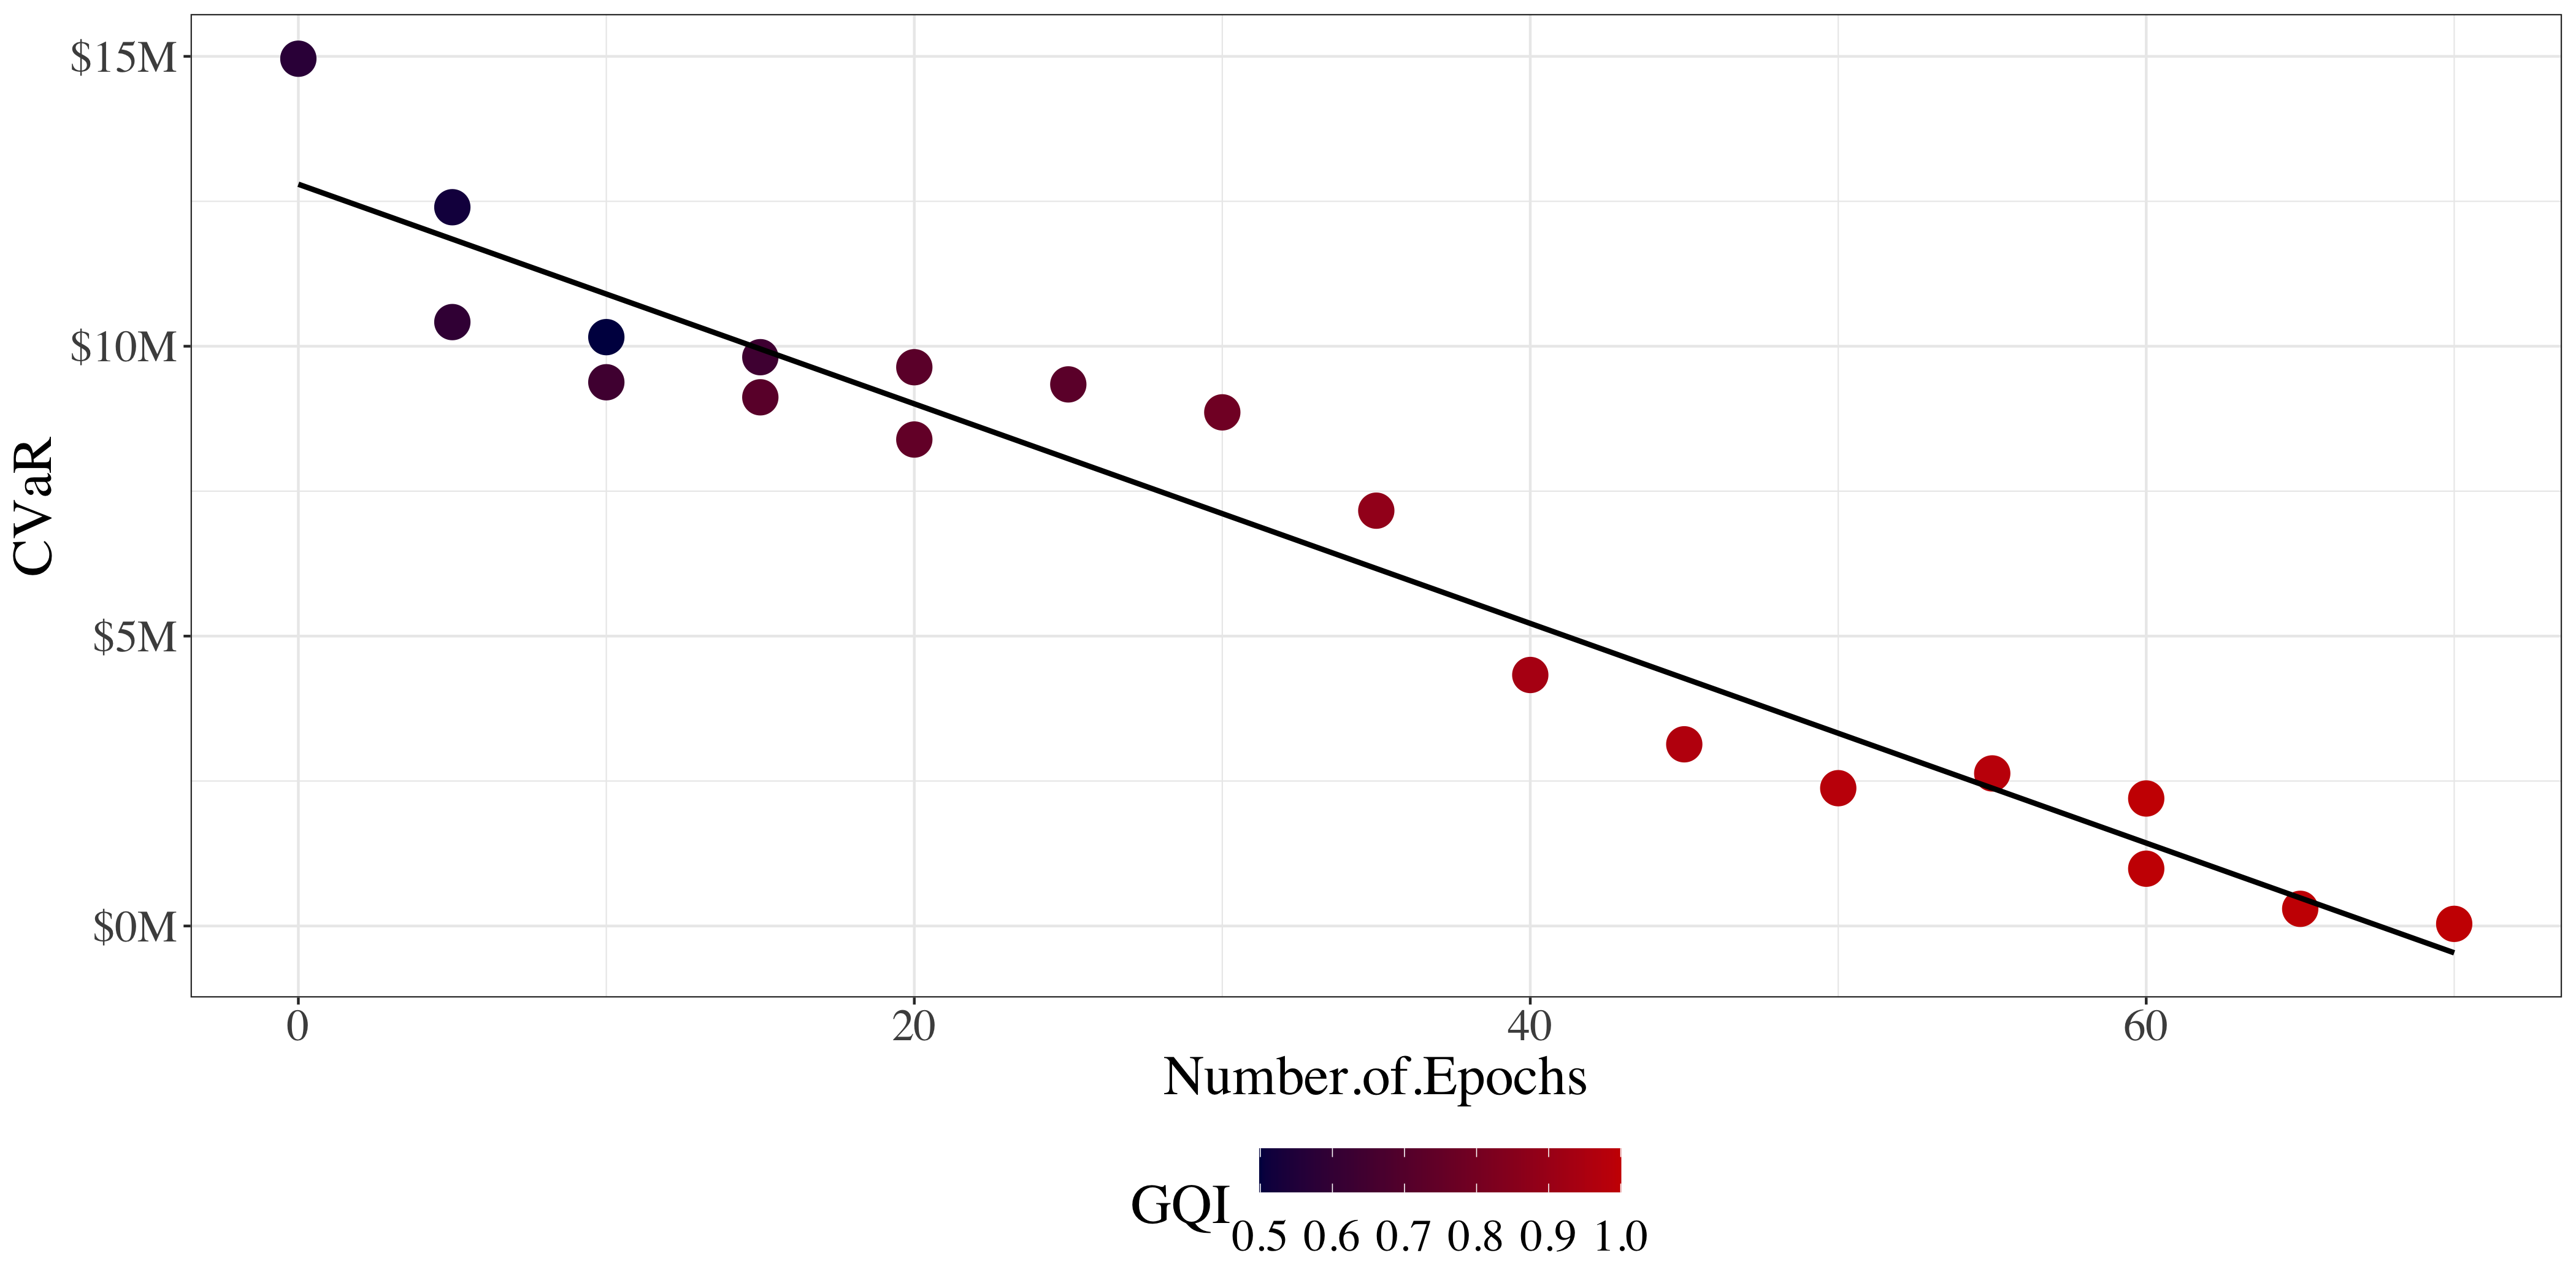
In Figure 6, we project CVaR as a function of the number of epochs parameter. The underlying binary classification model is the same as the one used in Figure 1 where , derived on the training sample of the original Breast Cancer Wisconsin Diagnostic dataset. The CVaR is then measured with respect to the discrimination performance of the classifier on the GAN-Generated synthetic data. The output of CGAN architectures includes both independent features and associated labels that are subsequently used to compute the sensitivity and specificity of the model for different values of . In Figure 6, we only project the best CVaR value across all potential thresholds . This graph reveals a linear relationship between the number of epochs and the CVaR. Even though these are empirical results, this finding highlights to decision-makers the cost effect of applying a pre-trained learner in datasets with varying degrees of distribution similarity to the original training population.
8 Discussion
In this paper, we introduce the field of algorithmic insurance, proposing a new class of insurance contracts that can protect ML providers and users from the financial and litigation risks of algorithmic mistakes. Our work motivates the need for algorithmic insurance and provides a data-driven framework for the associated risk estimation process. We consider three fundamental aspects of algorithmic performance that affect the adoption and implementation of ML models in practice: predictive accuracy, connection with human decision-makers, and generalizability to varying data distributions. To demonstrate the relevance of our methodology to real-world settings, we analyze and apply the proposed framework in a comprehensive case study in healthcare. With this work, we bridge the gap between theory and practice, providing decision-makers with a generic framework as well as an example that showcases how to derive actionable insights from it.
Algorithmic insurance can serve as a holistic mechanism to evaluate ML performance, taking into consideration the accuracy, transparency, and generalizability of a model. Our work provides evidence that each one of these properties can significantly influence algorithmic risk. First, we show that given fixed distributions of litigation costs, the choice of the classification threshold is the most important tuning parameter in the determination of risk. Its impact is a function of the underlying model’s AUC and the financial trade-offs between false positive and false negative errors. Secondly, we acknowledge that, in practice, algorithms are deployed in hybrid settings where humans and machines actively interact in the decision-making process. We model these interactions with a class of functions and show that their convexity indicates the required degree of interpretability to achieve significant synergies between human agents and algorithms. Thirdly, we enable decision-makers to adapt their risk estimations to settings where the classifier is applied to a new population that was not part of the original training and validation sets. Such settings are becoming increasingly more common for AI solution providers who do not have the option to test their models on client data prior to integration.
A central limitation of our approach is the absence of historic claims records from real-world litigation cases of algorithmic malpractice. However, given that insurance companies have in their possession this information from cases of human malpractice, we assume that the scenarios could be directly constructed from them. Our analysis takes a conservative view of the litigation process assuming that every erroneously classified sample will resort to a litigation claim. In reality, only a portion of misdiagnosed patients file a malpractice lawsuit and only a subset of those are successful.
The case study presented throughout the manuscript illustrates the pertinence of algorithmic insurance in the context of critical decision-making, where both type I and type II errors can have significant implications for the stakeholders involved. We selected this application area to illustrate the potential effect of the model parameters in a high-risk setting, magnifying the trade-offs that decision-makers are called to balance during an algorithm’s implementation. However, we recognize that medical malpractice is a particularly challenging field and the deployment of ML models in clinical settings faces a lot of additional regulation constraints. Nevertheless, the strength of the proposed framework lies in its agnostic nature to the type of learner and application area. It is relevant to any kind of binary classification problem where prediction errors may result in monetary compensation for the involved user. The first industry contracts of algorithmic insurance already cover a diverse set of areas, including credit card fraud prevention, battery health prediction, road-risk assessment, and predictive maintenance (MunichRe 2022). We provide the first comprehensive mathematical framework to estimate the risk and price of such contracts. Future work could focus on extending our approach to reinforcement learning and regression problems which are necessary to provide robust insurance contracts for more complex application areas, such as autonomous vehicles.
9 Conclusions
Our work aims to set the foundations in the novel area of algorithmic insurance. We propose a comprehensive quantitative tool that allows decision-makers, modelers, and insurance companies to estimate the litigation risk of ML models. This approach considers the classifier’s predictive performance, accounting also for uncertainty in the data. In addition, we incorporate measures of interpretability and generalizability to provide a holistic appreciation of the model. We believe this framework can serve as the basis of a new research area that will expedite the adoption and implementation of ML models in practice.
We would like to thank Dr. Neeraj Sarna for his comments on the manuscript and his insights regarding the implementation of algorithmic insurance contracts in practice. The authors are also grateful to Prof. Matthias Holweg, Prof. Daniel Armanios, and Dr. Arshya Feizi for their thoughtful feedback on the manuscript. The authors thank Dr. Luca Marighetti for insightful discussions regarding algorithmic insurance.
References
- Abadi et al. (2016) Abadi M, Agarwal A, Barham P, Brevdo E, Chen Z, Citro C, Corrado GS, Davis A, Dean J, Devin M, et al. (2016) Tensorflow: Large-scale machine learning on heterogeneous distributed systems. arXiv preprint arXiv:1603.04467 .
- Alqahtani et al. (2019) Alqahtani H, Kavakli-Thorne M, Kumar G, SBSSTC F (2019) An analysis of evaluation metrics of gans. International Conference on Information Technology and Applications (ICITA).
- Anderson and Troxel (2005) Anderson RE, Troxel DB (2005) Breast cancer litigation. Medical Malpractice, 153–166 (Springer).
- Arjovsky et al. (2017) Arjovsky M, Chintala S, Bottou L (2017) Wasserstein generative adversarial networks. International Conference on Machine Learning, 214–223 (PMLR).
- Artzner et al. (1999) Artzner P, Delbaen F, Eber JM, Heath D (1999) Coherent measures of risk. Mathematical Finance 9(3):203–228.
- Baicker et al. (2007) Baicker K, Fisher ES, Chandra A (2007) Malpractice liability costs and the practice of medicine in the medicare program. Health Affairs 26(3):841–852.
- Ben-Tal and Nemirovski (2000) Ben-Tal A, Nemirovski A (2000) Robust solutions of linear programming problems contaminated with uncertain data. Mathematical Programming 88(3):411–424.
- Berry et al. (2005) Berry DA, Cronin KA, Plevritis SK, Fryback DG, Clarke L, Zelen M, Mandelblatt JS, Yakovlev AY, Habbema JDF, Feuer EJ (2005) Effect of screening and adjuvant therapy on mortality from breast cancer. New England Journal of Medicine 353(17):1784–1792.
- Bertolini (2013) Bertolini A (2013) Robots as products: the case for a realistic analysis of robotic applications and liability rules. Law, Innovation and Technology 5(2):214–247.
- Bertsimas et al. (2019) Bertsimas D, Delarue A, Jaillet P, Martin S (2019) The price of interpretability. arXiv preprint arXiv:1907.03419 .
- Bertsimas and den Hertog (2021) Bertsimas D, den Hertog D (2021) Robust and Adaptive Optimization (Dynamic Ideas LLC).
- Bertsimas and Dunn (2019) Bertsimas D, Dunn J (2019) Machine learning under a modern optimization lens (Dynamic Ideas LLC).
- Bertsimas et al. (2004) Bertsimas D, Lauprete GJ, Samarov A (2004) Shortfall as a risk measure: properties, optimization and applications. Journal of Economic Dynamics and Control 28(7):1353–1381.
- Bertsimas et al. (2021) Bertsimas D, Orfanoudaki A, Pawlowski C (2021) Imputation of clinical covariates in time series. Machine Learning 110(1):185–248.
- Bertsimas and Sim (2004) Bertsimas D, Sim M (2004) The price of robustness. Operations Research 52(1):35–53.
- Bertsimas and Thiele (2006) Bertsimas D, Thiele A (2006) Robust and data-driven optimization: modern decision making under uncertainty. Models, Methods, and Applications for Innovative Decision Making, 95–122 (INFORMS).
- Bezanson et al. (2017) Bezanson J, Edelman A, Karpinski S, Shah VB (2017) Julia: A fresh approach to numerical computing. SIAM review 59(1):65–98, URL https://doi.org/10.1137/141000671.
- Borji (2019) Borji A (2019) Pros and cons of gan evaluation measures. Computer Vision and Image Understanding 179:41–65.
- Breiman (2001) Breiman L (2001) Random forests. Machine Learning 45(1):5–32.
- Brynjolfsson and Mcafee (2017) Brynjolfsson E, Mcafee A (2017) Artificial intelligence, for real. Harvard Business Review 1:1–31.
- Burton et al. (2020) Burton JW, Stein MK, Jensen TB (2020) A systematic review of algorithm aversion in augmented decision making. Journal of Behavioral Decision Making 33(2):220–239.
- Carvalho et al. (2019) Carvalho DV, Pereira EM, Cardoso JS (2019) Machine learning interpretability: A survey on methods and metrics. Electronics 8(8):832.
- Čerka et al. (2015) Čerka P, Grigienė J, Sirbikytė G (2015) Liability for damages caused by artificial intelligence. Computer Law & Security Review 31(3):376–389.
- Char et al. (2018) Char DS, Shah NH, Magnus D (2018) Implementing machine learning in health care—addressing ethical challenges. The New England Journal of Medicine 378(11):981.
- Chawla et al. (2002) Chawla NV, Bowyer KW, Hall LO, Kegelmeyer WP (2002) Smote: Synthetic minority over-sampling technique. Journal of Artificial Intelligence Research 16:321–357, ISSN 1076-9757, URL http://dx.doi.org/10.1613/jair.953.
- China Government (2022) China Government (2022) Taxonomy of driving automation for vehicles. URL https://openstd.samr.gov.cn/bzgk/gb/newGbInfo?hcno=4754CB1B7AD798F288C52D916BFECA34.
- Chollet et al. (2015) Chollet F, et al. (2015) Keras. URL https://github.com/fchollet/keras.
- Coglianese and Lehr (2016) Coglianese C, Lehr D (2016) Regulating by robot: Administrative decision making in the machine-learning era. Geo. LJ 105:1147.
- Cummins (1990) Cummins JD (1990) Asset pricing models and insurance ratemaking. ASTIN Bulletin: The Journal of the IAA 20(2):125–166.
- Cutillo et al. (2020) Cutillo CM, Sharma KR, Foschini L, Kundu S, Mackintosh M, Mandl KD (2020) Machine intelligence in healthcare—perspectives on trustworthiness, explainability, usability, and transparency. NPJ Digital Medicine 3(1):1–5.
- Dai and Singh (2020) Dai T, Singh S (2020) Conspicuous by its absence: Diagnostic expert testing under uncertainty. Marketing Science 39(3):540–563.
- Dai and Singh (2021) Dai T, Singh S (2021) Artificial intelligence on call: The physician’s decision of whether to use ai in clinical practice. SSRN .
- Danzon (2000) Danzon PM (2000) Liability for medical malpractice. Handbook of Health Economics 1:1339–1404.
- Dietvorst et al. (2015) Dietvorst BJ, Simmons JP, Massey C (2015) Algorithm aversion: People erroneously avoid algorithms after seeing them err. Journal of Experimental Psychology: General 144(1):114.
- Dietvorst et al. (2018) Dietvorst BJ, Simmons JP, Massey C (2018) Overcoming algorithm aversion: People will use imperfect algorithms if they can (even slightly) modify them. Management Science 64(3):1155–1170.
- Dietz (2017) Dietz M (2017) Gan-sandbox. URL https://github.com/mjdietzx/GAN-Sandbox.
- Dua and Graff (2017) Dua D, Graff C (2017) UCI machine learning repository. URL http://archive.ics.uci.edu/ml.
- Embrechts (2000) Embrechts P (2000) Actuarial versus financial pricing of insurance. The Journal of Risk Finance .
- European Union Commission (2022) European Union Commission (2022) Liability rules for artificial intelligence. Artificial Intelligence Liability Directive, URL https://ec.europa.eu/info/business-economy-euro/doing-business-eu/contract-rules/digital-contracts/liability-rules-artificial-intelligence_en.
- Evas (2018) Evas T (2018) A common eu approach to liability rules and insurance for connected and autonomous vehicles: European added value assessment: Accompanying the european parliament’s legislative own-initiative report.
- Futoma et al. (2020) Futoma J, Simons M, Panch T, Doshi-Velez F, Celi LA (2020) The myth of generalisability in clinical research and machine learning in health care. The Lancet Digital Health 2(9):e489–e492.
- Geistfeld (2017) Geistfeld MA (2017) A roadmap for autonomous vehicles: State tort liability, automobile insurance, and federal safety regulation. Calif. L. Rev. 105:1611.
- Gismondi&Associates (2012) Gismondi&Associates (2012) Unnecessary mastectomy performed due to misdiagnosis — the law offices of gismondi & associates. URL https://www.gislaw.com/2012/11/unnecessary-mastectomy-performed-due-to-misdiagnosis/, (Accessed on 03/12/2021).
- Goodfellow (2017) Goodfellow I (2017) Nips 2016 tutorial: Generative adversarial networks.
- Goodfellow et al. (2014) Goodfellow IJ, Pouget-Abadie J, Mirza M, Xu B, Warde-Farley D, Ozair S, Courville A, Bengio Y (2014) Generative adversarial networks. arXiv preprint arXiv:1406.2661 .
- Gorzelany (2015) Gorzelany J (2015) Volvo will accept liability for its self-driving cars. URL https://www.forbes.com/sites/jimgorzelany/2015/10/09/volvo-will-accept-liability-for-its-self-driving-cars/?sh=73f5faad72c5.
- Harned et al. (2019) Harned Z, Lungren MP, Rajpurkar P (2019) Machine vision, medical ai, and malpractice. Zach Harned, Matthew P. Lungren & Pranav Rajpurkar, Comment, Machine Vision, Medical AI, and Malpractice, Harv. JL & Tech. Dig.(2019) .
- Ibrahim et al. (2021) Ibrahim R, Kim SH, Tong J (2021) Eliciting human judgment for prediction algorithms. Management Science 67(4):2314–2325.
- Jorion (2000) Jorion P (2000) Value at risk (McGraw-Hill Professional Publishing).
- Kawaguchi (2021) Kawaguchi K (2021) When will workers follow an algorithm? a field experiment with a retail business. Management Science 67(3):1670–1695.
- Kim et al. (2020) Kim HE, Kim HH, Han BK, Kim KH, Han K, Nam H, Lee EH, Kim EK (2020) Changes in cancer detection and false-positive recall in mammography using artificial intelligence: a retrospective, multireader study. The Lancet Digital Health 2(3):e138–e148, ISSN 2589-7500, URL http://dx.doi.org/https://doi.org/10.1016/S2589-7500(20)30003-0.
- Kingston (2016) Kingston JK (2016) Artificial intelligence and legal liability. International Conference on Innovative Techniques and Applications of Artificial Intelligence, 269–279 (Springer).
- Krishnan (2020) Krishnan M (2020) Against interpretability: a critical examination of the interpretability problem in machine learning. Philosophy & Technology 33(3):487–502.
- Landsman and Sherris (2001) Landsman Z, Sherris M (2001) Risk measures and insurance premium principles. Insurance: Mathematics and Economics 29(1):103–115.
- Le et al. (2016) Le MT, Mothersill CE, Seymour CB, McNeill FE (2016) Is the false-positive rate in mammography in north america too high? The British Journal of Radiology 89(1065):20160045.
- Lee et al. (2020) Lee MV, Konstantinoff K, Gegios A, Miles K, Appleton C, Hui D (2020) Breast cancer malpractice litigation: A 10-year analysis and update in trends. Clinical Imaging 60(1):26–32.
- Lipton (2016) Lipton ZC (2016) The mythos of model interpretability. arXiv preprint arXiv:1606.03490 .
- Lipton (2018) Lipton ZC (2018) The mythos of model interpretability: In machine learning, the concept of interpretability is both important and slippery. Queue 16(3):31–57.
- Markowitz (2010) Markowitz HM (2010) Portfolio theory: as i still see it. Annu. Rev. Financ. Econ. 2(1):1–23.
- McKeever and Singh Walia (2020) McKeever S, Singh Walia M (2020) Synthesising Tabular Datasets Using Wasserstein Conditional GANS with Gradient Penalty (WCGAN-GP) (Technological University Dublin).
- McNeil et al. (2015) McNeil AJ, Frey R, Embrechts P (2015) Quantitative risk management: concepts, techniques and tools-revised edition (Princeton university press).
- Mirza and Osindero (2014) Mirza M, Osindero S (2014) Conditional generative adversarial nets. arXiv preprint arXiv:1411.1784 .
- MunichRe (2022) MunichRe (2022) Insure ai. https://www.munichre.com/en/solutions/for-industry-clients/insure-ai.html, accessed: 2022-08-01.
- Obermeyer et al. (2019) Obermeyer Z, Powers B, Vogeli C, Mullainathan S (2019) Dissecting racial bias in an algorithm used to manage the health of populations. Science 366(6464):447–453.
- Panch et al. (2019) Panch T, Mattie H, Celi LA (2019) The “inconvenient truth” about ai in healthcare. NPJ Digital Medicine 2(1):1–3.
- Parikh et al. (2019) Parikh RB, Teeple S, Navathe AS (2019) Addressing bias in artificial intelligence in health care. JAMA 322(24):2377–2378.
- Pedregosa et al. (2011) Pedregosa F, Varoquaux G, Gramfort A, Michel V, Thirion B, Grisel O, Blondel M, Prettenhofer P, Weiss R, Dubourg V, et al. (2011) Scikit-learn: Machine learning in python. Journal of Machine Learning Research 12:2825–2830.
- Price and Cohen (2019) Price WN, Cohen IG (2019) Privacy in the age of medical big data. Nature medicine 25(1):37–43.
- Price et al. (2019) Price WN, Gerke S, Cohen IG (2019) Potential liability for physicians using artificial intelligence. JAMA 322(18):1765–1766.
- Radford et al. (2015) Radford A, Metz L, Chintala S (2015) Unsupervised representation learning with deep convolutional generative adversarial networks. arXiv preprint arXiv:1511.06434 .
- Rafter et al. (2022) Rafter G, Leci M, Liu Y (2022) Autonomous vehicles: cross jurisdictional regulatory perspectives update. Borden Ladner Gervais LLP, URL https://www.lexology.com/library/detail.aspx?g=e0eb6c9b-55e0-4a72-8d2a-2e88b7584cc6.
- Reed et al. (2016) Reed C, Kennedy E, Silva S (2016) Responsibility, autonomy and accountability: legal liability for machine learning.
- Ribeiro et al. (2016) Ribeiro MT, Singh S, Guestrin C (2016) Model-agnostic interpretability of machine learning. arXiv preprint arXiv:1606.05386 .
- Rockafellar and Uryasev (2000) Rockafellar RT, Uryasev S (2000) Optimization of conditional value-at-risk. Journal of Risk 2:21–42.
- Rosen&Perry (2021) Rosen&Perry (2021) Patient Undergoes Unnecessary Mastectomy after Being Misdiagnosed with Breast Cancer — Pittsburgh Medical Malpractice Settlements — Rosen & Perry. URL https://www.caringlawyers.com/verdicts-settlements/patient-undergoes-unnecessary-mastectomy-after-being-misdiagnosed-with-breast-cancer/, (Accessed on 03/12/2021).
- Salimans et al. (2016) Salimans T, Goodfellow I, Zaremba W, Cheung V, Radford A, Chen X (2016) Improved techniques for training gans. arXiv preprint arXiv:1606.03498 .
- Schellekens (2015) Schellekens M (2015) Self-driving cars and the chilling effect of liability law. Computer Law & Security Review 31(4):506–517.
- Schmidt and Biessmann (2019) Schmidt P, Biessmann F (2019) Quantifying interpretability and trust in machine learning systems. arXiv preprint arXiv:1901.08558 .
- SEER (2020) SEER (2020) Female breast cancer — cancer stat facts. URL https://seer.cancer.gov/statfacts/html/breast.html, (Accessed on 03/12/2021).
- Senn (1930) Senn M (1930) Road Traffic Act 1930. URL http://www.legislation.gov.uk.
- Shavell (2018) Shavell S (2018) On liability and insurance. Economics and Liability for Environmental Problems, 151–163 (Routledge).
- Siegel et al. (2018) Siegel RL, Miller KD, Jemal A (2018) Cancer statistics, 2018. CA: A Cancer Journal for Clinicians 68(1):7–30, URL http://dx.doi.org/https://doi.org/10.3322/caac.21442.
- Singh et al. (2016) Singh J, Walden I, Crowcroft J, Bacon J (2016) Responsibility & machine learning: Part of a process. Available at SSRN 2860048 .
- Somorjit and Verma (2020) Somorjit L, Verma M (2020) Variants of generative adversarial networks for credit card fraud detection. International Conference on Computational Intelligence, Security and Internet of Things, 133–143 (Springer).
- Stern et al. (2022) Stern AD, Goldfarb A, Minssen T, Price II WN (2022) Ai insurance: How liability insurance can drive the responsible adoption of artificial intelligence in health care. NEJM Catalyst Innovations in Care Delivery 3(4):CAT–21.
- Stöger et al. (2021) Stöger K, Schneeberger D, Holzinger A (2021) Medical artificial intelligence: the european legal perspective. Communications of the ACM 64(11):34–36.
- Street et al. (1993) Street WN, Wolberg WH, Mangasarian OL (1993) Nuclear feature extraction for breast tumor diagnosis. Biomedical Image Processing and Biomedical Visualization, volume 1905, 861–870 (International Society for Optics and Photonics).
- Topol (2019) Topol EJ (2019) High-performance medicine: the convergence of human and artificial intelligence. Nature Medicine 25(1):44–56.
- UK Ministry for Transport (2022) UK Ministry for Transport (2022) The highway code on self-driving ehicles. Artificial Intelligence Liability Directive, URL https://www.gov.uk/government/consultations/safe-use-rules-for-automated-vehicles-av/outcome/letter-to-parliament-about-a-new-section-to-the-highway-code-on-self-driving-vehicles-25-april-2022.
- Uryasev (1995) Uryasev S (1995) Derivatives of probability functions and some applications. Annals of Operations Research 56(1):287–311.
- Uryasev (2000) Uryasev S (2000) Conditional value-at-risk: Optimization algorithms and applications. Proceedings of the IEEE/IAFE/INFORMS 2000 Conference on Computational Intelligence for Financial Engineering (CIFEr)(Cat. No. 00TH8520), 49–57 (IEEE).
- Vega-Márquez et al. (2019) Vega-Márquez B, Rubio-Escudero C, Riquelme JC, Nepomuceno-Chamorro I (2019) Creation of synthetic data with conditional generative adversarial networks. International Workshop on Soft Computing Models in Industrial and Environmental Applications, 231–240 (Springer).
- Wang et al. (2017) Wang J, Perez L, et al. (2017) The effectiveness of data augmentation in image classification using deep learning. Convolutional Neural Networks Vis. Recognit 11.
- Wang et al. (2022) Wang Q, Huang Y, Jasin S, Singh PV (2022) Algorithmic transparency with strategic users. Management Science .
- Whang et al. (2013) Whang JS, Baker SR, Patel R, Luk L, Castro III A (2013) The causes of medical malpractice suits against radiologists in the united states. Radiology 266(2):548–554.
- Yala et al. (2019) Yala A, Lehman C, Schuster T, Portnoi T, Barzilay R (2019) A deep learning mammography-based model for improved breast cancer risk prediction. Radiology 292(1):60–66.
- Ye et al. (2018) Ye Y, Wang L, Wu Y, Chen Y, Tian Y, Liu Z, Zhang Z (2018) Gan quality index (GQI) by gan-induced classifier.
- Zhang et al. (2017) Zhang H, Xu T, Li H, Zhang S, Wang X, Huang X, Metaxas D (2017) Stackgan: Text to photo-realistic image synthesis with stacked generative adversarial networks.
Appendix
10 Background for the Simultaneous Minimization of CVaR and Calculation of VaR
Following the notation proposed by Uryasev (2000), we let:
-
•
the probability density function of ;
-
•
the probability that the loss function does not exceed some threshold value ;
-
•
the VaR function; the percentile of the loss distribution with confidence level . Based on this definition, .
-
•
is the CVaR or the conditional expected loss defined as:
(12)
Equation (12) is complex due to the function involved in its definition. For this reason, the authors of Uryasev (2000) introduce a simpler function:
| (13) |
which can be used instead of CVaR. By minimizing this function w.r.t we can directly derive CVaR.
| (14) |
It also follows that is convex w.r.t. and that its minimum point is the VaR measure. This finding allows us to leverage the function for optimizing CVaR and simultaneously calculating VaR (Uryasev 2000):
| (15) |
In this way, we can optimize CVaR and find VaR in tandem. Under general conditions (see (Uryasev 1995)) and if is also convex, this problem is equivalent to solving a smooth convex optimization problem.
11 Robust Formulation
We investigate the problem of . That is equivalent to
| (16) |
Notice that the maximum of is less than if and only if all are less than . To maximize over , we set all to their upper bound . Hence, the robust counterpart for this uncertainty set is:
| (17) |
12 Implementation Supplemental Material
| Parameter | Range |
|---|---|
| 3 | |
| 0.9, 0.95, 0.99 | |
| $10,000, $50,000 | |
| $100,000 $500,000 | |
| $25,000, $150,000 | |
| $500,000, $1,000,000 | |
| $150,000, $400,000 | |
| 0.01 - 0.75 | |
| 1,000 | |
| 100 |
Output: prices (), VaR (), CVaR
Input: