Multi-modal Point-of-Care Diagnostics for COVID-19 Based On Acoustics and Symptoms
Abstract
The research direction of identifying acoustic bio-markers of respiratory diseases has received renewed interest following the onset of COVID-19 pandemic. In this paper, we design an approach to COVID-19 diagnostic using crowd-sourced multi-modal data. The data resource, consisting of acoustic signals like cough, breathing, and speech signals, along with the data of symptoms, are recorded using a web-application over a period of ten months. We investigate the use of statistical descriptors of simple time-frequency features for acoustic signals and binary features for the presence of symptoms. Unlike previous works, we primarily focus on the application of simple linear classifiers like logistic regression and support vector machines for acoustic data while decision tree models are employed on the symptoms data. We show that a multi-modal integration of acoustics and symptoms classifiers achieves an area-under-curve (AUC) of , a significant improvement over any individual modality. Several ablation experiments are also provided which highlight the acoustic and symptom dimensions that are important for the task of COVID-19 diagnostics.
COVID-19 diagnostics, Acoustic bio-markers, Point-of-Care Testing, Multi-modal classification.
1 Introduction
A highly contagious variant of the coronavirus family, SARS-CoV-2 has resulted in the most significant health crisis of the twenty-first century [1]. The outbreak was termed as the coronavirus disease 2019 (or COVID-19) and declared a pandemic in March 2020 by the World Health Organization (WHO). While vaccination efforts have partly reduced the viral spread in some parts of the world, the multiple waves of infections across various countries indicate that the COVID-19 pandemic has the potential to persist for months and years to come [1].
The pathogenesis of COVID-19 suggests that infection triggers a series of events that enable the SARS-CoV-2 virus to replicate and migrate down the respiratory tract to the epithelial cells in the lungs [1]. The most common timeline for these events is - days from the onset of the infection. Further, the risk of viral spread to primary contacts is the highest during the first week of infection. Early diagnosis can help to identify, isolate infected individuals, and control the community spread of the virus [2].
1.1 Current tests and limitations
Currently, the gold-standard of COVID-19 diagnosis is the reverse transcription polymerase chain reaction (RT-PCR) assay [3]. The RT-PCR, based on molecular testing, detects the amino-acid sequences unique to SARS-CoV-2 in swab samples. The throat and/or nasal swab samples are first collected, stored, and processed at a lab facility, where the ribo-nucleic acid (RNA) content is amplified for detecting the presence of the COVID-19 genome in the sample. However, the RT-PCR has four major limitations when it comes to massive population level scaling: i) the cost of RT-PCR chemical reagent and facility, ii) expert supervision, iii) the turnaround time from sample collection to results (hours to days), and iv) lack of physical distancing during sample collection.
A widely used alternative to RT-PCR testing is the rapid antigen testing (RAT) methodology [4]. In particular, the RAT attempts to identify one of the outer proteins of the viral shell or envelope with results available in min. This testing methodology is less expensive compared to the chemical reagent based testing. However, the key limitation of potential spread during sample collection is not alleviated. Further, the sensitivity values for the same level of specificity are lower compared to RT-PCR tests [5].
In summary, there is a need to discover alternative test methodologies which improve the trade-off between time, cost, physical distancing, and performance. The WHO blueprint on COVID-19 diagnostic tests highlights the urgent need for developing point-of-care tests (POCTs) [6]. In this paper, we present a study analyzing the respiratory acoustics of COVID-19 infection and its suitability for the design of POCT tools.
1.2 Acoustics for respiratory diagnostics
Listening to acoustic changes in lung sounds for preliminary screening of abnormalities in the respiratory passage was first formalized by Laennec et al. [7] in . With the advances in sensor and communication technologies, “machine listening” approach for automatic analysis of respiratory sounds has gained interest. The evaluation metrics typically employed are area under the curve (AUC) and specificity at a pre-defined sensitivity. Pramono et. al. [8] developed an automated diagnosis of pertussis using cough sound signals. A smartphone based multi-modal user-friendly approach to the detection of chronic obstructive pulmonary disease (COPD) and congestive heart failure was explored by Windmon et. al. [9]. Botha et.al. [10] showed that a spectral analysis of cough sounds can provide a low cost detection of tuberculosis. In a recent work, Porter et. al. [11] developed a smartphone based portable cough sound and reported symptoms analysis to detect chronic airway disease. Additionally, in controlled studies using small cohort sizes, effectiveness of machine learning based sound analysis has been demonstrated for childhood pneumonia detection [12], wet versus dry cough classification [13], and asthmatic versus healthy classification [14]. These efforts illustrate that acoustic signals have the potential to allow low-cost, rapid and efficient diagnostics of respiratory ailments.
For COVID-19, a meta-analysis study of symptoms by Li et al.[15] found fever (), followed by cough (), and malaise () as the common symptoms in COVID-19 infected individuals. The clinical symptoms of COVID-19 include fever, common cold, cough, chest congestion, breathing difficulties, dyspnea, loss of smell/taste and pneumonia [16]. The human sounds, such as cough, breathing, and speech, result from a coordinated functioning of the lungs and the organs in the respiratory pathway. An impairment in the functioning of these organs, such as constriction, fatigue, or difficulty in breathing, may be manifested in the acoustic characteristics of these sounds. These observations motivate the design and evaluation of a sound sample based diagnosis approach for COVID-19 [17]. A success can lead to creation and large-scale deployment of a POCT tool, where an individual can record their sound samples on a portable web-connected device, and an application can analyze and display the result.
2 Related prior work and contributions
For sound sample dataset creation, the notable efforts include the COVID-19 Sounds project (cough and breathing) by Univ. Cambridge [18], COUGHVID dataset (cough) by EPFL [19], and the COVID-19 Cough dataset by MIT [20]. Further, our team has also been involved in the dataset creation task [21].
Using cough and breathing sounds, Brown et al. [18] report a performance measure of AUC on a subset of COVID-19 Sounds dataset. On a similar dataset, Coppock et al. [22] report AUC. Agbley et al. [23] demonstrated a specificity of at a sensitivity of on a subset of COUGHVID dataset. Feng et al. [24] used a subset of cough sounds from Coswara dataset and reported a performance of AUC. Laguarte et al. [20] obtained AUC greater than on samples from the COVID-19 Cough data set. These studies use acoustic feature representations of cough sounds such as Mel frequency cepstral coefficients (MFCCs) [18], Mel-spectrogram [22, 20], or scalograms [23], while the classifier models are deep learning based neural networks such as convolutional neural networks (CNNs) [23], recurrent neural networks (RNNs) [24], CNN based feature embeddings in support vector machines (SVM) [18] or with CNN based residual networks [22, 20]. There are also attempts at creating more controlled COVID-19 cough sound dataset from individuals in hospitals [25, 26].
For voice sounds, Verde et al. [27] used sustained phonation of vowels from a subset of the Coswara dataset, and obtain AUCs in the range using different kinds of classifier.
Using self-reported symptoms of COVID-19, Menni et. al. [28] showed that an AUC of is achievable from two different sets of recorded data (from the US and UK). A recent study by Zaobi et. al. [29] further extended the analysis using a large pool of COVID-19 and healthy subjects.
2.1 Contributions
The key contributions from the current work are as follows.
-
1.
Investigating a multi-modal integration approach to classification using cough, breathing and speech signals, along with self-reported symptoms.
-
2.
Exploring recording level statistical feature descriptors of acoustic signals, and binary feature encoding of symptom data.
-
3.
Emphasis on simple linear classifier models like linear regression and support vector machine approaches for COVID-19 classification task.
-
4.
Understanding the importance of feature dimensions using ablation studies.
3 Materials
3.1 Dataset
This study is based on sound and symptom samples from the Coswara dataset111https://github.com/iiscleap/Coswara-Data [21]. We use the data recorded (and released) up to 07-May-2021. This is composed of contributions from participants ( COVID-19 positive). Each participant contributes audio recordings, namely, shallow and deep breathing, shallow and heavy cough, sustained phonation of three vowels /ae/ (as in bat), /i/ (as in beet), and /u/ (as in boot), and fast and normal pace number counting. Alongside this, each participant also records current health status (COVID-19 infection, symptoms and co-morbidity, if any), gender, age, and broad geographical location. No personally identifiable information is collected. The dataset collection protocol is approved by the Human Ethics Committee of the Indian Institute of Science, Bangalore and the P. D. Hinduja National Hospital and Medical Research Center, Mumbai, India. In this study, we focus on modeling and analysis of three sound categories, namely, (i) breathing-deep (breathing), (ii) cough-heavy (cough), and (iii) counting-normal (speech) and the symptom data.
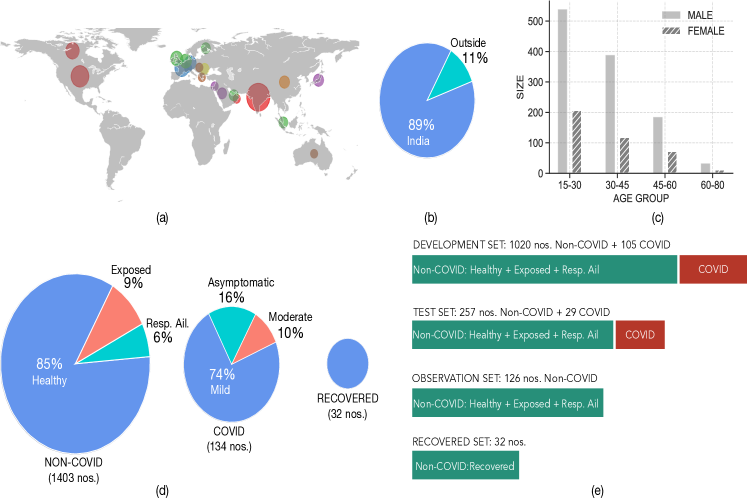
In this study, we select participants in the age group of yrs. Any participant with less than ms of sound sample or peak amplitude less than are removed. The resulting subset consists of data from participants. An illustration of geographic distribution, age, and gender is shown in Figure 1 (a,b,c). The participants come from several countries; however, belong to India. The majority of the participants belong to the years age group, and a majority are male (). The participants can be further grouped into three pools (Figure 1(d)). In the first pool, referred to as non-COVID, participants are self-declared COVID-19 negative. This comprises individuals who are healthy (), exposed to COVID-19 positive patients , or have pre-existing respiratory ailments. In the second pool, referred to as COVID, participants are self-declared COVID-19 positive. This comprises individuals who have mild (), moderate (), or asymptomatic COVID-19 infection at the time of recording their audio sample. In the third pool, referred to as recovered, we have participants.
3.2 Dataset division
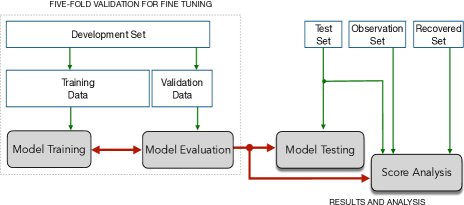
The three pools of participants, shown in Figure 1(d), are re-organized to create non-overlapping subsets facilitating development of classifiers, testing, and analysis (Figure 2). The subsets are also illustrated in Figure 1(e).
3.2.1 Development and test set
These are obtained by performing a random split on both non-COVID and COVID pools after removing the observation set ( participants). The resulting subsets are referred to as the development and test sets. The development set is composed of ( COVID) participants, and the test set has ( COVID) participants. The development set is further divided into training and validation sets in a five-fold validation setup. The train/validation folds are used for training and fine-tuning the classifiers. All the subsets have COVID and non-COVID pool distributions for gender/age groups similar to the full data.
3.2.2 Observation set
3.2.3 Recovered set
The set of participants who self-reported as recovered ( participants) is also separated out of development and test sets. As the date of recovery is not collected during recording, we only analyze the score distribution of these participants in Section 5.4.
4 Methods
4.1 Classification models
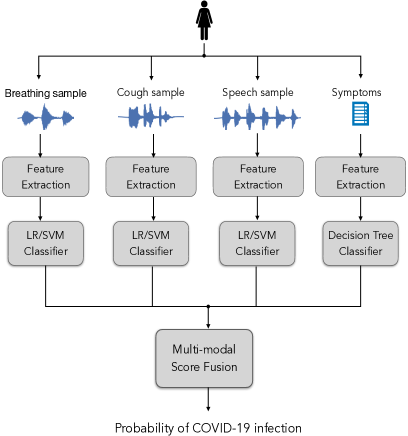
The block schematic of the multi-modal diagnostic tool proposed in this work is shown in Figure 3. We consider the binary classification task designed to separate COVID participants from non-COVID participants. On the sound sample data, we explore the logistic regression (LR) model, support vector machine with linear kernel (Lin-SVM) model and support vector machine with radial basis function kernel (RBF-SVM) model. On symptom data, a decision tree model is used.
For the discussion below, let denote an acoustic feature vector and denote a symptom feature vector. We denote the prediction score (higher values indicating a higher probability of COVID class), an output of the model, by .
Logistic regression (LR): The LR model generates the prediction score () as,
| (1) |
where, and are the weight vector and the bias of the model, respectively. Here, is the logistic function, . The LR model is trained by minimizing the cost function defined as,
| (2) |
where, denotes the class label of the feature vector , for COVID class and for non-COVID class, is the -norm of the vector and is a regularization parameter. The cost function is optimized using standard gradient based methods [30].
Support vector machine (SVM): The linear SVM (Lin-SVM) model generates prediction scores as,
| (3) |
where, and are the weight vector and bias of the model, respectively; and denotes the Platt scaling based calibration [31]. The model is learned by minimizing the soft-margin cost function defined as,
| (4) |
where, denotes the class label of the feature vector , for COVID class and for non-COVID class. The above cost function is optimized using constrained optimization methods involving primal-dual modeling. In the dual space, the weight vector is expressed as a function of the inner-product of the feature matrix [31]. By replacing the inner-product with a kernel, the Lin-SVM model can be made to operate in a higher dimensional space. We explore SVM with radial basis function kernel (RBF) defined as,
| (5) |
where is the kernel function of two data points , and is a free parameter of the RBF kernel.
The acoustic features that are input to the classifier are standardized using the global mean-variance, computed on the training data.
Decision tree: Each node in the tree is associated with a feature dimension. The edges drawn out of a node indicate the value of the feature dimension for each possible value (in our case, the features are binary). The leaf nodes are associated with a posterior probability distribution over the classes. In a classification tree model, the leaf nodes represent classification decisions while the other nodes represent the set of conditions applied on to the features that lead to the class labels. The Gini criterion is used by the classifier [32], and the minimum number of samples at the leaf node in the tree is chosen based on the cross-validation.
4.2 Performance metrics
The primary metric used in our analysis is the area-under-the curve (AUC) measure of the receiver operating characteristic curve (ROC). The ROC plots “1-specificity” versus the sensitivity. The sensitivity (a.k.a true positive rate) and specificity (a.k.a false negative rate) are defined as,
| Sensitivity | (6) | ||||
| Specificity | (7) |
where, label stands for a participant. We compute the ROC curve by varying the decision threshold from to in steps of and obtaining the specificity and sensitivity at each of these thresholds. The AUC is computed using the trapezoidal rule. The positive predictive value (PPV) is the probability that a participant with a positive decision from the test has the COVID-19 infection. Similarly, negative predictive value (NPV) is the probability that a participant with a negative decision does not have the COVID-19 infection.
4.3 Audio pre-processing
The Coswara dataset provides sound samples as WAV format audio files. A majority () of these are sampled at kHz. We standardize all sound files to a sampling rate of kHz via re-sampling. The amplitude range of the audio file is also normalized to . Any initial and trailing silences in the audio files (greater than msec on either side) is removed using threshold amplitude value of . The average duration (and standard deviation) of sound samples correspond to secs, secs, and secs for breathing, cough, and speech categories, respectively.
4.4 Audio feature extraction
We make use of the low-level descriptors (LLDs) referred to as ComParE2016 [33] for this. These descriptors broadly quantify the energy, spectral, and voicing attributes in an acoustic signal. These are listed in Table 1. We further quantify statistical properties of each of the LLDs over time (and/or frequency). There are approximately statistical measures quantified for each LLD. A broad categorization of these properties is listed in Table 2. A detailed description of the LLDs and the estimated statistical measures is available in the reading material222https://github.com/iiscleap/MuDiCov/blob/main/ComParE2016_Featureset_Description.pdf. Every sound sample is represented by a dimensional feature vector. The same set of features are derived for all categories of the acoustic signals namely, cough, breathing and speech.
| Low level descriptor (LLD) | Dim. | |
| Energy | RMS Energy, Zero-Crossing Rate | 2 |
| Sum of modulation-filtered auditory spectrum | 1 | |
| Sum of auditory spectrum (loudness) | 1 | |
| Spectral | modulation-filtered auditory spectrogram (0–8 kHz) | 26 |
| Mel frequency Cepstral coefficients (MFCCs) | 14 | |
| Spectral Flux, Centroid, Entropy, Slope | 4 | |
| Psychoacoustic Sharpness, Harmonicity | 2 | |
| Spectral Roll-Off Pt. 0.25, 0.5, 0.75, 0.9 | 4 | |
| Spectral Variance, Skewness, Kurtosis | 3 | |
| Spectral energy 250–650 Hz, 1 kHz–4 kHz | 2 | |
| Voicing | F0 (SHS & Viterbi smoothing) | 1 |
| Log. HNR, Jitter (local, ), Shimmer (local) | 4 | |
| Probability of voicing | 1 |
| Statistic features derived from LLD | Group |
| Quartiles 1–3, 3 inter-quartile ranges | Percentiles |
| percentile ( min), percentile ( max) | |
| Percentile range 1 %–99 % | |
| Position of min / max, range (max – min) | Temporal |
| Contour centroid, flatness | |
| Rel. duration LLD is range | |
| Relative duration LLD is rising | |
| Relative duration LLD has positive curvature | |
| Mean, max, min, std. deviation of segment length | |
| Percentage of non-zero frames | |
| Mean value of peaks | Peaks |
| Mean value of peaks – arithmetic mean | |
| Mean / std.deviation of inter peak distances | |
| Amplitude mean of peaks, of minima | |
| Amplitude range of peaks | |
| Mean / std. deviation of rising / falling slopes | |
| Arithmetic mean, root quadratic mean | Moments |
| Standard deviation, skewness, kurtosis | |
| Linear regression slope, offset, quadratic error | Regression |
| Quadratic regression a, b, offset, quadratic error | |
| Linear prediction (LP) gain, LP Coeffecients 1–5 | Modulation |
From Table 1, and 2, we see that the feature set is a rich set of redundant features, with the multiple descriptors capturing similar acoustic properties of the audio signal. However, since the features are well defined functions on low-level acoustic descriptors, the analysis using simple linear models of classification allows us to understand the acoustic characteristics of the cough, speech and breathing signals that enable the classification of COVID and non-COVID participants. This analysis is given in Section 5.4.
4.5 Features from symptoms
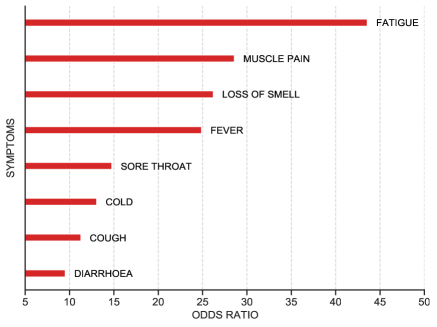
The dataset also has information on the presence/absence of common symptoms from all the participants. The odds ratio of the participants with symptoms among the COVID and non-COVID category is shown in Figure 4. Not all COVID participants have symptoms, and a few participants have more than one symptom. In terms of proportions, a higher proportion of participants with COVID have symptoms than the non-COVID participants. Figure 4 shows that the odds-ratio is higher for fatigue, muscle pain and loss of smell.
In our model development, the symptoms are converted to dimensional binary features for each participant. Each feature dimension is set to or depending on the presence or absence of the symptom respectively. The binary vectors derived in this manner are used to train and test a classifier which is input with these features.
4.6 Multi-modal fusion
We explore the fusion of predicted probability scores from multiple modalities of acoustic data (cough, breathing and speech) and symptom data. Let be the scores obtained from different classifiers (maximum value of is ) for a given participant. The fused score is,
| (8) |
4.7 Implementation
We use the OpenSmile [34] Python toolbox333https://github.com/audeering/opensmile-python to extract the features from sound samples. The classifiers are implemented using the Scikit-learn Python toolkit [36]. In order to allow reproducible research, all the implementation scripts to extract features and train the classifiers reported in this work are available at https://github.com/iiscleap/MuDiCov.
5 Experiments and Results
The experiments are performed on the dataset splits shown in Figure 2. The hyper-parameters, namely, in Equation (2) (LR) and Equation (4) (SVM), and minimum number of samples in leaf nodes (decision tree), are selected using a five-fold validation procedure on the development data. The final value for each hyper-parameter is chosen based on the best average AUC measure on the five-folds. Subsequently, the classifier is trained on the entire development set with the chosen hyper-parameter value. This classifier is evaluated on the test set. We use the default options for other configuration parameters. For all the classifiers, we use the “balanced loss” option in the classifier configuration. In the balanced loss setting, the loss value for the positive class samples is weighted by the ratio of the number of negative class samples to positive class samples in the training set.
5.1 Acoustic classifiers
The top row in Figure 5 depicts the five-fold cross validation results obtained for the three classifiers, independently trained on each of the three acoustic modalities. The plots correspond to the classifier with the best regularization parameter , identified based on maximum average validation AUC. The breathing (Br) and speech (Sp) categories performed relatively better compared to the cough (Co) data. The confidence interval around the mean ROCs and the mean AUCs indicates that the variance across the folds is also small.
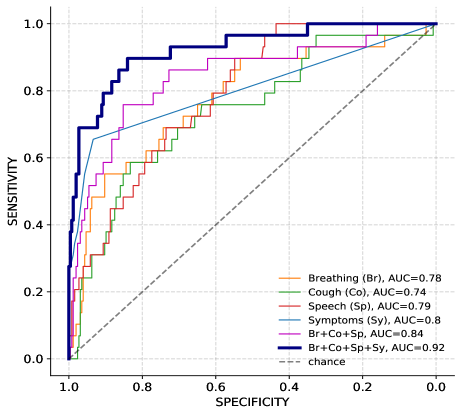
The bottom row in Figure 5 depicts the ROCs on the test set using the classifiers trained on the entire development set. The AUC is , and for Br, Co and Sp categories, respectively. Also, the performance of the lin-SVM is similar to LR. Further, the use of non-linear RBF kernel did not show consistent benefits. We use the logistic regression (LR) which is a linear classifier in all the subsequent experiments.
5.2 Symptom classifier
Figure 6 shows the final decision tree model obtained after five-fold cross-validation. At each node, the classifier tests whether a given symptom is present or not. The numerical value at the leaf node is the probability of COVID class. The probability is greater than if any one of the symptoms are present, and is if none of the symptoms are present. For isolated symptoms of cough, cold and fever, the predicted probabilities are and respectively. The isolated symptoms of loss of smell and fatigue are also assigned probability greater than (higher odds ratio seen in Figure 4). The symptom of sore throat has the smallest probability of . The ROC for the decision tree classifier is shown in Figure 8, where an AUC of is observed.
5.3 Multi-modal diagnostics
| Category | Breathing | Cough | Speech | Symptom |
| Breathing | 1.0 | 0.225 | 0.354 | 0.281 |
| Cough | 0.225 | 1.0 | 0.339 | 0.106 |
| Speech | 0.354 | 0.339 | 1.0 | 0.089 |
| Symptom | 0.281 | 0.105 | 0.089 | 1.0 |
We investigate the cross-correlation between the test scores predicted by classifiers trained on the four categories of multi-modal data - three categories of acoustics and the symptom data. Table. 3 shows the cross-correlation coefficient values on the test data. The correlation coefficient is less than for all the pairs of modalities. The table shows that the scores predicted using symptoms have less correlation with scores from the sound categories of cough and speech.
We analyze a score fusion across the multi-modal data categories (Equation (8)). Figure 8 shows the test ROCs for the individual modalities, fusion of the acoustic categories, and the fusion of all the four categories. The fusion of the acoustic categories yields an improvement over the individual categories and gives an AUC of . The symptom data has better performance over the sound categories in the region of low sensitivity. Further, the fusion of the four categories improves the overall AUC significantly, and gives an AUC of . It is noteworthy that this AUC performance is achieved using classical machine learning models, LR and decision-tree, along with an arithmetic mean based score combination.
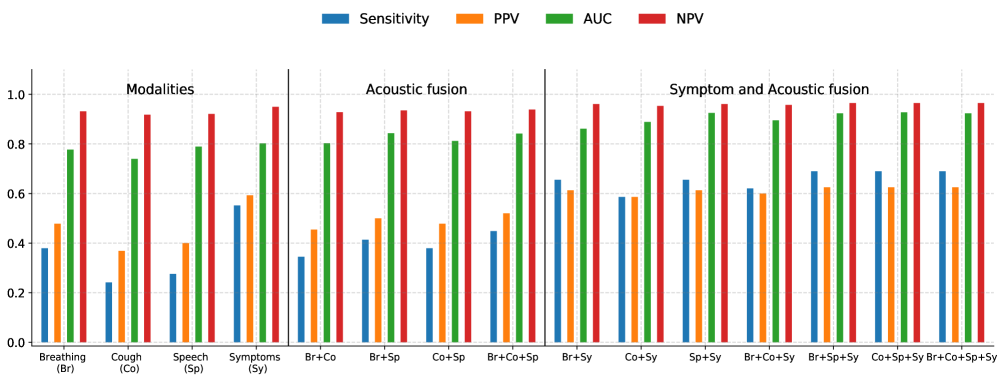
Figure 7 shows the test AUC, sensitivity at specificity of %, positive predictive value (PPV), and negative predictive value (NPV) for all the individual modalities and the fusion based combination. The figure shows that the combination of acoustic modalities improves the performance on all the measures reported. The fusion of the three acoustic categories is found to improve the test AUC by points over the best performing individual sound category. The sensitivity values also show improved performance for the fusion of acoustic categories compared to the individual modality.
| Features | Breathing | Cough | Speech | |||
| All | 0.78 | 0.74 | 0.79 | |||
| Subset (fSet) Type | fSet | All\fSet | fSet | All\fSet | fSet | All\fSet |
| RMS Energy, Zero-Crossing Rate | 0.69 | 0.77 | 0.61 | 0.73 | 0.75 | 0.79 |
| Sum of modulation filtered auditory spectrum | 0.70 | 0.78 | 0.66 | 0.74 | 0.71 | 0.79 |
| Sum of auditory spectrum (loudness) | 0.74 | 0.78 | 0.67 | 0.74 | 0.73 | 0.79 |
| All energy features | 0.73 | 0.77 | 0.68 | 0.72 | 0.78 | 0.79 |
| modulation filtered auditory spectrogram (0–8 kHz) | 0.73 | 0.74 | 0.55 | 0.70 | 0.73 | 0.78 |
| Mel frequency Cepstral coefficients (MFCC) | 0.66 | 0.78 | 0.74 | 0.69 | 0.76 | 0.77 |
| Spectral Flux, Centroid, Entropy, Slope | 0.72 | 0.78 | 0.65 | 0.74 | 0.72 | 0.79 |
| Psyoacousic Sharpness, Harmonicity | 0.70 | 0.78 | 0.60 | 0.74 | 0.67 | 0.79 |
| Spectral Roll-Off Pt. 0.25, 0.5, 0.75, 0.9 | 0.78 | 0.77 | 0.59 | 0.74 | 0.66 | 0.79 |
| Spectral Variance, Skewness, Kurtosis | 0.61 | 0.75 | 0.63 | 0.73 | 0.69 | 0.79 |
| Spectral energy in bands 250–650 Hz, 1 kHz–4 kHz | 0.62 | 0.78 | 0.60 | 0.75 | 0.62 | 0.80 |
| All spectral features | 0.75 | 0.72 | 0.72 | 0.64 | 0.79 | 0.75 |
| F0 (SHS & Viterbi smoothing) | 0.58 | 0.78 | 0.47 | 0.75 | 0.63 | 0.79 |
| Log. HNR, Jitter (local, ), Shimmer (local) | 0.62 | 0.76 | 0.48 | 0.75 | 0.62 | 0.80 |
| Probability of voicing | 0.73 | 0.77 | 0.62 | 0.73 | 0.60 | 0.79 |
| All voicing features | 0.68 | 0.75 | 0.50 | 0.75 | 0.70 | 0.80 |
Figure 7 also shows the performance for fusion of symptoms and the acoustic modalities as well as the fusion with pairs of acoustic categories. We see that fusion with symptoms improves the performance of the acoustic based classifiers significantly. The fusion of all the four modalities has the test AUC of , an absolute improvement of compared to the fusion of the acoustic categories alone. At specificity, a sensitivity of is achieved for the fusion of all modalities. The corresponding PPV is with a NPV value of .
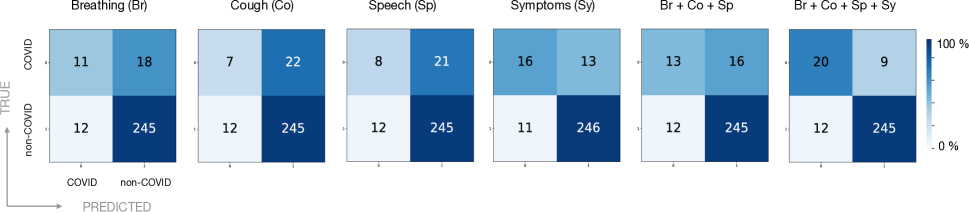
Next, we investigate the decision power of the developed classifiers. Figure 9 shows the confusion matrices for the four modalities and the score fusion. The confusion matrices are shown for an operating point with specificity value of . At the chosen operating point, the overall accuracy of the fusion system is , and the class-weighted accuracy is .
5.4 Score analysis
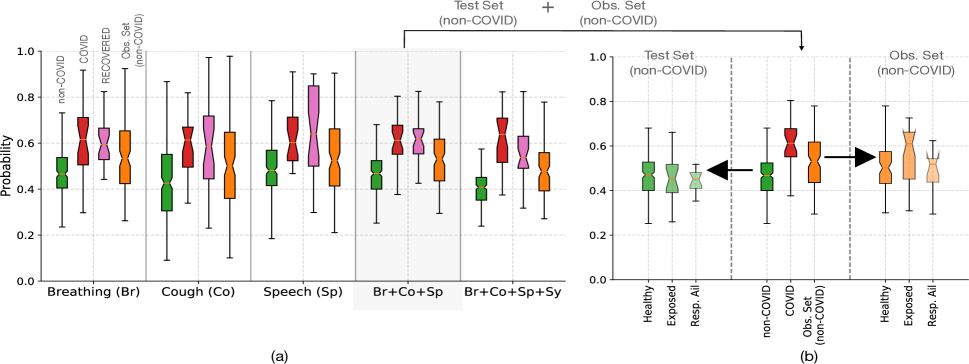
We analyze the score distribution from the individual modalities as well as the fusion system. The score distribution is given in Figure 10(a). The dataset distribution used in training and testing of the models is shown in Figure 2. Figure 10(a) shows the score distribution for the recovered subset (in blue shade) along with the score distribution of COVID class and non-COVID class data (green and red shade respectively). As seen here, for all the classifier settings, the score distribution of the participants in the recovered status is found to be similar to those seen in COVID positive subjects. While the coupling of this data with the duration of the recovery period would have enabled an in-depth analysis, we would like to point out that the majority of the data came from participants who had just been discharged from the hospital facility. This indicates that the acoustic bio-markers of COVID may last for longer periods of time.
Figure 10(a) also shows the score distribution of the observation set (set of participants who are non-COVID, but recorded during the second wave period of April 1, 2021 to May 7, 2021. All participants in this observation set came from India). The observation set consists of data from three categories - completely healthy with no exposure to COVID, healthy but exposed to COVID and individuals with pre-existing respiratory ailments but not infected with COVID. The score distribution for this subset is shown in orange shade in Figure 10(a). As seen here, the data from the observation set also tends to have a higher probability score compared to the score values obtained for the non-COVID category.
A closer analysis is given in Figure 10(b). Here, the score distribution of the blind test data belonging to the non-COVID category is compared with the score distribution of the observation subset (also of non-COVID category). It is observed that the subset of participants who have self-reported as “exposed” have a higher value of scores during this period of second wave in India compared to the same category of participants from a previous time period. This indicates that the observation set of participants with “exposed” category may have acoustic bio-markers of the COVID infection.
5.5 Acoustic feature ablation experiments
The ComParE2016 features [35] are the statistics computed from low-level descriptors of different categories shown in Table 1. In this section, we analyze the importance of subsets of features by (i) training a classifier with a selected feature subset (fSet) and (ii) training a classifier excluding the selected feature subset ({All features}\{fSet}). Table 4 shows the test AUC obtained for different subsets. We see that the performance of statistical features based on MFCC alone is comparable to the use of all the features for cough and speech. For cough sounds, excluding MFCC based features from the feature set also results in a degradation in the performance, indicating that statistical features of MFCC capture the essential characteristics for classification of cough sounds. More than one subset of features gives test AUC comparable to the one using the full set for breathing and speech. However, the subsets with AUC above correspond to the broad category of spectral features.
Since multiple subsets have predictive power for breathing and speech, excluding a specific subset did not degrade the performance. The score combination of the best-performing feature categories in Table 4, i.e., -dimensional spectral roll-off features for breathing, -dimensional MFCC features for cough, and the -dimensional energy features for speech, gives a test AUC of . The above analysis suggests that the ComParE2016 features capture redundant information with good predictive power for the COVID classification task.
6 Discussion
The paper presents a novel approach to point-of-care diagnostics of COVID-19 using multi-modal data of acoustics and symptoms. The data used in this study comes from a web-based crowd-sourced data collection platform. The acoustic features are based on statistical measures of low-level acoustic descriptors while binary features are extracted from the symptom data. The proposed multi-modal diagnostic tool for COVID (MuDiCoV) is the fusion of scores from individual classifiers.
The classification models are simple linear models like logistic regression and decision tree classifiers having a small memory footprint ( kB). On the test set, the average time from input to decision was found to be secs (std. dev. secs) on a desktop computer with Intel(R) Core(TM) i7-6700 CPU @ 3.40GHz processor and GB memory. The performance (with % sensitivity at specificity) obtained on the test set surpasses the benchmark set by the Indian council of medical research (ICMR) for approval of POCT, ( sensitivity at specificity) [37]. We foresee that the use of simple classifiers and models would allow the diagnostic methods to be more interpretable. The proposed methodology combines all the advantages of being a rapid, low-cost, scalable, and remotely usable testing approach.
Acknowledgments
The authors would like to express their gratitude to Anand Mohan for the design of the web based data collection platform. The authors would like to thank Dr. Nirmala, Dr. Shrirama Bhat, Dr. Chandra Kiran and Dr. Suhail Khalid for their co-ordination in data collection. The authors would like to acknowledge Amir Poorjam and Flavio Avila for discussions on ComParE2016 features.
References
- [1] B. Hu, H. Guo, P. Zhou, and Z.-L. Shi, “Characteristics of SARS-CoV-2 and COVID-19,” Nature Reviews Microbiology, pp. 1–14, 2020.
- [2] “WHO Director-General’s opening remarks at the media briefing on COVID-19 -16 March 2020,” https://www.who.int/director-general/speeches/detail/who-director-general-s-opening-remarks-at-the-media-briefing-on-{COVID}-19---16-march-2020, 2020, [Online; accessed 20-May-2021].
- [3] V. M. Corman, O. Landt, M. Kaiser, R. Molenkamp, A. Meijer, D. K. Chu, T. Bleicker, S. Brünink, J. Schneider, M. L. Schmidt et al., “Detection of 2019 novel coronavirus (2019-ncov) by real-time RT-PCR,” Eurosurveillance, vol. 25.2000045, no. 3, 2020.
- [4] R. W. Peeling, P. L. Olliaro, D. I. Boeras, and N. Fongwen, “Scaling up COVID-19 rapid antigen tests: promises and challenges,” The Lancet infectious diseases, 2021.
- [5] A. Scohy, A. Anantharajah, M. Bodéus, B. Kabamba-Mukadi, A. Verroken, and H. Rodriguez-Villalobos, “Low performance of rapid antigen detection test as frontline testing for COVID-19 diagnosis,” Journal of Clinical Virology, vol. 129, p. 104455, 2020.
- [6] “Target product profiles for priority diagnostics to support response to the COVID-19 pandemic v.1.0 (WHO),” https://www.who.int/docs/default-source/blue-print/who-rd-blueprint-diagnostics-tpp-final-v1-0-28-09-jc-ppc-final-cmp92616a80172344e4be0edf315b582021.pdf?sfvrsn=e3747f20_1&download=true, 2020, [Online; accessed 20-May-2021].
- [7] R. T. H. Laennec and J. Forbes, A Treatise on the Diseases of the Chest, and on Mediate Auscultation. Samuel S. and William Wood, 1838.
- [8] R. X. A. Pramono, S. A. Imtiaz, and E. Rodriguez-Villegas, “A cough-based algorithm for automatic diagnosis of pertussis,” PloS one, vol. 11, no. 9, p. e0162128, 2016.
- [9] A. Windmon, M. Minakshi, P. Bharti, S. Chellappan, M. Johansson, B. A. Jenkins, and P. R. Athilingam, “TussisWatch: a smart-phone system to identify cough episodes as early symptoms of chronic obstructive pulmonary disease and congestive heart failure,” IEEE J. Biomedical and Health Informatics, vol. 23, no. 4, pp. 1566–1573, 2018.
- [10] G. Botha, G. Theron, R. Warren, M. Klopper, K. Dheda, P. Van Helden, and T. Niesler, “Detection of tuberculosis by automatic cough sound analysis,” Physiological measurement, vol. 39, no. 4, p. 045005, 2018.
- [11] P. Porter, S. Claxton, J. Brisbane, N. Bear, J. Wood, V. Peltonen, P. Della, F. Purdie, C. Smith, and U. Abeyratne, “Diagnosing chronic obstructive airway disease on a smartphone using patient-reported symptoms and cough analysis: Diagnostic accuracy study,” JMIR Formative Research, vol. 4, no. 11, p. e24587, 2020.
- [12] U. R. Abeyratne, V. Swarnkar, A. Setyati, and R. Triasih, “Cough sound analysis can rapidly diagnose childhood pneumonia,” Annals of Biomedical engineering, vol. 41, no. 11, pp. 2448–2462, 2013.
- [13] V. Swarnkar, U. R. Abeyratne, A. B. Chang, Y. A. Amrulloh, A. Setyati, and R. Triasih, “Automatic identification of wet and dry cough in pediatric patients with respiratory diseases,” Annals of biomedical engineering, vol. 41, no. 5, pp. 1016–1028, 2013.
- [14] H. I. Hee, B. Balamurali, A. Karunakaran, D. Herremans, O. H. Teoh, K. P. Lee, S. S. Teng, S. Lui, and J. M. Chen, “Development of machine learning for asthmatic and healthy voluntary cough sounds: a proof of concept study,” Applied Sciences, vol. 9, no. 14, p. 2833, 2019.
- [15] J. Li, D. Q. Huang, B. Zou, H. Yang, W. Z. Hui, F. Rui, N. T. S. Yee, C. Liu, S. N. Nerurkar, J. C. Y. Kai et al., “Epidemiology of COVID-19: A systematic review and meta-analysis of clinical characteristics, risk factors, and outcomes,” Journal of Medical Virology, vol. 93, no. 3, pp. 1449–1458, 2021.
- [16] C. Huang, Y. Wang, X. Li, L. Ren, J. Zhao, Y. Hu, L. Zhang, G. Fan, J. Xu, X. Gu, Z. Cheng, T. Yu, J. Xia, Y. Wei, W. Wu, X. Xie, W. Yin, H. Li, M. Liu, Y. Xiao, H. Gao, L. Guo, J. Xie, G. Wang, R. Jiang, Z. Gao, Q. Jin, J. Wang, and B. Cao, “Clinical features of patients infected with 2019 novel coronavirus in Wuhan, China,” The Lancet, vol. 395, no. 10223, pp. 497–506, 2020.
- [17] K. Qian, B. W. Schuller, and Y. Yamamoto, “Recent advances in computer audition for diagnosing COVID-19: An overview,” in 2021 IEEE 3rd Global Conf. Life Sciences and Technologies (LifeTech), 2021, pp. 181–182.
- [18] C. Brown, J. Chauhan, A. Grammenos, J. Han, A. Hasthanasombat, D. Spathis, T. Xia, P. Cicuta, and C. Mascolo, “Exploring automatic diagnosis of COVID-19 from crowdsourced respiratory sound data,” in Proc. 26th ACM SIGKDD International Conference on Knowledge Discovery & Data Mining, 2020, pp. 3474–3484.
- [19] L. Orlandic, T. Teijeiro, and D. Atienza, “The COUGHVID crowdsourcing dataset: A corpus for the study of large-scale cough analysis algorithms,” arXiv preprint arXiv:2009.11644, 2020.
- [20] J. Laguarta, F. Hueto, and B. Subirana, “COVID-19 artificial intelligence diagnosis using only cough recordings,” IEEE Open Journal of Engineering in Medicine and Biology, vol. 1, pp. 275–281, 2020.
- [21] N. Sharma, P. Krishnan, R. Kumar, S. Ramoji, S. R. Chetupalli, R. Nirmala, P. K. Ghosh, and S. Ganapathy, “Coswara – a database of breathing, cough, and voice sounds for COVID-19 diagnosis,” in Proc. Interspeech, 2020, pp. 4811–4815.
- [22] H. Coppock, A. Gaskell, P. Tzirakis, A. Baird, L. Jones, and B. Schuller, “End-to-end convolutional neural network enables COVID-19 detection from breath and cough audio: a pilot study,” BMJ Innovations, vol. 7, no. 2, 2021.
- [23] B. L. Y. Agbley, J. Li, A. Haq, B. Cobbinah, D. Kulevome, P. A. Agbefu, and B. Eleeza, “Wavelet-based cough signal decomposition for multimodal classification,” in 17th Intl. Computer Conference on Wavelet Active Media Technology and Information Processing). IEEE, 2020, pp. 5–9.
- [24] K. Feng, F. He, J. Steinmann, and I. Demirkiran, “Deep-learning based approach to identify COVID-19,” in SoutheastCon 2021, 2021, pp. 1–4.
- [25] J. Andreu-Perez, H. Perez-Espinosa, E. Timonet, M. Kiani, M. I. Giron-Perez, A. B. Benitez-Trinidad, D. Jarchi, A. Rosales, N. Gkatzoulis, O. F. Reyes-Galaviz, A. Torres, C. Alberto Reyes-Garcia, Z. Ali, and F. Rivas, “A generic deep learning based cough analysis system from clinically validated samples for point-of-need COVID-19 test and severity levels,” IEEE Trans. Services Computing, pp. 1–1, 2021.
- [26] A. Imran, I. Posokhova, H. N. Qureshi, U. Masood, M. S. Riaz, K. Ali, C. N. John, M. I. Hussain, and M. Nabeel, “AI4COVID-19: AI enabled preliminary diagnosis for COVID-19 from cough samples via an app,” Informatics in Medicine Unlocked, vol. 20, p. 100378, 2020.
- [27] L. Verde, G. De Pietro, A. Ghoneim, M. Alrashoud, K. N. Al-Mutib, and G. Sannino, “Exploring the use of artificial intelligence techniques to detect the presence of coronavirus COVID-19 through speech and voice analysis,” IEEE Access, vol. 9, pp. 65 750–65 757, 2021.
- [28] C. Menni, A. M. Valdes, M. B. Freidin, C. H. Sudre, L. H. Nguyen, D. A. Drew, S. Ganesh, T. Varsavsky, M. J. Cardoso, J. S. El-Sayed Moustafa, A. Visconti, P. Hysi, R. C. E. Bowyer, M. Mangino, M. Falchi, J. Wolf, S. Ourselin, A. T. Chan, C. J. Steves, and T. D. Spector, “Real-time tracking of self-reported symptoms to predict potential COVID-19,” Nature Medicine, vol. 26, pp. 1037–1040, 2020. [Online]. Available: https://doi.org/10.1038/s41591-020-0916-2
- [29] Y. Zoabi, S. Deri-Rozov, and N. Shomron, “Machine learning-based prediction of COVID-19 diagnosis based on symptoms,” npj Digital Medicine, vol. 4, no. 1, pp. 1–5, 2021.
- [30] H. B. Curry, “The method of steepest descent for non-linear minimization problems,” Quarterly of Applied Mathematics, vol. 2, no. 3, pp. 258–261, 1944. [Online]. Available: http://www.jstor.org/stable/43633461
- [31] J. C. Platt, “Probabilistic outputs for support vector machines and comparisons to regularized likelihood methods,” in Advances in Large Margin Classifiers. MIT Press, 1999, pp. 61–74.
- [32] A. J. Myles, R. N. Feudale, Y. Liu, N. A. Woody, and S. D. Brown, “An introduction to decision tree modeling,” Journal of Chemometrics: A Journal of the Chemometrics Society, vol. 18, no. 6, pp. 275–285, 2004.
- [33] B. Schuller, S. Steidl, A. Batliner, J. Hirschberg, J. K. Burgoon, A. Baird, A. Elkins, Y. Zhang, E. Coutinho, and K. Evanini, “The INTERSPEECH 2016 computational paralinguistics challenge: Deception, sincerity & native language,” in Proc. of Interspeech, 2016, pp. 2001–2005.
- [34] F. Eyben, M. Wöllmer, and B. Schuller, “Opensmile: The munich versatile and fast open-source audio feature extractor,” in Proc. 18th ACM Intl. Conf. Multimedia, 2010, p. 1459–1462.
- [35] F. Weninger, F. Eyben, B. Schuller, M. Mortillaro, and K. Scherer, “On the acoustics of emotion in audio: What speech, music, and sound have in common,” Frontiers in Psychology, vol. 4, p. 292, 2013.
- [36] F. Pedregosa, G. Varoquaux, A. Gramfort, V. Michel, B. Thirion, O. Grisel, M. Blondel, P. Prettenhofer, R. Weiss, V. Dubourg, J. Vanderplas, A. Passos, D. Cournapeau, M. Brucher, M. Perrot, and E. Duchesnay, “Scikit-learn: Machine learning in Python,” Journal of Machine Learning Research, vol. 12, pp. 2825–2830, 2011.
- [37] “ICMR Rapid Antigen Test Kits for COVID-19 (Oropharyngeal / Nasopharyngeal swabs) - 28 May 2021,” https://www.icmr.gov.in/pdf/covid/kits/List_of_rapid_antigen_kits_28052021.pdf, 2021, [Online; accessed 29-May-2021].