marginparsep has been altered.
topmargin has been altered.
marginparwidth has been altered.
marginparpush has been altered.
The page layout violates the ICML style.
Please do not change the page layout, or include packages like geometry,
savetrees, or fullpage, which change it for you.
We’re not able to reliably undo arbitrary changes to the style. Please remove
the offending package(s), or layout-changing commands and try again.
Quantification of Carbon Sequestration in Urban Forests
Anonymous Authors1
Preprint. Work in progress.
Abstract
Vegetation, trees in particular, sequester carbon by absorbing carbon dioxide from the atmosphere. However, the lack of efficient quantification methods of carbon stored in trees renders it difficult to track the process. We present an approach to estimate the carbon storage in trees based on fusing multi-spectral aerial imagery and LiDAR data to identify tree coverage, geometric shape, and tree species—key attributes to carbon storage quantification. We demonstrate that tree species information and their three-dimensional geometric shapes can be estimated from aerial imagery in order to determine the tree’s biomass. Specifically, we estimate a total of tons of carbon sequestered in trees for New York City’s borough Manhattan.
1 Introduction
Recent environmental reports underline the pressing need for the elimination of Green House Gases (GHG) from the atmosphere in order to bring the carbon dioxide level to the pre-industrial norm IPCC . Carbon removing techniques span from scrubbing emission sources, manufacturing carbon trapping materials, and sequestering carbon in trees or soil. One popular idea proposed recently is the afforestation of 900 billion hectares of land Bastin et al. (2019), which has the potential to offset more than 200 megatons of carbon from the atmosphere. In the emerging carbon trading market, companies may purchase forested land to offset their GHG emission and reduce carbon footprintsLütjens et al. (2019). There is a need for tools and platforms able to quantify in near real time and track GHG emissions and total carbon offsets. Such tools may need to estimate the total carbon stored in trees or in soil multiple times a year to support a fair and transparent carbon trading market.
Currently, carbon sequestration is estimated by a plethora of proprietary tools and models, making it hard to compare side by side carbon sequestration models. Carbon storage estimates typically rely on generic models where shape, density, and species distribution of trees is surveyed from small sample plots. Subsequently, figures on larger geographies and environments get extrapolated Sileshi (2014).
The maximum amount of carbon captured by a tree is predominantly limited by its geometric size which, in turn, is bounded by physics such as water transport from roots to leaves Koch et al. (2004). Hence, knowledge of tree coverage, their geometric sizes and species characteristics is crucial in providing accurate carbon storage estimates. At the same time the task is technically challenging since such information is not readily available for the majority of locations on the planet Chave et al. (2014).
In this work, we propose to exploit remote sensing data in order to determine tree coverage, estimate tree’s geometric shapes & species to ultimately quantify the carbon sequestration in those trees at scale. Specifically, we train machine learning models to analyze aerial imagery to determine tree coverage, to classify their species, and to determine the local allometric relation for each tree species. LiDAR data from a sample region is utilized to locally calibrate the biomass estimation model. Model inference does not require LiDAR data. Hence, the learnt relation may get exploited in regions with only aerial imagery available. As an illustration, we generate a high-resolution map of carbon sequestration in New York City’s urban forest.
2 Related work
Tree allometric estimation.
The allometric scaling relates tree height to tree crown diameter, and tree dimensions to tree biomass. Such correlations are common practice in forestry research Chave et al. (2005). Estimates of tree dimensions is important to infer the total biomass which, in turn, relates to the carbon stored in trees. The literature poses the quest to establish a generic scaling law correlating tree height with tree lateral dimensions Klein et al. (2019) to better estimate the above ground biomass Chave et al. (2014). Since the scaling relation strongly depends on tree species and tree age in addition to the locations trees grow in (urban vs. rural areas), carbon estimate models need local calibration based on tree species and geographical conditions.
Tree species classification.
Quantification of carbon sequestered in trees is limited by the detailed knowledge of the tree’s geometrical dimensions and their species. Current advances in image processing enable plot-level tree classification including estimates of tree size Guan et al. (2015). We propose to generalize the image-based estimation method to identify individual trees, and to classify their species Zhou & Klein (2020) for urban forests exploiting only aerial imagery accompanied by labeled tree species data.
Tree total biomass.
Estimates of carbon captured in trees are based on knowing the tree’s volume and its wood density which, in turn, strongly depends on the tree species. In order to determine the volume, the tree crown diameter and the tree height need to be determined along with the tree species. The above ground biomass (AGB) may get approximated by Chave et al. (2005):
| (1) |
where represents tree height, denotes tree canopy diameter, specifies the tree dry mass density, and is a form factor that takes into account the tree’s shape. The shape factor typically varies in to depending on the trunk’s shape Chave et al. (2014).
The below ground biomass (BGB) is assumed as Cairns et al. (1997) and the total biomass of a tree is specified by the sum of AGB and BGB, i.e. .
3 Method
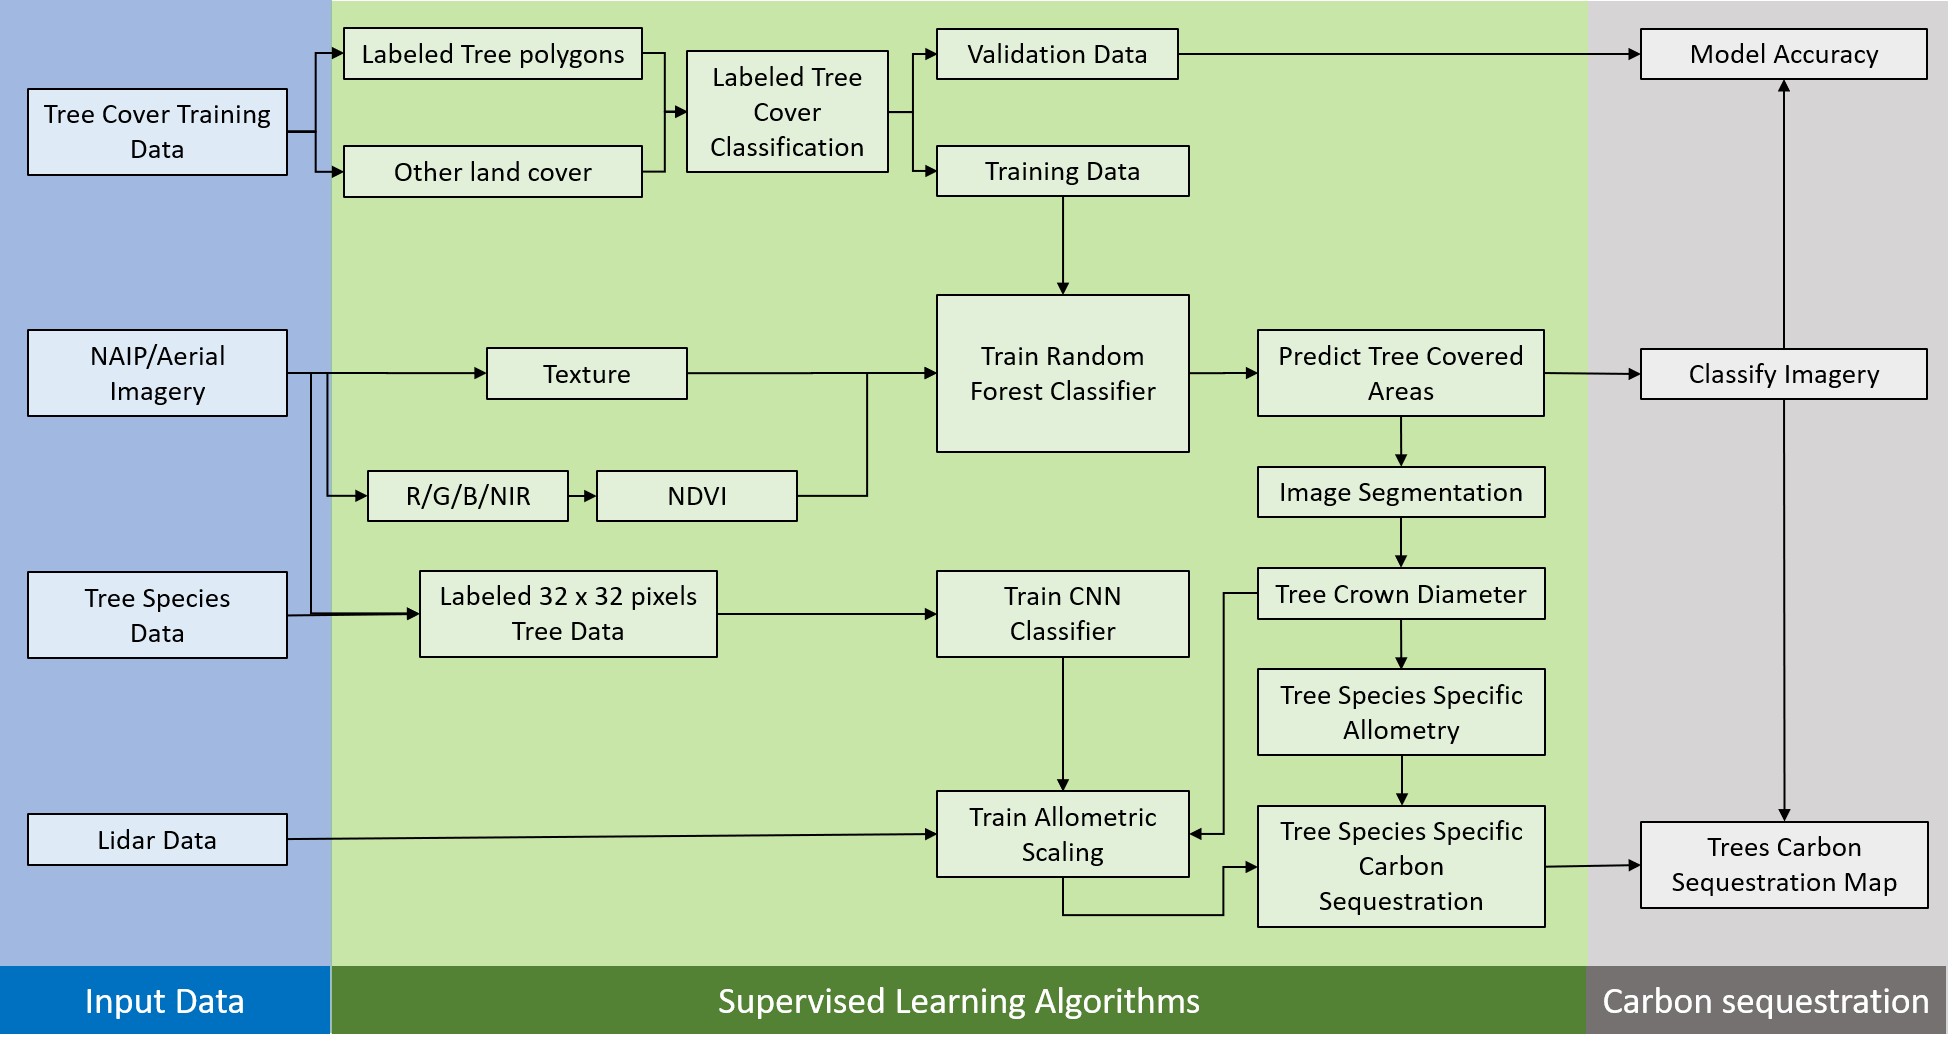
Our pipeline for quantification of carbon sequestration employ aerial imagery and LiDAR data. Fig. 1 illustrates the data processing steps and machine learning models applied in order to determine tree coverage, tree geometric sizes, and tree species for carbon sequestration estimates. The main machine learning components are: (1) a Random Forest Classifier to identify tree-covered areas combined with image segmentation to delineate individual trees, (2) Deep Learning models to classify tree species, and (3) a carbon calculator tool to estimate the total biomass and carbon sequestered in trees.
3.1 Data
2D Imagery.
The National Agriculture Imagery Program (NAIP) acquires aerial imagery every other year at a spatial resolution of 0.6 m on U.S. national scale. Multi-spectral bands of red, green, blue and near-infrared are simultaneously collected during full leaves season. NAIP has been consistently collected for the past two decades, making the data source an excellent candidate to track tree coverage, tree growths, and to detect changes in land coverage.
3D LiDAR.
LiDAR 3D point clouds are used to extract tree heights, and to calibrate the allometric relations for each tree species. Compared to aerial imagery, LiDAR data is much more expensive to collect, thus unavailable for a major fraction of geographies. Therefore, it is critical to estimate tree height from 2D imagery in order to scale to large geographies where only aerial imagery is readily available.
Tree Species.
Labeled tree species data is available from many municipalities NYC-Street-Tree-Map (2015) as part of their effort to quantify the benefit of urban forests OpenTrees.org . Typically, data collection is crowd-sourced with specific tree attributes getting captured such as: tree species, tree location, and diameter at breast height.
3.2 Tree detection and segmentation
We utilize spectral information from remote sensing images to delineate trees from other land cover classes. Employing the red and near-infrared spectral information, we compute the Normalized Difference Vegetation Index (NDVI) Pettorelli (2013) from the NAIP imagery. The NDVI is commonly used to separate vegetation from other classes like roads, buildings, bare land, and/or water. Within the vegetation class, sub-classification is achieved by training a Random Forest (RF) model to distinguish trees from grasses or bushes after incorporating additional information like image texture.
Once the tree mask is generated, segmentation algorithms such as “watershed” Wang et al. (2004) is applied to cluster pixels that share common spectral and textural characteristics. The clustered pixels is converted to (vector) polygons for identification of the tree crown boundary in order to determine the canopy diameter. Tree crown diameters are then used to correlate against tree heights to separately establish the allometric equation for each tree species.
3.3 Tree height estimation
By virtue of a tree species-specific allometric equation, the height of a tree may get estimated from its crown diameters. In our work, the allometric equation is modeled by a linear fit111In some cases a more complex relationship may exist between tree crown diameter and tree height Chave et al. (2005). Accordingly, the linear approximation may over or under represent biomass estimates. mapping the crown size extracted from NAIP imagery to the tree height ground truth extracted from LiDAR data. Once established, the model is applied to areas where no LiDAR data is available.
3.4 Tree species classification
Since tree species information is vital to estimate carbon storage, we train a convolutional neural network (CNN) to classify tree species from NAIP imagery. In our approach, the NAIP images get diced into tiles. In contrast to standard models of RGB channels, we harness all four spectral bands of the NAIP imagery. The neural network represents a modified ResNet34 He et al. (2016) which allows four-channel images as input. The training data is pre-processed by cropping the NAIP data centered around each location of the labeled trees. The trained model is run across all target areas to generate corresponding tree species maps.
3.5 Carbon sequestration
We assume the carbon stored is equivalent to about 50% of the total biomass of a tree Thomas & Martin (2012). The AGB can be calculated for each tree based on crown diameter and its corresponding height estimation. Based on our discussion in Sec. 2, the carbon sequestered in trees approximately follows .
4 Experiments and Results
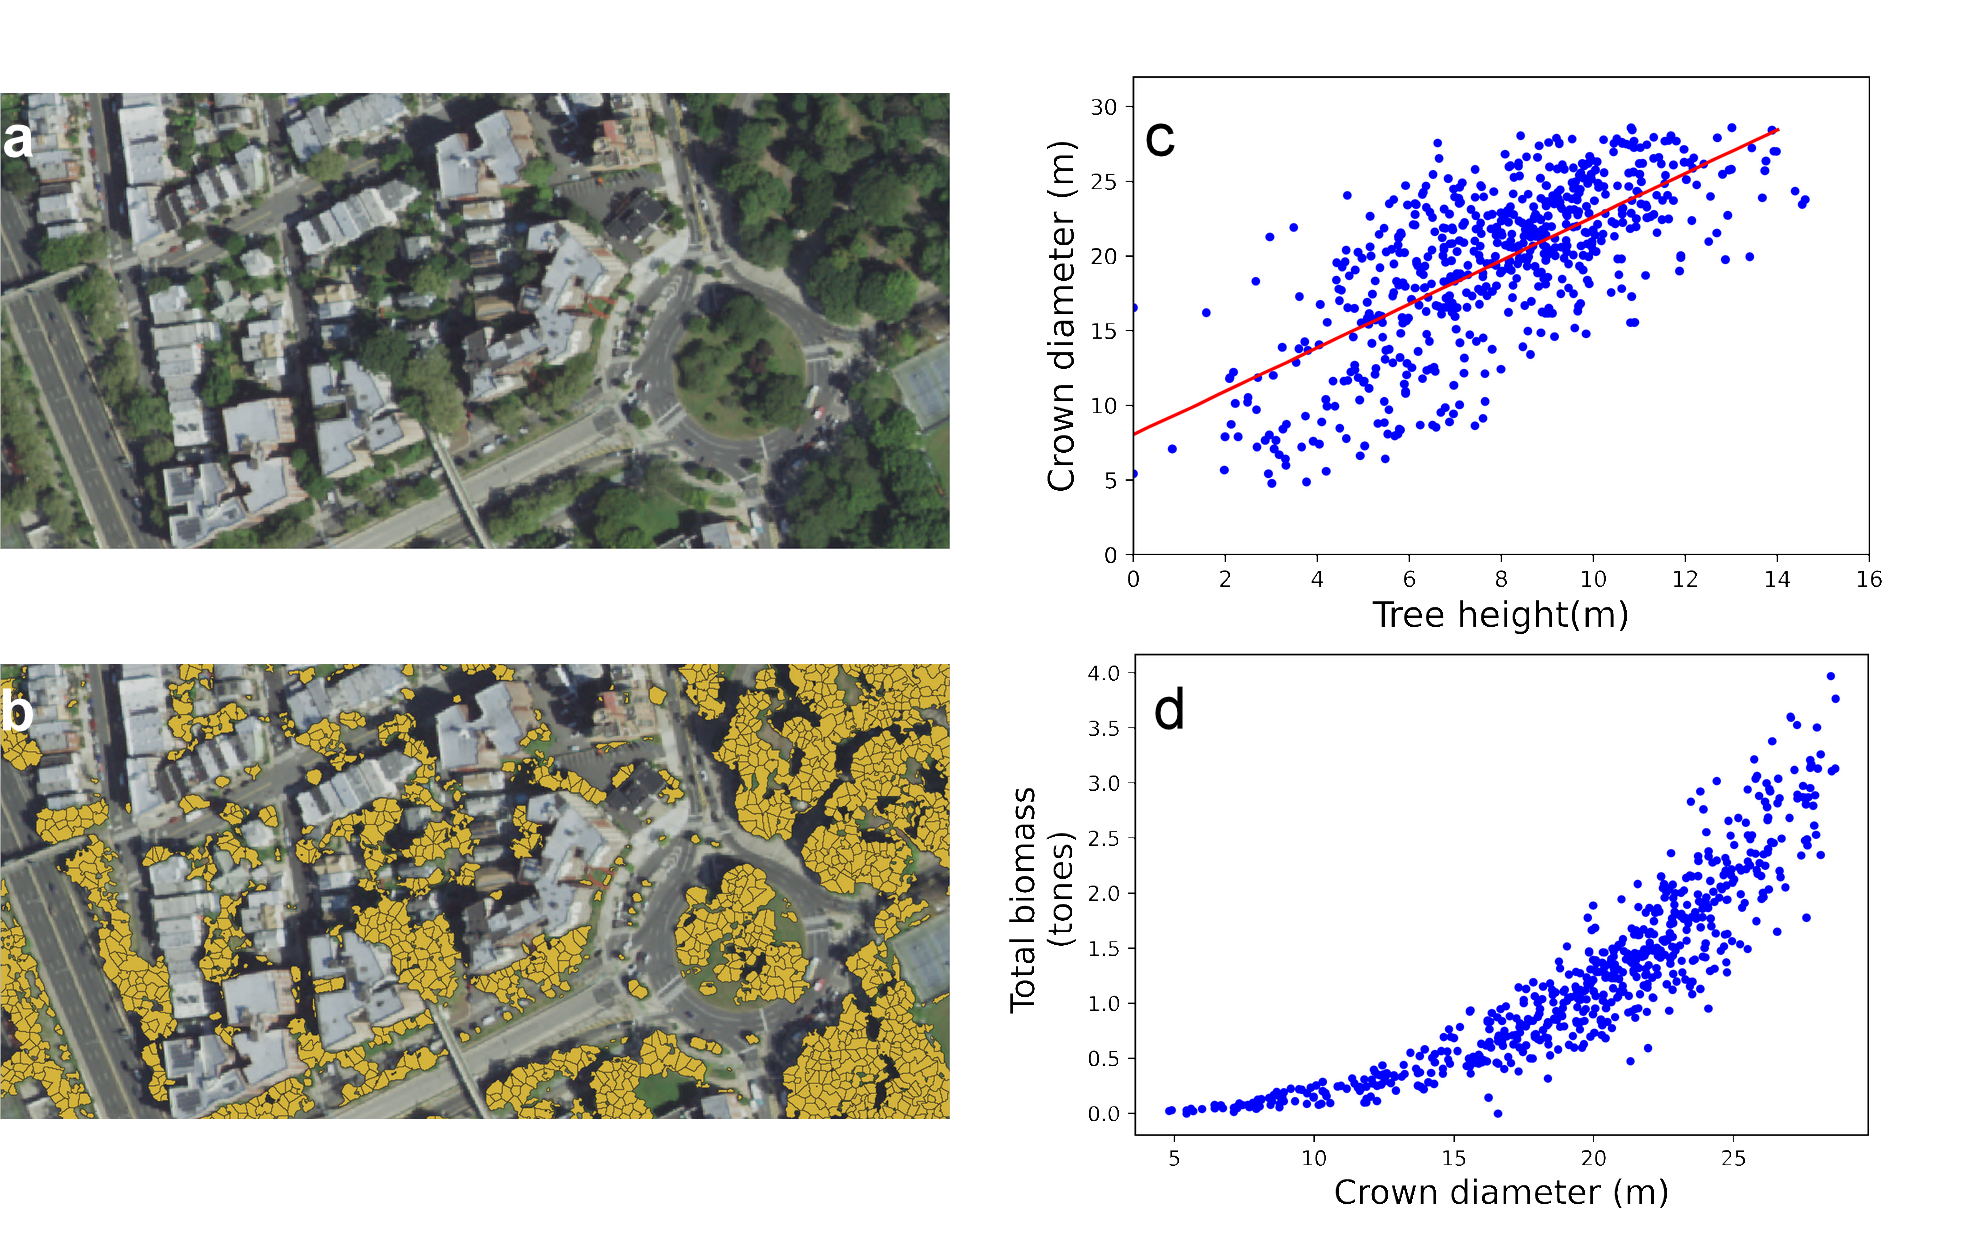
We apply our pipeline to the New York City (NYC) area to demonstrate our process of carbon sequestration quantification. LiDAR data was acquired in 2017 over Staten Island borough, NYC NYC-LiDAR , and tree species data was collected across all five boroughs in NYC in 2015 along the public roads, only NYC-Street-Tree-Map (2015). Trees not close to roads did not get a record in the survey—including those in parks and private properties. We processed a total of 56 NAIP tiles 50 km by 50 km in size, a total of about 50 GB in data volume. A sample view of the RGB composite depicts Fig. 2a.
Concerning tree delineation, an RF classifier is used to discriminate two classes—tree vs. anything else. Training data is manually labeled and gets employed to train the RF model that generates a tree coverage map. Once the tree-covered area is separated from the other land, individual trees is delineated by means of the watershed segmentation method. Fig. 2b serves as illustration. Finally, the tree crown diameter is calculated based on the assumption that the crown renders approximately circular in shape, and that the diameter is proportional to the square root of the crown polygon’s area.
| Tree type | Label | # points | (kg/m3) |
|---|---|---|---|
| London plane tree | 0 | 55,903 | 560 |
| Honeylocust | 1 | 43,974 | 755 |
| Callery pear | 2 | 42,384 | 690 |
| Pin oak | 3 | 30,575 | 705 |
| Total | 172,876 |
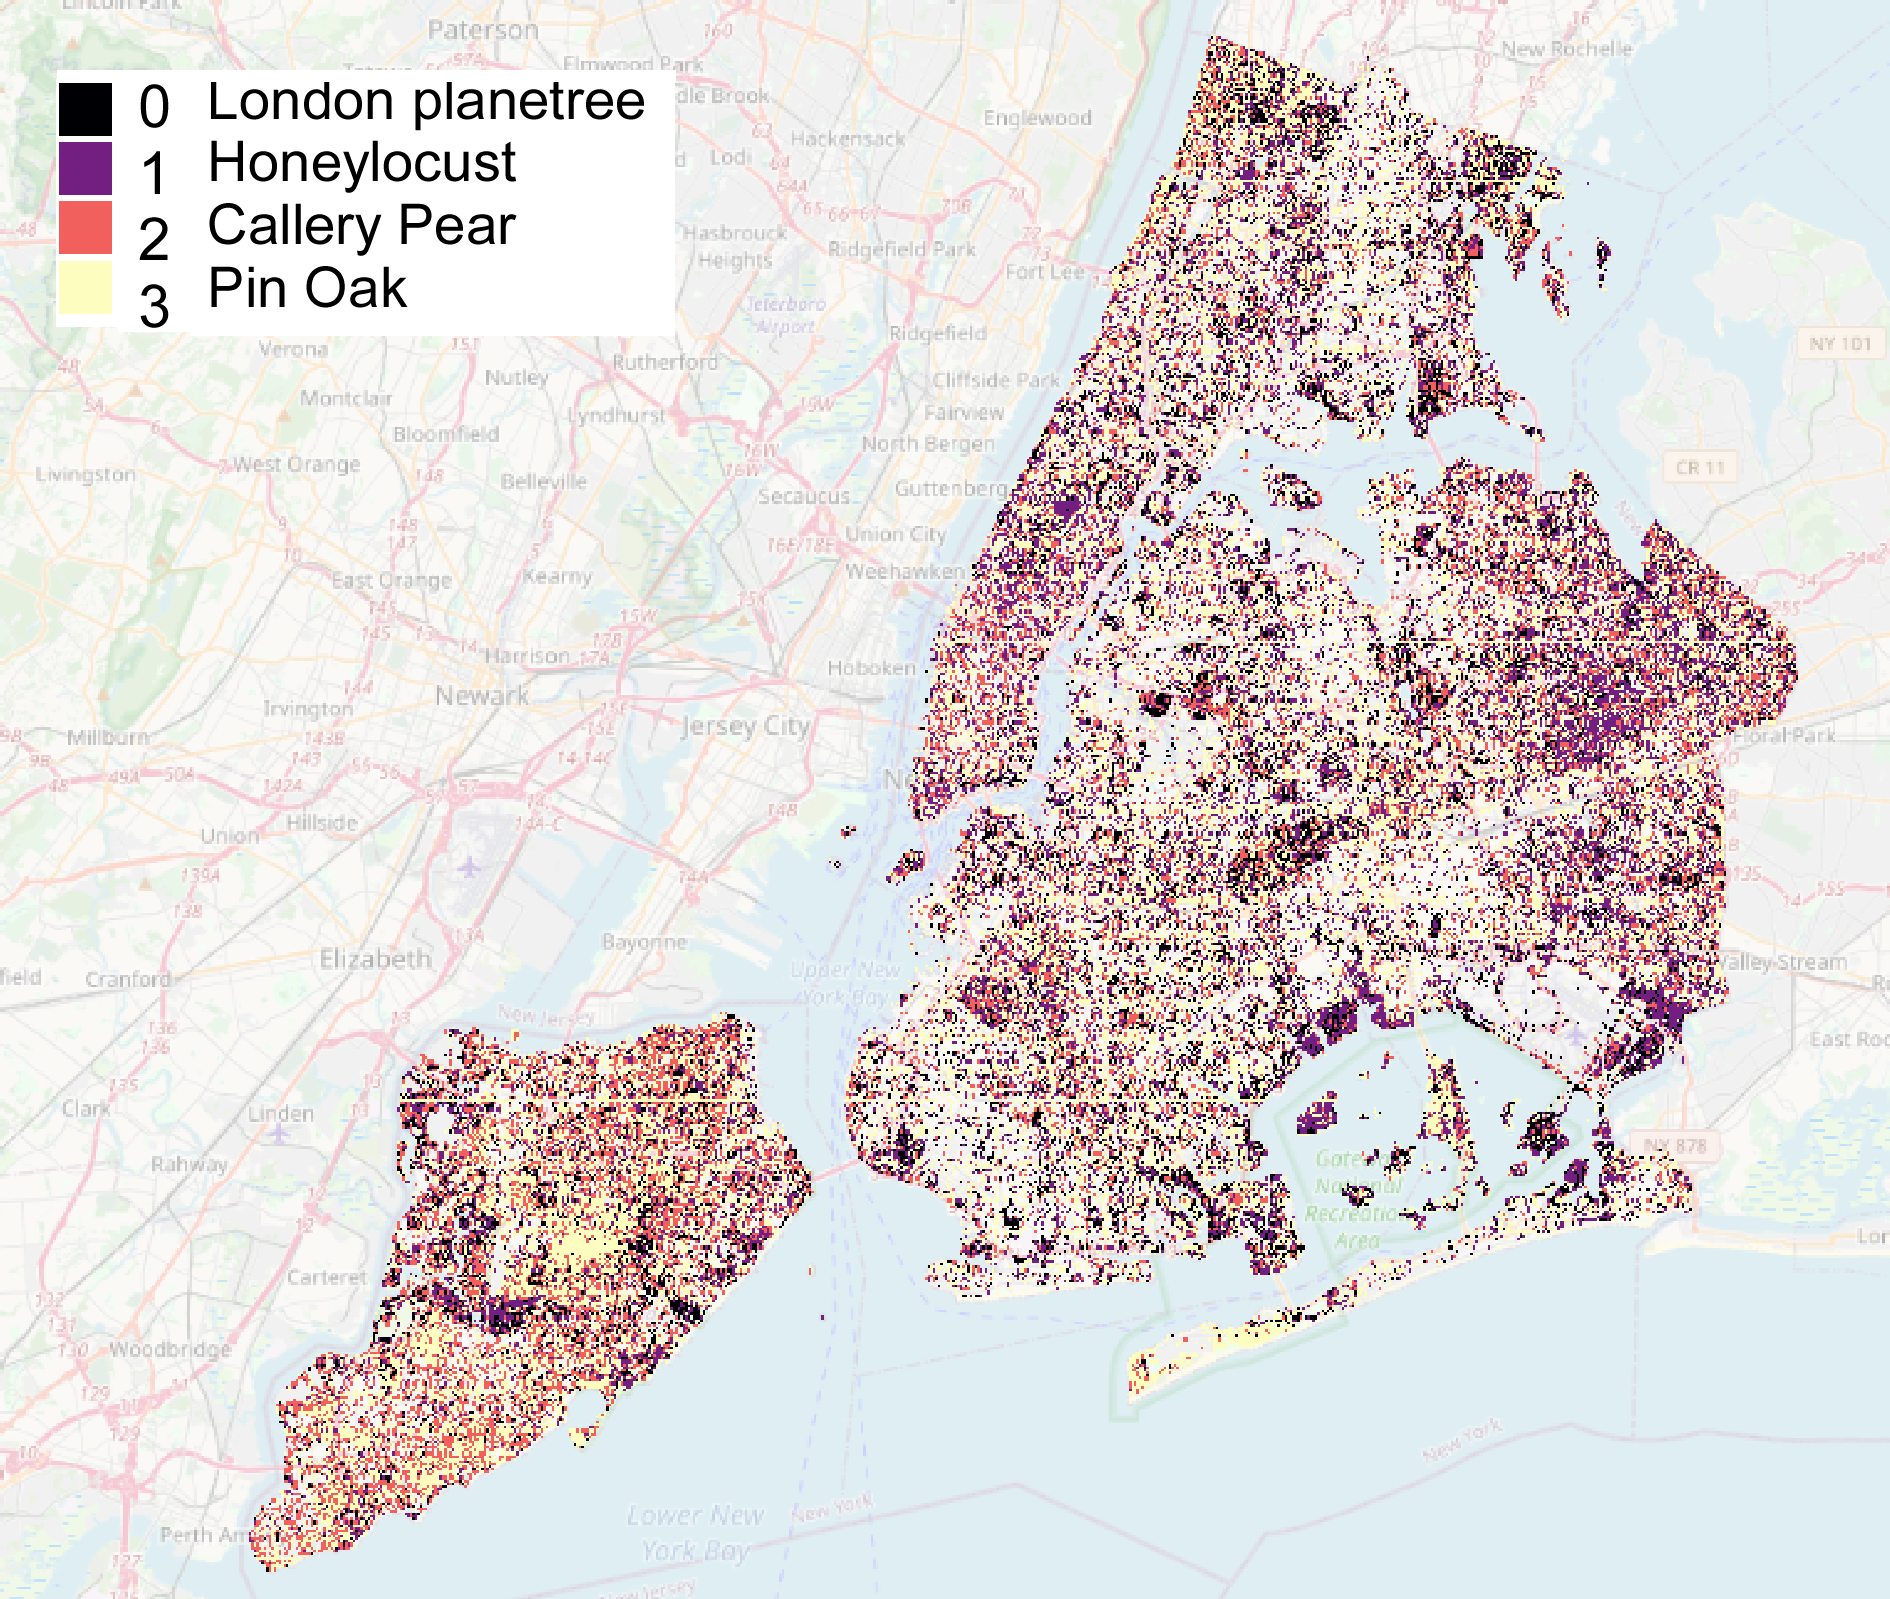
We reuse the same NAIP tiles for tree species classification. The dominant four species in NYC are sampled to generate the training data, as listed in Tab. 1. The model achieves a classification accuracy of 80% on the test split. The model is then applied across all the NAIP data after splitting into tiles, cf. Zhou et al. (2020) for details. The ones with a mean NDVI value lower than zero get discarded222typically non-vegetation areas like buildings, roads, water body, etc.. A sample tree species classification map is shown in Fig. 3. The tree species of each tree’s crown polygon derives from pixel-based majority vote.
In the next step we estimate tree heights from crown diameters. We first process the LiDAR point cloud to generate a canopy height model resulting in a height-from-ground map. For each crown polygon, we query multiple points against the LiDAR height map in order to define the corresponding mean as ground truth. Then, we derive a linear regression of the tree crown diameter vs. the tree height for each tree species. This process assembles a training data set from the LiDAR-covered areas. The linear regression curves (cf. Fig. 2c) infer the tree height from the crown polygons.
The above-ground biomass is calculated for each tree based on crown diameter and tree height taking into account the tree-specific density as listed in Tab. 1 World-Agroforestry . We set the form factor for each tree species to , and we estimate the AGB based on Eq. 1. Total biomass depends on tree sizes as depicted by Fig. 2d for Pin oaks.
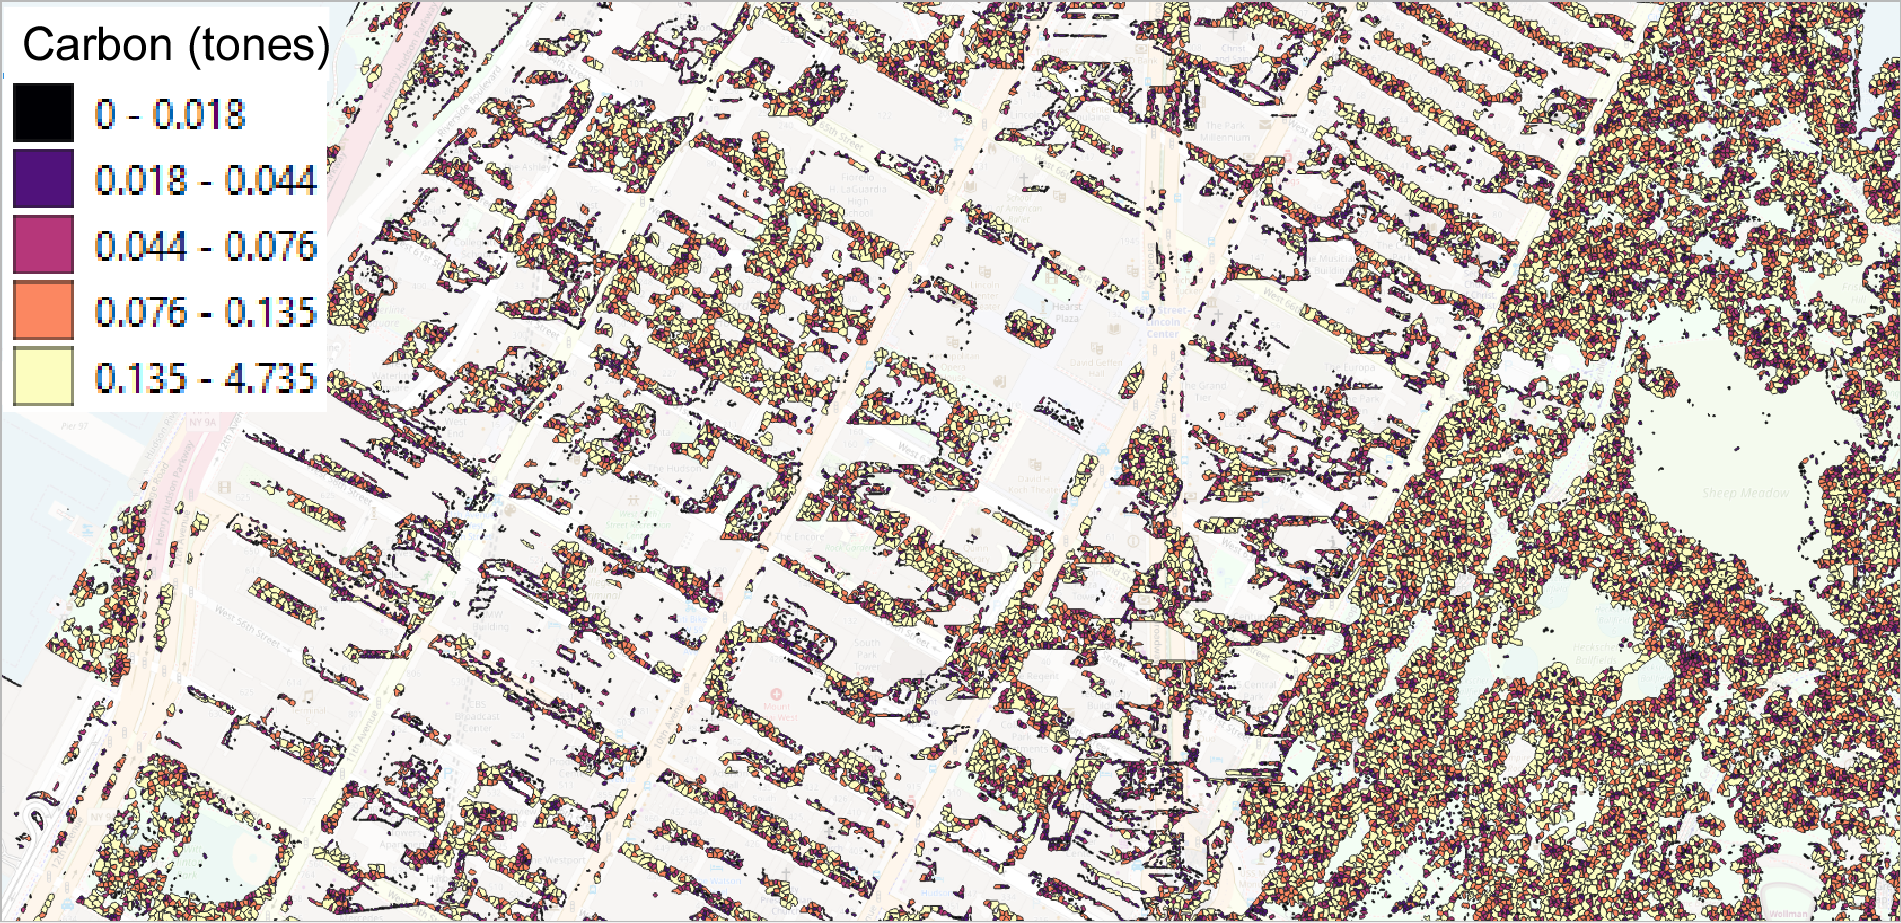
A resulting map of carbon sequestered in trees is depicted by Fig. 4 for the area of the Upper West Side in Manhattan, NYC. We estimate the total amount of carbon stored in the urban forests of Manhattan to about tons. We base this calculation on summing up the results of each individual tree segmented in the NAIP data. Nowak et al. (2018) approximates 1.2 million tons for the total carbon stored in the whole of NYC’s urban forests. Breaking down this figure in proportion to the ratio of the number of trees in Manhattan versus the total number of such in NYC, the carbon stored in Manhattan trees is tons. Carbon sequestration in Manhattan neighborhood trees is quantitatively consistent with our estimation to the order of magnitude.
5 Conclusions
Precise quantification of carbon sequestration on individual tree level may enable an improved carbon trading marketplace where such information is shared in aggregated figures, only. Here we demonstrated an approach to estimate carbon stored in urban forests built on public data sets. We use aerial imagery, high-quality 3D LiDAR point cloud data, and tree species surveys to build high-resolution carbon sequestration maps. The methodology allows to map carbon sequestered by individual trees for subsequent aggregation to the level of city street to continental scale.
Broader Impact
Carbon trading markets and GHG offset require transparent and verifiable methods to quantify the total carbon sequestration. The “bottom-up” approach introduced in this work is able to estimate total amounts of carbon sequestered in trees. As a valuable result, a temporal sequence of spatial maps indicating the carbon density captured by (sub-)urban forests may track changes in carbon sequestration on an annual basis.
References
- Bastin et al. (2019) Bastin, J., Finegold, Y., Garcia, C., Mollicone, D., Rezende, M., Routh, D., Zohner, C., and et al, T. C. The global tree restoration potential. Science, 365(6648):76–79, 2019.
- Cairns et al. (1997) Cairns, M. A., Brown, S., Helmer, E. H., and Baumgardner, G. A. Root biomass allocation in the world’s upland forests. Oecologia, 111(1):1–11, 1997.
- Chave et al. (2005) Chave, J., Andalo, C., Brown, S., and et al. Tree allometry and improved estimation of carbon stocks and balance in tropical forests. Oecologia, 145(1):87–99, 2005.
- Chave et al. (2014) Chave, J., Réjou‐Mécha, M., Búrquez, A., Chidumayo, E., Colgan, M., Delitti, W., and et al. Improved allometric models to estimate the aboveground biomass of tropical trees. Global change biology, 20(10):3177–3190, 2014.
- Guan et al. (2015) Guan, H., Yu, Y., Ji, Z., Li, J., and Zhang, Q. Deep learning-based tree classification using mobile lidar data. Remote Sensing Letters, 6(11):864–873, 2015.
- He et al. (2016) He, K., Zhang, X., Ren, S., and Sun, J. Deep residual learning for image recognition. In Proceedings of the IEEE conference on computer vision and pattern recognition, pp. 770–778, 2016.
- (7) IPCC. The intergovernmental panel on climate change. URL https://www.ipcc.ch/.
- Klein et al. (2019) Klein, L. J., Albrecht, C. M., Zhou, W., Siebenschuh, C., Pankanti, S., Hamann, H. F., and Lu, S. N-dimensional geospatial data and analytics for critical infrastructure risk assessment. In IEEE International Conference on Big Data (Big Data), pp. 5637–5643, 2019.
- Koch et al. (2004) Koch, G. W., Sillett, S. C., Jennings, G. M., and Davis, S. D. The limits to tree height. Nature, 428(6985):851–854, 2004.
- Lütjens et al. (2019) Lütjens, B., Liebenwein, L., and Kramer, K. Machine learning-based estimation of forest carbon stocks to increase transparency of forest preservation efforts. arXiv:1912.07850, 2019.
- Nowak et al. (2018) Nowak, D., Bodine, A. R., and et al. The urban forest of new york city. Technical Report 117, Newtown Square, PA: US Department of Agriculture, Forest Service, Northern Research Station, 2018.
- (12) NYC-LiDAR. Topobathymetric lidar data (2017). URL https://data.cityofnewyork.us/City-Government/Topobathymetric-LiDAR-Data-2017-/7sc8-jtbz.
- NYC-Street-Tree-Map (2015) NYC-Street-Tree-Map. New york city street tree map. Technical report, New York City, NY, 2015. URL https://tree-map.nycgovparks.org/.
- (14) OpenTrees.org. Opentrees. URL https://www.OpenTrees.org.
- Pettorelli (2013) Pettorelli, N. The normalized difference vegetation index. Oxford University Press, 2013.
- Sileshi (2014) Sileshi, G. A critical review of forest biomass estimation models, common mistakes and corrective measures. Forest Ecology and Management, 329:237–254, 2014.
- Thomas & Martin (2012) Thomas, S. and Martin, A. Carbon content of tree tissues: a synthesis. Forests, 3(2):332–352, 2012.
- Wang et al. (2004) Wang, L., Gong, P., and Biging, G. S. Individual tree-crown delineation and treetop detection in high-spatial-resolution aerial imagery. Photogrammetric Engineering & Remote Sensin, 70(3):351–357, 2004.
- (19) World-Agroforestry. Icraf database. URL http://db.worldagroforestry.org//wd.
- Zhou & Klein (2020) Zhou, W. and Klein, L. J. Monitoring the impact of wildfires on tree species with deep learning. arXiv:2011.02514, 2020.
- Zhou et al. (2020) Zhou, W., Klein, L. J., and Lu, S. PAIRS AutoGeo: an automated machine learning framework for massive geospatial data. In IEEE International Conference on Big Data (Big Data), 2020.