Isotopic analysis of 295 MeV proton scattering off 204,206,208Pb for improvement of neutron densities and radii
Abstract
A new method of reaction analysis for proton elastic scattering is proposed, combining systematic analyses of nuclear structure and reactions in a series of isotopes. This method is applied to , , and at MeV to obtain improved neutron densities and radii from experimental cross section data. The reaction calculation is performed according to the relativistic impulse approximation using the modified Murdock and Horowitz model with density-dependent effective interaction. Analysis of Pb isotopes is performed using theoretical densities given by the relativistic Hartree-Bogoliubov and nonrelativistic Skyrme Hartree-Fock-Bogoliubov calculations and the experimental density extracted from the data at 295 MeV. The isotopic ratios () of the -to- cross sections are analyzed in connection with the isotopic differences ( and ) in neutron densities and radii between and . A hole-model analysis is performed, assuming and as a core and neutron holes to clarify the one-to-one correspondence between isotopic structure properties such as and and the isotopic cross-section ratio. By fitting , the values of and are extracted from the experimental cross section data with less uncertainty of the structure and reaction models. The isotopic neutron radius difference between and was obtained as fm with an acceptable range of fm.
I Introduction
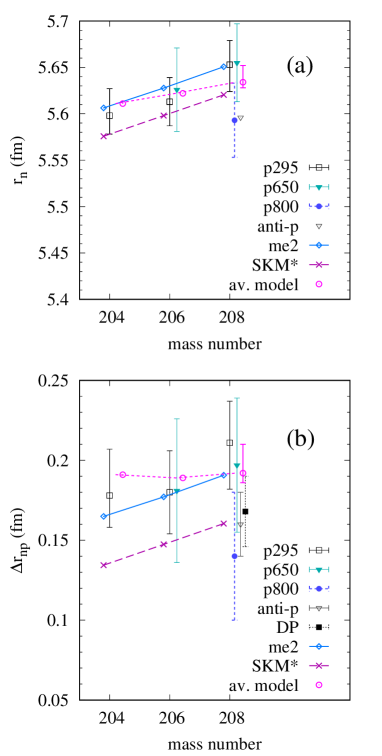
The neutron skin thickness in nuclei—which is defined as the difference between the root-mean-square (rms) point-proton () and neutron radii — has long been intensively investigated through experimental and theoretical studies. The experimental determination of in double closed nuclei such as , , and is an urgent issue for accessing to the neutron matter EOS via the connection between and the symmetry energy parameters Roca-Maza et al. (2011); Roca-Maza and Paar (2018); Tsang et al. (2012). Various experimental approaches have been applied for measuring . For stable nuclei, point-proton radii and density distributions can be precisely determined from the charge radii and form factors measured by electric probes such as the isotope shift of rays and electron scattering. However, measuring neutron radii is relatively difficult; hence, the data still contain large experimental errors. Many experimental efforts have been made to determine the of by measuring proton elastic scattering Starodubsky and Hintz (1994); Zenihiro et al. (2010), -ray cascade from antiprotonic atoms Klos et al. (2007), parity-violating electron scattering Abrahamyan et al. (2012), and pionic probes Friedman (2012); Tarbert et al. (2014). The electric dipole polarization measured by polarized proton inelastic scattering Tamii et al. (2011) is an alternative approach for determining Piekarewicz et al. (2012).
The observed data were used to extract information for the neutron matter EOS based on nuclear density functional theory (DFT) by comparing the data with theoretical predictions of calculated using a variety of relativistic and nonrelativistic energy density functionals. In extracting infinite matter properties from nuclear observables using DFT, it is essential to reduce model dependences mainly originating in finite-size effects such as surface contributions and shell effects in Centelles et al. (2010).
Proton elastic scattering is a useful tool for investigating the detailed profile of the neutron-density distribution as used for nuclei in wide mass-number regions. The neutron-density distribution of was extracted from the data at 800 MeV Ray et al. (1978); Ray (1979); Hoffmann et al. (1980), 650 MeV Starodubsky and Hintz (1994), and 295 MeV Zenihiro et al. (2010). For reaction analyses of proton elastic scattering at several hundreds of MeV, a reaction model based on the relativistic impulse approximation (RIA) framework with meson-exchange effective interactions was proposed by Murdock and Horowitz (MH model); this model is based on globally fitting the data in the –400 MeV energy range Horowitz (1985); Murdock and Horowitz (1987); Horowitz et al. (1991). The RIA code with the MH model has been widely used to investigate neutron density based on data. Later, an improved version, the density-dependent MH model (ddMH) was proposed by Sakaguchi and his collaborators, introducing density dependences of the effective interaction Sakaguchi et al. (1998); Terashima et al. (2008); Zenihiro et al. (2010). The ddMH model was finely calibrated to 295 MeV proton elastic scattering off at scattering angles of up to , and proton elastic scattering off the Sn Terashima et al. (2008), Pb Zenihiro et al. (2010), and Ca Zenihiro et al. (2018) isotopes was successfully described. By taking high-quality measurements of the proton elastic scattering off , , and at 295 MeV, the neutron densities were extracted via reaction analysis using RIA with the ddMH model and the values in a series of Pb isotopes were obtained Zenihiro et al. (2010).
However, the values of the Pb isotopes determined by the data still contain significant experimental errors, mainly because of the large uncertainty of the extracted neutron density in the internal region, to which proton scattering at several hundreds of MeV is insensitive Piekarewicz and Weppner (2006). To avoid the uncertainty in extracted from the data, a new method based DFT was proposed to evaluate the symmetry-energy parameters by comparing the surface-neutron-density profile of the theoretical predictions with the experimental density extracted from the data instead of , and it was applied to analysis of the and densities Yoshida et al. (2020). Alternatively, a more direct approach between the data and matter information through a comparison of the experimental cross sections with theoretical predictions obtained by reaction calculations using DFT densities may be worth considering.
Our aim in this paper is to propose a new reaction analysis method for the proton elastic scattering measured in a series of isotopes to obtain improved neutron density and radii from the data. Because of the similarities between neighboring nuclei, a perturbative treatment is possible, and relative differences between neighboring nuclei can be easily detected with less uncertainty in principle. Therefore, a systematic analysis combining the data in a series of neighboring isotopes can be a better tool than independent analyses because it can significantly reduce systematic errors. A similar concept is often used, for instance, to determine of charge-radius differences by measuring the isotope shift of rays. For proton scattering, an isotopic analysis was performed to discuss neutron-density differences Ray (1979); however, an important innovation of the present work is that it combines the isotopic properties of nuclear structure with those of nuclear reaction—that is an isotopic analysis of the scattering cross sections is performed to extract structural differences between isotopes via reaction calculations. For electron elastic scattering, an isotopic analysis of the cross sections has been performed to discuss the isotopic difference in the charge radius Roca-Maza et al. (2008); however, its application is limited. Little work has been done on proton elastic scattering, except for a brief discussion of the isotopic cross-section ratio and size scaling of the proton-nucleus potential Hoffmann et al. (1990).
In this paper, I propose a new approach using isotopic analysis of the proton elastic scattering cross sections. Based on isotopic systematics in nuclear structures and reactions. In the ground state of even-even nuclei, the nuclear structure changes smoothly in a series of isotopes without drastic changes, other than crossing a shell gap or phase transition for nuclear deformation. Moreover, the reaction processes of neighboring isotopes at the same energy should be similar, provided that the projectile energy is high enough to neglect the mass-number dependence of higher-order effects such as channel-coupling effects in the proton scattering. Another advantage of this approach is that, experimental systematic errors can be significantly reduced using the observed data in a series of isotopes measured experimentally with the same setup in the same facility.
For isotopic analysis, the reaction calculations of , , and at MeV were performed via RIA calculation using the ddMH model in the same way as was done in the analysis of Ref. Zenihiro et al. (2010). As for the target densities in the reaction calculation, the theoretical densities of the Pb isotopes obtained by relativistic Hartree-Bogoliubov (RHB) and nonrelativistic Skyrme Hartree-Fock-Bogoliubov (SHFB) calculations of spherical nuclei and the experimental density extracted by fitting the data are used. The isotopic neutron density and radius differences and the isotopic cross-section ratios of , , and are investigated. A detailed analysis is performed by introducing a hole model of of and as a core and neutron holes, the sensitivity of the cross sections to surface-neutron densities is clarified. Through the hole-model analysis, the improved neutron densities and radii are obtained by fitting the isotopic cross-section ratio obtained from the data. The uncertainty in the structure and reaction models is discussed.
This paper is organized as follows. The structure and reaction calculations are described and the obtained results of the Pb isotopes are presented in Sec. II. Isotopic analysis using the theoretical and experimental densities is performed in Sec. III, and the hole-model analysis is done in Sec. IV. In Sec. V, improved neutron densities and radii are presented. A summary is given in Sec. VI. In Appendix A, supplemental figures are presented.
II Calculation of scattering
II.1 Target densities
The theoretical densities of Pb isotopes, which are used as inputs for nucleon-nucleus folding potentials in Pb calculations, are obtained via the RHB and SHFB calculations of spherical nuclei using the computational codes named DIRHB Nikšić et al. (2014) and HFBRAD Bennaceur and Dobaczewski (2005), respectively. For the former, the DD-ME2 Lalazissis et al. (2005) and DD-PC1 Nikšić et al. (2008) interactions are used; in this paper, these are simply denoted by me2 and pc1, respectively. For the latter case, the SKM* Bartel et al. (1982) and SLy4 Chabanat et al. (1998) interactions are used. Note that the parameter sets of these structure models were adjusted to globally fit the binding energies and rms charge radii in wide mass-number regions that include and .
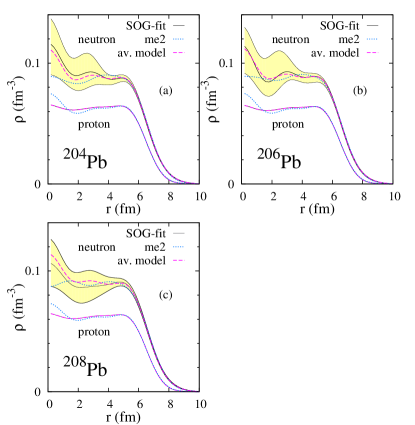
The experimental neutron densities of the Pb isotopes used in this paper are those of Refs. Zenihiro et al. (2010); Zenihiro (2011), which were extracted by fitting the Pb data at 295 MeV using the RIA calculation with the ddMH model, which was called medium-modified RIA calculation in the original paper. The neutron-density distribution is written in a sum-of-Gaussians (SOG) form and called the SOG-fit density in the present paper. The experimental proton densities are taken from Ref. Zenihiro et al. (2010); they were obtained by unfolding the nuclear charge distribution determined by electric elastic scattering data De Vries et al. (1987).
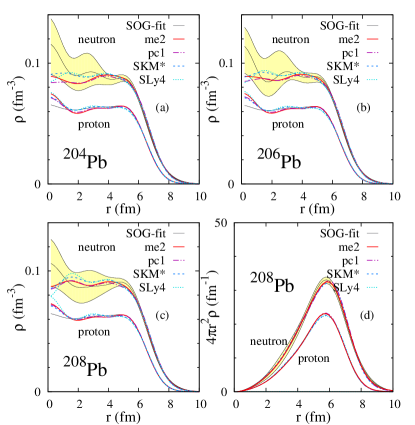
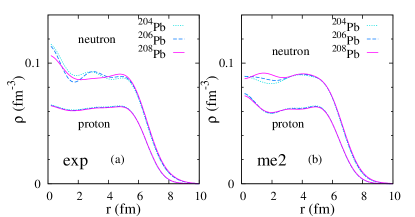
Figures 1(a)-(c) show proton () and neutron () densities of , , and , and Fig. 1(d) shows and of . The theoretical densities of the RHB (me2 and pc1) and SHFB (SKM* and SLy4) calculations and the experimental SOG-fit density are shown. The proton scattering at MeV is a sensitive probe of the surface-neutron density around the peak position of at fm, but it is insensitive to the inner densities. Therefore, the SOG-fit neutron densities of Pb isotopes have large uncertainties in the fm region as shown by the error envelopes (filled area). Theoretical neutron densities depend upon structure models, but each model yields similar neutron densities between , , and . Comparing the theoretical model and SOG-fit neutron densities in the surface region, the me2 model shows the best agreement with the SOG-fit density, whereas other theoretical models show disagreements; obtained by the pc1, SKM*, and SLy4 models exhibits a peak position that is slightly shifted outward compared with the SOG-fit and me2 densities. This peak-position shift causes deviation of the cross sections from the data at backward angles, as discussed later in Sec. II.2.
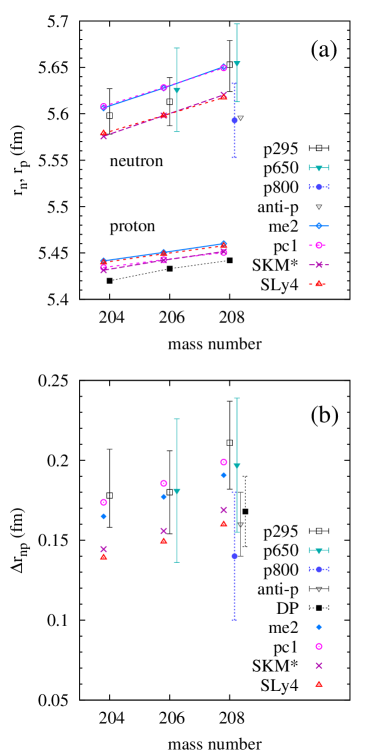
Figure 2(a) shows the theoretical and experimental values of and , whereas Fig. 2(b) shows the values of . All theoretical models show smooth changes of and as the mass number increases from to . The dependence of is quite similar between different models and is consistent with the experimental data. As for the neutron radii, the and change smoothly with the same slope as increases in all theoretical models, meaning that the dependence is approximately model independent though the absolute values are model dependent. Compared with the smooth changes of the theoretical and values, the values of the SOG-fit density seem to show a different dependence—in particular, an enhancement of and at from to . However, this is not definite due to the large experimental errors that arise mainly from uncertainty in the internal neutron densities extracted from the data.
II.2 Reaction calculation of scattering at 295 MeV
Proton elastic scattering at MeV is calculated using RIA with the ddMH model (a modified MH model proposed by Sakaguchi et al. Sakaguchi et al. (1998) by introducing density-dependent - and -meson masses and coupling constants of the relativistic Love-Franey (RLF) interaction of the original MH model Horowitz (1985); Murdock and Horowitz (1987)). The density dependence is considered as “medium effects” of the effective interaction, which includes various many-body effects in proton elastic scattering such as the Pauli blocking and multistep processes, in addition to the medium effects of meson properties. The RIA calculation with the ddMH model is performed in the default case, and that with the MH model is also performed in an optional case.
The parameter set of the density dependence used in this paper is the same as that used to analyze Pb and Ca at MeV in Refs. Zenihiro et al. (2010, 2018). This parameter set is the latest version calibrated to fit the updated data for at MeV and can well reproduce the data at MeV Zenihiro et al. (2018). In the RIA framework with the MH and ddMH models, the proton-nucleus potentials are calculated by folding the vector and scalar densities of target nuclei with the meson-exchange interaction. As the input target densities, the proton and neutron densities are used for the proton and neutron vector densities, whereas and are used for the proton and neutron scalar densities, respectively; this prescription of the scalar densities was adopted in Ref. Zenihiro et al. (2010) to fit the ddMH model to the data and applied to the Pb analysis. Note that, in the RHB calculations, the scalar densities can be obtained without such an approximation, but give only a minor correction to the Pb reactions at this energy. We adopt the prescription of the scalar densities for all models consistently with the calibration of the ddMH model.
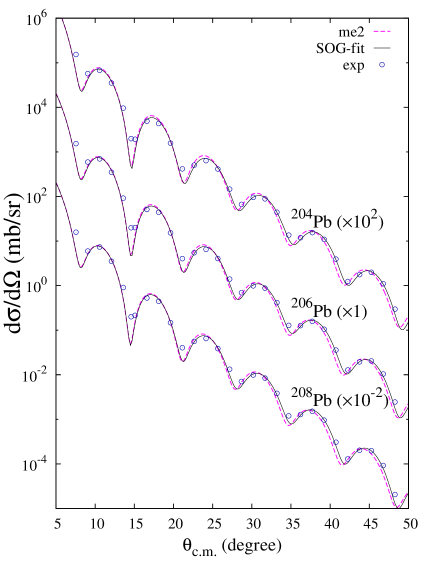
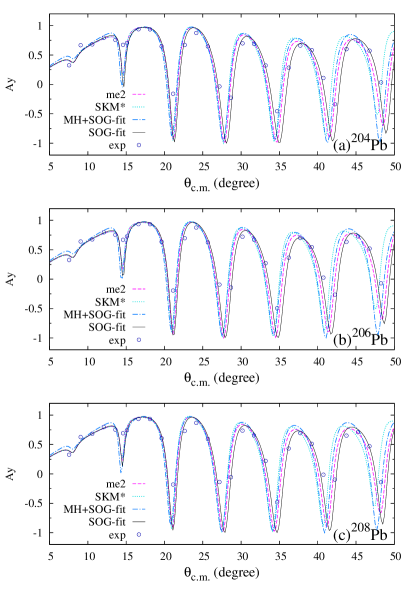
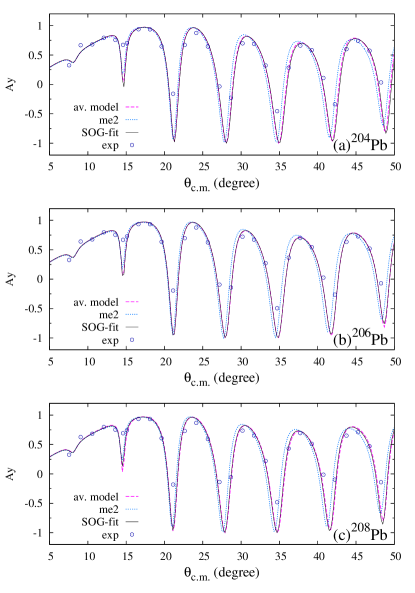
The cross sections and analyzing powers of Pb at 295 MeV obtained by the RIA calculation with the ddMH model are shown in Figs. 3 and 4, respectively, and the Rutherford ratio of the cross sections are shown in Fig. 5. In the results obtained using the pc1, SKM*, and SLy4 densities, dip and peak positions in the diffraction pattern deviate from the experimental data, in particular, at backward angles, in which the dip (peak) positions shift to forward angles because of the slight outward shift of the peak position compared with the SOG-fit and me2 densities. The me2 result agrees better with the data than those of other theoretical densities, but a slight deviation from the data still remains. Therefore, the dip interval in the diffraction pattern is sensitive to the peak position, but does not necessarily correspond to the neutron radius . For instance, the SKM* density has a smaller value of than the SOG-fit density, but it gives a shrunk diffraction pattern of the cross sections consistent with the outward shift of the peak, indicating an expansion of the nuclear size probed by proton scattering.
To show reaction model dependence, the results obtained using the MH model with the SOG-fit and me2 densities are shown in Figs. 4 and 5 in comparison with the results of the ddMH model. The dip interval of the cross sections depends upon the effective interaction in the reaction model; compared with the ddMH results, the diffraction pattern of the MH model deviates forward, indicating that the range of the effective interaction in the MH model is slightly longer than that in the ddMH model.
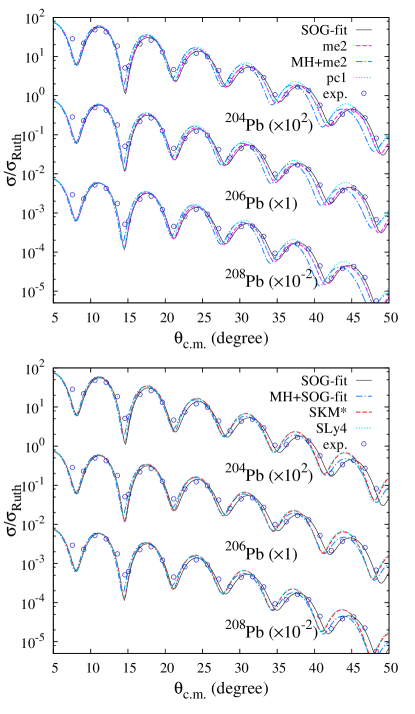
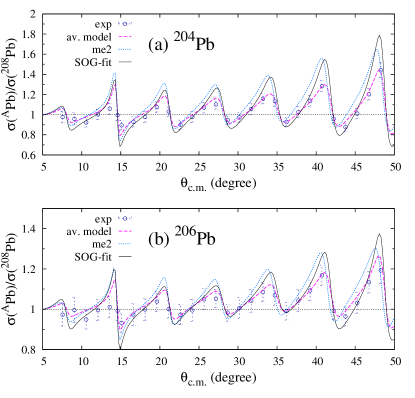
As shown in the results, the calculated cross sections at 295 MeV are sensitive to differences between input neutron densities at the nuclear surface, and depend upon the effective interaction used in the nucleon-nucleus folding potential. However, in each model, the results for a series of isotopes from to are quite similar and deviation from the experimental data occurs systematically for the three isotopes. To see the isotopic similarities, the results of Pb isotopes are compared in Fig. 6 for densities and Fig. 7 for the Rutherford ratio of the cross sections on a linear scale. For each result of the SOG-fit, me2, pc1, SKM*, SLy4, MH-SOG-fit, and MH-me2, the isotopic difference between , , and in the cross sections is small because surface densities in the fm region of the three isotopes approximately coincide,. even in the linear plot of the Rutherford ratio (Fig. 7). These isotopic systematics are useful for a model-independent analysis of proton elastic scattering.
III Isotopic analysis
III.1 Definitions of isotopic differences and ratios
By considering as the reference nucleus, the isotopic density and radius differences and cross-section ratio are calculated for each model in the present isotopic analysis. The isotopic density and radius differences are respectively given as
| (1) | |||
| (2) |
where and are the neutron(proton) density and rms radius of . The isotopic cross-section ratio is given as
| (3) |
with differential cross sections in the center-of-mass frame. It is trivial that, even in the case of , is not constant because of normalization of the target densities used for the folding potential and kinematical effects in the reaction.
Experimental values of are obtained using the cross section data at approximately the same angles in a series of Pb isotopes by omitting isotopic differences in the transformation from the laboratory frame to the center-of-mass frame, which is negligibly small in this mass-number region.
III.2 Isotopic difference of neutron radii and densities
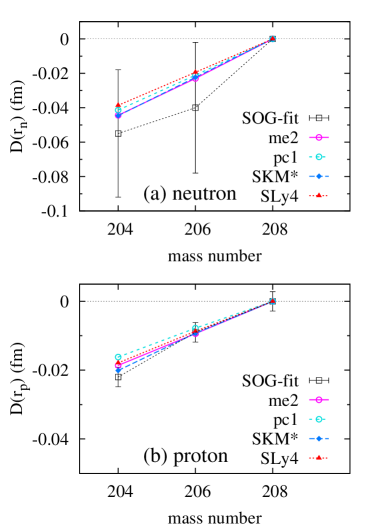
The isotopic radius differences and are nothing but the relative radii of , measured from . The theoretical values of and are shown in Fig. 8 together with the experimental of the SOG-fit density and the values Zenihiro et al. (2010). The theoretical results of RHB (me2 and pc1) and SHFB (SKM* and SLy4) calculations are consistent and show linear dependences of and upon the neutron-number difference because of the isotopic systematics of and as discussed previously. The theoretical values of the isotopic proton radius difference, fm for and fm for , agree well with the experimental values reduced from the charge radii. For the isotopic neutron radius difference, the theoretical values are independent from structure models as fm and fm. They are contained in the experimental errors extracted from the data at 295 MeV, but deviate from the experimental best-fit values fm for and fm for of the SOG-fit neutron density.
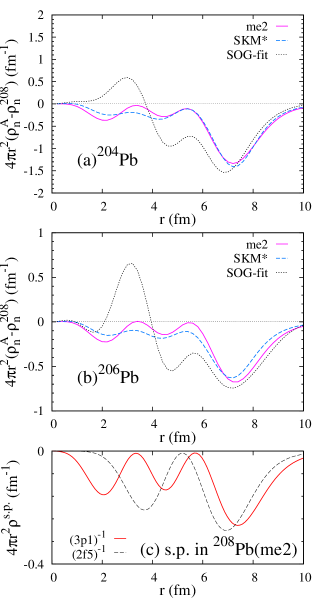
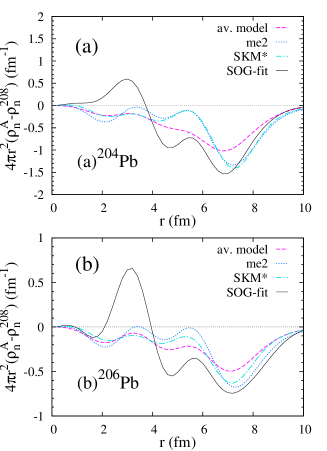
The isotopic neutron-density differences in and of the SOG-fit, me2, and SKM* densities are shown in Fig. 9. The one-neutron hole densities of the and orbits in of the me2 density are shown for comparison. In the me2 and SKM* densities, shows a remarkable reduction of the surface density in the fm region from to because of the dominant and contributions, but contains the paring effect and other higher-order effects beyond perturbation such as -core shrinkage. Compared with the enhanced amplitude of at the surface, the amplitude in the internal region is relatively small and shows almost no specific character except for a small oscillation of the -hole component. The SOG-fit density shows a surface amplitude similar to the theoretical densities in the fm region, but a strange behavior occurs in the fm region—that is, a sharp peak with an opposite sign. Since the proton elastic scattering at 295 MeV is insensitive to this internal region, this sharp peak may be an artifact that accidentally occurred in the SOG fitting under the condition of total neutron-number conservation. However, this artifact in the internal region causes a sudden increase of from to as understood by the relationship between and given in Eq. (2). Another difference between the SOG-fit and theoretical densities is seen in the fm region.
III.3 Isotopic cross-section ratio
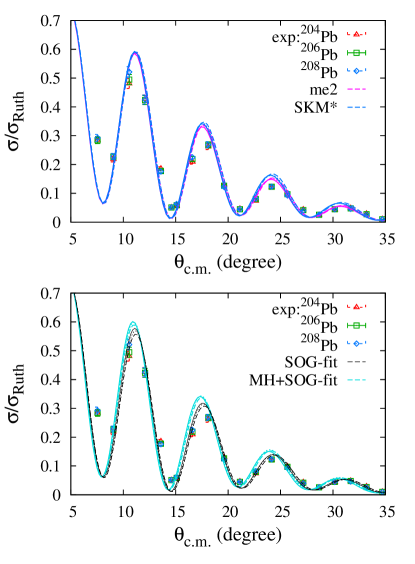
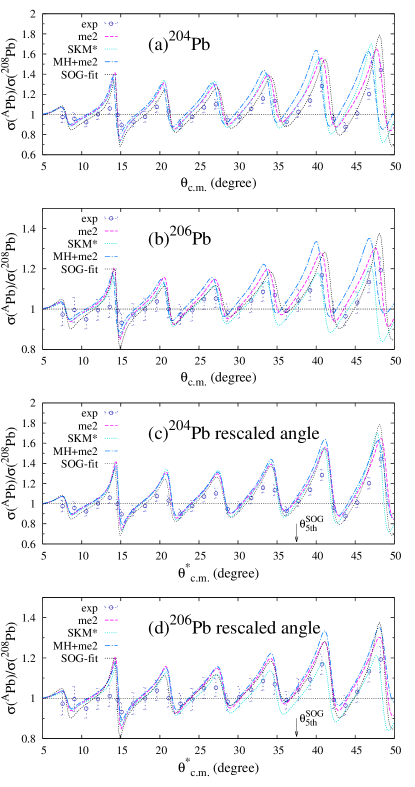
The isotopic cross-section ratios of and to are calculated by the ddMH model using the SOG-ft and theoretical densities. Figure 10 compares the results obtained using the SOG-fit, me2, and SKM* densities, with the experimental values. The result calculated with the original MH model using the me2 density is also compared to see the dependence on the effective interaction in the reaction models. The isotopic cross-section ratio shows an oscillating behavior that reflects the diffraction pattern of the cross sections; the dip positions of correspond to the dip angles of the cross sections, whereas the peak positions of correspond to the dip angles of the cross sections. In principle, the oscillation amplitude of is sensitive to the size difference between isotopes. The size shrinkage of from expands the diffraction pattern of , shifting the dip positions slightly to backward angles as compared with . This shift that originates in the nuclear size shrinkage increases the amplitude in one cycle of the oscillation of . Comparing different model calculations the oscillation interval of depends upon the structure and reaction models because of the model dependence of the dip positions of as shown in Fig. 5; however, the oscillation amplitude of is similar between different models.
To see more details of the oscillation amplitude, is plotted for yhr rescaled angles so as to adjust the fifth peak angle () of the cross sections of SOG-fit with that () of the other calculations. The -plots of for and are shown in Figs. 10(c) and (d), respectively. After rescaling the angles, the model dependence of becomes small except for the region as expected from that the isotopic neutron-density differences in the surface region being similar between various theoretical densities and the SOG-fit density. This result indicates that a model-independent discussion is possible in isotopic analysis using the rescaled angles .
Compared with the experimental obtained from the cross section data, the s calculated using the theoretical and SOG-fit densities slightly overshoot the experimental oscillation amplitude for and as shown by the -plots in Figs. 10(c) and (d), respectively.
IV Hole-model analysis
IV.1 Model of the core with holes
As discussed previously, isotopic similarities are found in the neutron density and cross sections in a series of Pb isotopes, indicating that isotopic differences can be described by a perturbative treatment based on the core. By assuming a core and hole contributions, I introduce a model (called the hole model in this paper) for the neutron densities of and and discuss the connection between and .
The hole-model neutron densities of and are expressed using two parameters for the neutron-hole contribution and size scaling of the -core as
| (4) | ||||
| (5) | ||||
| (6) |
where is the normalization factor for the total neutron number, is the neutron single-particle density of the orbit in the -core, is the -scaling factor of the core-size shrinkage, which is given by the scaling parameter , and is a model parameter for the -hole contribution. Note that does not necessarily equal the actual neutron -hole number but is a parameter of the effective hole number for the -orbit contribution to neutron density. For the no-scaling () case, the hole model neutron density is approximately written as
| (7) |
meaning that the total hole contribution is approximated by the -hole contribution and an overall reduction in the total neutron density, which contains contributions from other orbits. With this expression of two parameters, for the effective -hole number and for the size shrinkage, the hole model can simulate the densities of various configurations such as the configuration and also describe “equivalent” neutron densities to other theoretical densities that reproduce . Examples of the hole model neutron densities equivalent to the configuration and the me2 density are demonstrated in Appendix A.
In the present hole-model analysis, the hole-model density is used only for the neutron densities of and but the proton part is unchanged from the original proton densities of and . For the parameter of the effective -hole number, the hole-model densities with , 0.5, 2 are used and labeled as , , , , respectively.
I first perform isotopic analysis using the hole model with the -core and -orbit densities obtained by the me2 calculation to clarify the correspondence of to and . Then, I perform the hole-model analysis using the SOG-fit -core and the me2 -orbit densities to obtain optimized parameter sets and of the hole model by fitting the experimental obtained by the Pb cross section data at 295 MeV.
IV.2 Hole-model analysis with the me2-core density
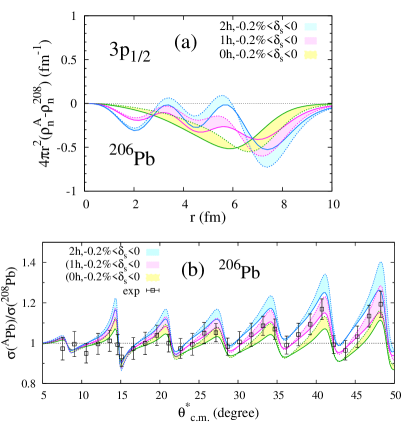
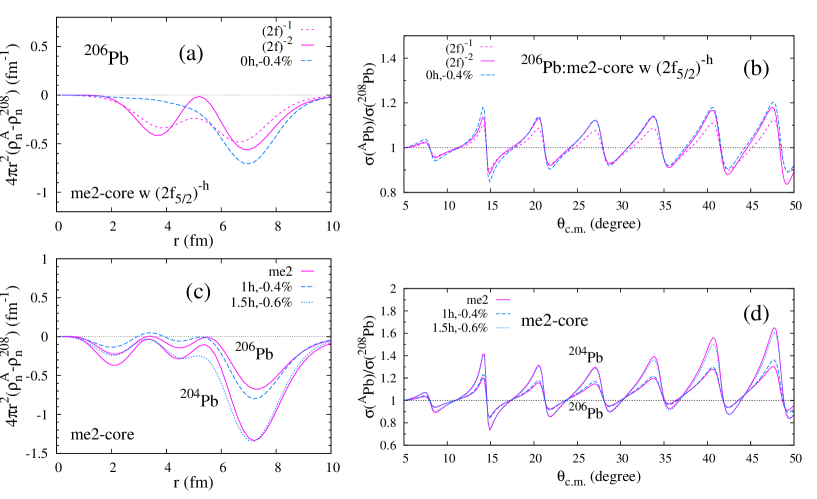
The isotopic neutron-density difference and the isotopic cross-section ratio for obtained using the hole-model density with the me2-core are shown in Fig. 11. The 0h, 1h, and 2h results corresponding to the -hole numbers , 1, and 2 in the range of (0.2–0% core shrinkage) are illustrated by the yellow, pink, and blue-colored areas, respectively. The oscillation amplitude of depends upon the size-scaling parameter ; it becomes larger as size shrinks from the core. The increase of (the effective -hole number) changes the surface behavior of ; it reduces and enhances the surface amplitude of in the fm and 7 regions, respectively, as expected from the hole density (Fig. 9(c)). This change in increases .
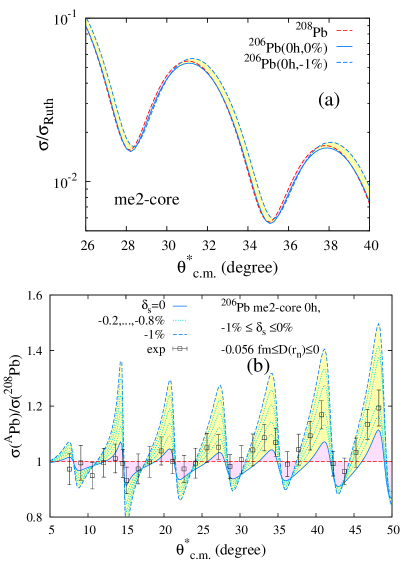
Let me now discuss each effect of the size scaling and increase of upon via changes in and in greater detail. First, I shall discuss the size-scaling effect by changing only of the 0h (no-hole) case of . The results are shown in Figs. 12 and 13. Figures 12(a), (b), and (c) show , , and for , respectively. Figures 13(a) and (b) show the results of and , respectively. For a clear visualization, and in an extreme case of are shown in Figs. 12(d) and (e), respectively. As the size shrinks from to , increases in the fm region and decreases in the fm region (Figs. 12(b) and (d)); therefore, the peak position of shifts inwardly (Figs. 12(c) and (e)). The inward shift of the peak causes an outward shift of the diffraction pattern of the cross section (Fig. 13(a)) and enhances the oscillation amplitude of , which monotonically increases as decreases (Fig. 13(b)). This indicates that the oscillation amplitude of is a sensitive measure of the shrinkage of relative to .
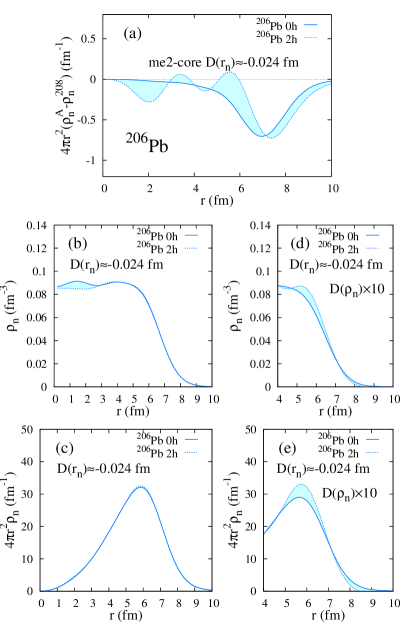
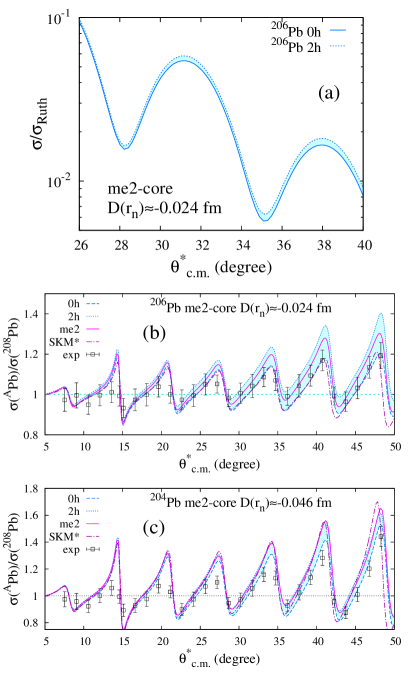
Next, I discuss the -hole contribution effects, which provide a nontrivial change of the density shape in the surface region. The density and cross sections obtained for the two-hole (2h) case are compared with those for the no-hole case in Figs. 12 and 15, respectively; to eliminate the size changing effect, I choose independently for the 0h and 2h cases so that approximately the same values will be given in the two cases as fm for and fm for . The densities of are shown in Fig. 12, the results of the cross sections are shown in Figs. 12(a) and (b), and those for cross sections are presented in Fig. 15(c). Figures 12(d) and (e) display with 10 times enhanced to show the difference between the 0h and 2h densities more clearly. The dominant effect of the -hole contribution is an enhancement of the surface density in the 5 fm7 fm region around the peak position of , whereas the contribution to the tail density in the fm region is relatively small (Fig. 12 (a),(c), and (e)). This density change by the -hole contribution globally raises the cross sections of (Fig. 15(a)); therefore, it causes an upward shift of the isotopic cross-section ratio without changing its angular dependence (Fig. 15(b)). Note that, the parallel shift of with increasing is obtained only when is kept constant. The same analysis is performed for , and a qualitatively consistent result is obtained (Fig. 15(c)).
In Figs. 15 (b) and (c), the obtained using the hole-model density is compared with that obtained using the me2 and SKM* densities. The me2(SKM*) density gives fm ( fm) for and fm ( fm) for , which are consistent with the values of the hole-model density presented herein. The oscillation amplitude of is almost consistent between the hole-model, me2, and SKM* densities, meaning that it is determined by independently from details of model densities.
The present analyses of and dependences indicate the clear correspondence of to and . Namely, the oscillation amplitude of is a good measure to determine the isotopic neutron radius difference , whereas deviation of the center value of the oscillation from is a sensitive probe to the surface shape of the isotopic neutron-density difference .
IV.3 Hole-model analysis with the experimental SOG-fit core density
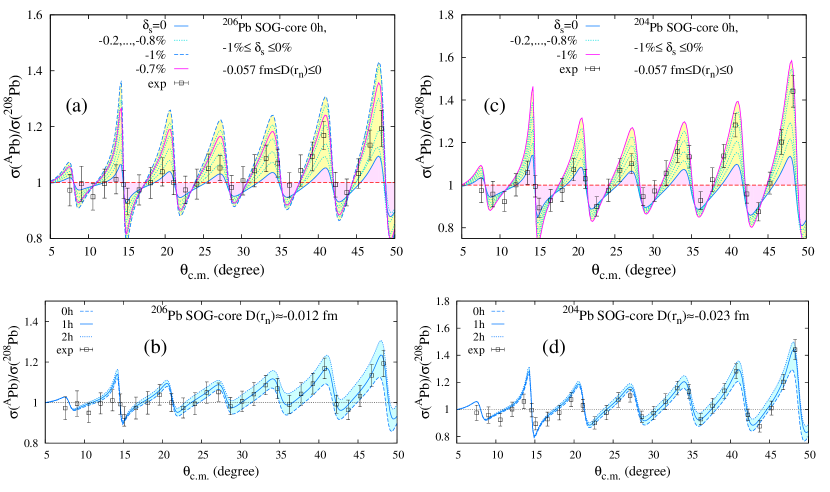
Using the SOG-fit core density, the hole-model analysis is performed in a similar way to Sec. IV.2 for the me2-core density, and qualitatively consistent results are obtained. The result obtained by the RIA+ddMH calculation with the hole-model (SOG-core) density is shown in Fig. 16. Figures 16(a) and (b) show the and dependences of for , and Figs. 16(c) and (d) show the results for . For , the hole-model density with (0h,) (which has fm, same as the SOG-fit density) overshoots the oscillation amplitude of the experimental (see the red line in Fig. 16(a)). This indicates that the value fm of the SOG-fit density for may be too large; similarly, the hole-model density of with (0h,) has fm, which is almost the same as the SOG-fit density, but seems to overshoot the oscillation amplitude of the experimental (see the red line in Fig. 16(c)), meaning that the value of fm for is unlikely.
The optimal parameter set of and is sought for the hole model to fit the experimental . First, I choose the favored parameter sets among the 0h densities, (0h,) with fm for and (0h,) with fm for , to reproduce the slope in one cycle of the oscillation amplitude of the experimental ; then, I change the effective hole number , maintaining the optimal values. The calculated obtained using the 0h, 1h, and 2h densities with fm ( fm) for () is shown in Fig. 16(b) (Fig. 16(d)). Finally, the (1h,) density with fm is obtained as an optimized solution for , which describes the experimental , and an optimized set (1h,) with fm is obtained for . The values calculated using the optimized solutions are shown by solid lines in Figs. 16 (b) and (d).
IV.4 Uncertainty in
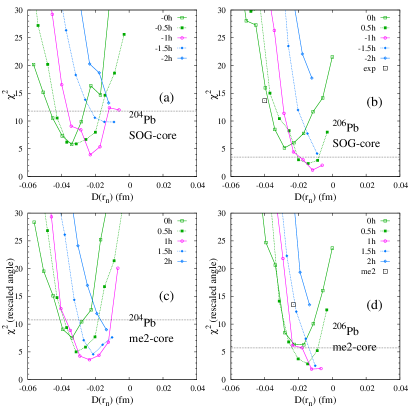
To discuss the uncertainty in determining from the experimental , I calculate the values of for the hole model. In the present analysis of , the angular resolution of the experimental cross section data is not taken into account, but it can have crucial effects at the forward and dip angles of the cross sections. Therefore, is calculated using a total of 17 datapoints in a “safe” region by eliminating seven datapoints at the forward angles and five at the dip angles. In Fig. 17, the values obtained for and are plotted as functions of .
The results for and of the hole model with the SOG-fit core are shown in Figs. 17(a) and (b). The absolute values of the calculated are meaningless because the experimental errors of are estimated by assuming independent errors of the and cross sections though the -independent systematic errors should be removed. To roughly estimate the uncertainty, I here adopt a criterion for the acceptable range as less than three times the minimum value as . From the acceptable ranges of this criterion, which are shown by dotted lines in the figures, – fm for and – fm for are obtained. The values for the SOG-fit density are for and for , which exceed the acceptable range because the systematics between the Pb isotopes was not taken into account in the fitting of Ref. Zenihiro et al. (2010).
For the hole model with the me2 core, the values are calculated using rescaled angles , and the results obtained for and are shown in Figs. 17(c) and (d), respectively. The results of the me2 core are almost consistent with those of the SOG-fit core meaning that the present hole-model analysis of can obtain values almost independently from the adopted -core density. In Table 1, the values of and obtained by the hole models (SOG-fit and me2 cores) are summarized in comparison with those of the SOG-fit and me2 densities of the Pb isotopes.
| (fm) | (fm) | |||
| SOG-fit | 52 | 14 | ||
| me2 | 52 | 14 | ||
| hole model | (fm) | (fm) | ||
| (optimized) | ||||
| SOG-core | 1.2 | 3.9 | ||
| me2-core | 1.9 | 3.6 | ||
| (acceptable) | ||||
V Improved neutron densities and radii of Pb isotopes
V.1 Reconstruction of neutron densities
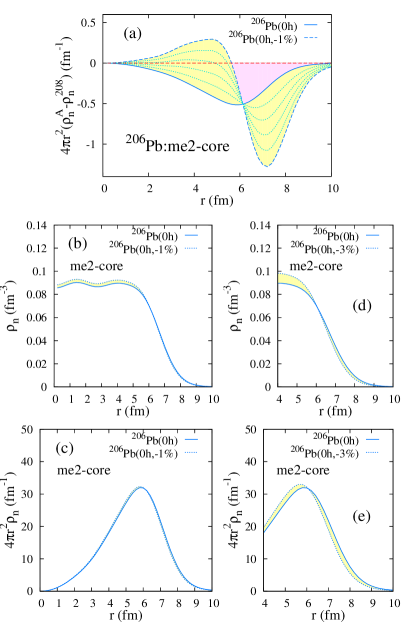
As mentioned previously, the SOG-fit density overshoots the oscillation amplitude of the experimental . The reason for this failure in reproducing is that the fitting was performed independently for each isotope without taking the isotopic systematics into account. From the SOG-fit density, I reconstruct the improved neutron densities of Pb isotopes that can describe experimental as follows. First, the neutron density of is obtained by averaging three densities of , , and given by the SOG-fit density to avoid a risk from uncertainty of the SOG-fit density in the internal region. Next, the neutron densities of and are constructed to reproduce the of the best solution of the hole model. The density of the Pb isotopes obtained with these procedures is called the “averaged-model” density. In Fig. 18, the averaged-model density is shown in comparison with the SOG-fit and me2 densities. The averaged-model density is similar to the SOG-fit density. The s of the averaged model, SOG-fit, and me2 densities are compared in Fig. 19. Note that the of the averaged model is tuned to fit the data in the hole-model analysis. The surface peak shape of in the region is similar between three kinds of densities; however, a difference is found in the internal region, to which at 295 MeV is insensitive. The flopping behavior of found in the SOG-fit density disappears in the averaged-model density, which shows a smooth behavior in the internal region similar to theoretical densities such as the SKM* density, rather than the SOG-fit density.
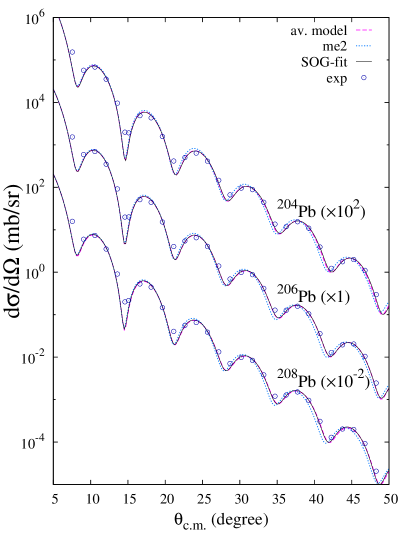
Pb at 295 MeV is calculated using RIA+ddMH with the averaged-model density. The results of , , and are shown in Figs. 22, 20, and 21, respectively, and compared with those obtained with the SOG-fit and me2 densities. is significantly improved by the averaged-model density compared with other densities because is tuned to fit the data. Moreover, the averaged-model density successfully describes the cross sections and analyzing powers in a quality almost equivalent to the SOG-fit density.
In Fig. 23, the neutron radius () and skin thickness () obtained by the present averaged model are shown in comparison with the experimental and theoretical values. The averaged model yields smooth changes of and in a series of Pb isotopes from to . The values are within the experimental errors of the SOG fitting extracted from the data at 295 MeV. It is difficult to quantitatively discuss the systematic errors of the present result because the angular resolutions and systematic errors of the experimental data are not taken into account in the present analysis. In Fig. 23, I present a rough estimation of the error range of for using the acceptable range fm obtained by hole-model analysis and the value of of the averaged model.
VI Summary
A new method of reaction analysis for proton elastic scattering was proposed by combining systematic analyses of nuclear structure and reaction in a series of isotopes. This method was applied to , , and at MeV to obtain improved neutron densities and radii from the experimental cross section data. The reaction calculation of Pb at MeV was performed using RIA with the effective interaction of the ddMH model. For the target Pb density, the theoretical densities of the RHB (me2 and pc1) and SHFB (SKM* and SLy4) calculations of spherical nuclei and the experimental SOG-fit density are used as inputs of the reaction calculations.
The isotopic differences of the neutron density and radius of from the reference were investigated, and the isotopic ratio of to the cross sections was analyzed. The cross sections are sensitive to the profile of the surface-neutron density but insensitive to the internal density. In the analysis of , the SOG-fit density was found to have a flapping behavior of in the internal region, causing an artificial increase of the neutron radius of that was inconsistent with theoretical predictions.
A further detailed analysis was performed with the hole model by assuming a core and neutron-hole contributions for the neutron densities of and . A clear correspondence between the surface-neutron density and the cross sections was clarified; the oscillation amplitudes of is determined by the isotopic neutron radius difference , whereas the central values of the oscillation of are sensitive to the surface-neutron density around the peak position of . Because of this correspondence between the isotopic structure differences ( and ) and the isotopic cross-section ratio , the and values can be safely extracted from the observed data with less model dependence. By fitting the experimental with the hole model, fm with the acceptable range fm was obtained for . Furthermore, the improved neutron densities of , , and were reconstructed from the SOG-fit density using the obtained by hole-model analysis. The improved neutron densities of Pb isotopes successfully reproduced the experimental Pb data measured at 295 MeV, including the isotopic cross-section ratio and the cross sections and analyzing powers. The results for and obtained by the improved neutron densities are reasonable values within the experimental errors and show smooth changes in a series of Pb isotopes from to .
It should be noted that the present results for and can be improved by a further precise analysis by taking into account experimental errors in the angular resolution and the possible reduction of systematic errors in , which were omitted in the present analysis. Reanalysis of the Pb data at 295 MeV including isotopic systematics such as the data is requested to extract a revised SOG-fit density from the data at 295 MeV.
The model uncertainties in the structure and reaction calculations were discussed by comparing the results obtained by RIA calculation with the ddMH and MH effective interactions using various theoretical densities. The present method of isotopic analysis was shown to be a useful tool for extracting neutron densities and radii from the cross sections in a series of isotopes with less systematic uncertainties from model dependences. The method can be extended straightforwardly to systematic analyses of neighboring nuclei, particularly for the data measured experimentally with the same setup at the same facility, because systematic errors can be significantly reduced in the experimental data of the isotopic cross-section ratio. This can be a great advantage for determining the nuclear sizes of unstable nuclei from data measured in inverse kinematics.
Acknowledgements.
This work was motivated by the recent work of Ms. Shiyo Enyo. in her master thesis. It was supported by Grants-in-Aid of the Japan Society for the Promotion of Science (Grant Nos. JP18K03617 and 18H05407) and by a grant of the joint research project of the Research Center for Nuclear Physics at Osaka University.Appendix A Equivalent for the -hole model and the me2 densities
and obtained using the hole model of the -hole configurations with the me2-core are shown in Fig. 24 (a) and (b), respectively. The equivalent -hole-model density, which yields an approximately consistent result of with the -hole model is obtained by tuning the parameters and of the -hole model. The results obtained using the equivalent -hole-model density adjusted to the hole model with the configuration are compared, In Figs. (c) and (d), the and obtained using the equivalent -hole-model density adjusted to the me2-density are compared with those of the me2-density.
References
- Roca-Maza et al. (2011) X. Roca-Maza, M. Centelles, X. Vinas, and M. Warda, Phys. Rev. Lett. 106, 252501 (2011), arXiv:1103.1762 [nucl-th] .
- Roca-Maza and Paar (2018) X. Roca-Maza and N. Paar, Prog. Part. Nucl. Phys. 101, 96 (2018), arXiv:1804.06256 [nucl-th] .
- Tsang et al. (2012) M. B. Tsang et al., Phys. Rev. C 86, 015803 (2012), arXiv:1204.0466 [nucl-ex] .
- Starodubsky and Hintz (1994) V. E. Starodubsky and N. M. Hintz, Phys. Rev. C 49, 2118 (1994).
- Zenihiro et al. (2010) J. Zenihiro et al., Phys. Rev. C 82, 044611 (2010).
- Klos et al. (2007) B. Klos et al., Phys. Rev. C 76, 014311 (2007), arXiv:nucl-ex/0702016 .
- Abrahamyan et al. (2012) S. Abrahamyan et al., Phys. Rev. Lett. 108, 112502 (2012), arXiv:1201.2568 [nucl-ex] .
- Friedman (2012) E. Friedman, Nucl. Phys. A 896, 46 (2012), arXiv:1209.6168 [nucl-ex] .
- Tarbert et al. (2014) C. M. Tarbert et al., Phys. Rev. Lett. 112, 242502 (2014), arXiv:1311.0168 [nucl-ex] .
- Tamii et al. (2011) A. Tamii et al., Phys. Rev. Lett. 107, 062502 (2011), arXiv:1104.5431 [nucl-ex] .
- Piekarewicz et al. (2012) J. Piekarewicz, B. K. Agrawal, G. Colo, W. Nazarewicz, N. Paar, P. G. Reinhard, X. Roca-Maza, and D. Vretenar, Phys. Rev. C 85, 041302 (2012), arXiv:1201.3807 [nucl-th] .
- Centelles et al. (2010) M. Centelles, X. Roca-Maza, X. Vinas, and M. Warda, Phys. Rev. C 82, 054314 (2010), arXiv:1010.5396 [nucl-th] .
- Ray et al. (1978) L. Ray, W. R. Coker, and G. W. Hoffmann, Phys. Rev. C 18, 2641 (1978).
- Ray (1979) L. Ray, Phys. Rev. C 19, 1855 (1979), [Erratum: Phys.Rev.C 20, 1212–1212 (1979)].
- Hoffmann et al. (1980) G. W. Hoffmann et al., Phys. Rev. C 21, 1488 (1980).
- Horowitz (1985) C. J. Horowitz, Phys. Rev. C 31, 1340 (1985).
- Murdock and Horowitz (1987) D. P. Murdock and C. J. Horowitz, Phys. Rev. C 35, 1442 (1987).
- Horowitz et al. (1991) C. Horowitz, D. Murdock, and S. B.D., Computational Nuclear Physics 1, edited by K. Langanke, J. Maruhn, and S. Koonin (Springer-Verlag, 1991) p. 129.
- Sakaguchi et al. (1998) H. Sakaguchi et al., Phys. Rev. C 57, 1749 (1998).
- Terashima et al. (2008) S. Terashima et al., Phys. Rev. C 77, 024317 (2008).
- Zenihiro et al. (2018) J. Zenihiro et al., (2018), arXiv:1810.11796 [nucl-ex] .
- Piekarewicz and Weppner (2006) J. Piekarewicz and S. P. Weppner, Nucl. Phys. A 778, 10 (2006), arXiv:nucl-th/0509019 .
- Yoshida et al. (2020) S. Yoshida, H. Sagawa, J. Zenihiro, and T. Uesaka, Phys. Rev. C 102, 064307 (2020).
- Roca-Maza et al. (2008) X. Roca-Maza, M. Centelles, F. Salvat, and X. Vinas, Phys. Rev. C 78, 044332 (2008), arXiv:0808.1252 [nucl-th] .
- Hoffmann et al. (1990) G. W. Hoffmann et al., Phys. Rev. C 41, 1651 (1990).
- Nikšić et al. (2014) T. Nikšić, N. Paar, D. Vretenar, and P. Ring, Comput. Phys. Commun. 185, 1808 (2014), arXiv:1403.4039 [nucl-th] .
- Lalazissis et al. (2005) G. A. Lalazissis, T. Nikšić, D. Vretenar, and P. Ring, Phys. Rev. C 71, 024312 (2005).
- Nikšić et al. (2008) T. Nikšić, D. Vretenar, and P. Ring, Phys. Rev. C 78, 034318 (2008), arXiv:0809.1375 [nucl-th] .
- Bennaceur and Dobaczewski (2005) K. Bennaceur and J. Dobaczewski, Comput. Phys. Commun. 168, 96 (2005), arXiv:nucl-th/0501002 .
- Bartel et al. (1982) J. Bartel, P. Quentin, M. Brack, C. Guet, and H. B. Hakansson, Nucl. Phys. A 386, 79 (1982).
- Chabanat et al. (1998) E. Chabanat, P. Bonche, P. Haensel, J. Meyer, and R. Schaeffer, Nucl. Phys. A 635, 231 (1998), [Erratum: Nucl.Phys.A 643, 441–441 (1998)].
- Zenihiro (2011) J. Zenihiro, Neutron density distributions of Pb deduced via proton elastic scattering at 295 MeV, Ph.D. thesis, Kyoto University (2011).
- De Vries et al. (1987) H. De Vries, C. W. De Jager, and C. De Vries, Atom. Data Nucl. Data Tabl. 36, 495 (1987).