Bringing Structure into Summaries:
a Faceted Summarization Dataset for Long Scientific Documents
Abstract
Faceted summarization provides briefings of a document from different perspectives. Readers can quickly comprehend the main points of a long document with the help of a structured outline. However, little research has been conducted on this subject, partially due to the lack of large-scale faceted summarization datasets. In this study, we present FacetSum, a faceted summarization benchmark built on Emerald journal articles, covering a diverse range of domains. Different from traditional document-summary pairs, FacetSum provides multiple summaries, each targeted at specific sections of a long document, including the purpose, method, findings, and value. Analyses and empirical results on our dataset reveal the importance of bringing structure into summaries. We believe FacetSum will spur further advances in summarization research and foster the development of NLP systems that can leverage the structured information in both long texts and summaries.
1 Introduction
Text summarization is the task of condensing a long piece of text into a short summary without losing salient information. Research has shown that a well-structured summary can effectively facilitate comprehension Hartley et al. (1996); Hartley and Sydes (1997). A case in point is the structured abstract, which consists of multiple segments, each focusing on a specific facet of a scientific publication Hartley (2014), such as background, method, conclusions, etc. The structure therein can provide much additional clarity for improved comprehension and has long been adopted by databases and publishers such as MEDLINE and Emerald.
Despite these evident benefits of structure, summaries are often framed as a linear, structure-less sequence of sentences in the flourishing array of summarization studies (Nallapati et al., 2017; See et al., 2017; Paulus et al., 2018; Grusky et al., 2018; Narayan et al., 2018; Sharma et al., 2019; Lu et al., 2020; Cachola et al., 2020). We postulate that a primary reason for this absence of structure lies in the lack of a high-quality, large-scale dataset with structured summaries. In fact, existing studies in faceted summarization Huang et al. (2020); Tauchmann et al. (2018); Jaidka et al. (2016); Contractor et al. (2012); Kim et al. (2011); Jaidka et al. (2018); Stead et al. (2019) are often conducted with rather limited amount of data that are grossly insufficient to meet today’s ever-growing model capacity.
We aim to address this issue by proposing the FacetSum dataset. It consists of 60,024 scientific articles collected from Emerald journals, each associated with a structured abstract that summarizes the article from distinct aspects including purpose, method, findings, and value. Scale-wise, we empirically show that the dataset is sufficient for training large-scale neural generation models such as BART Lewis et al. (2020) for adequate generalization. In terms of quality, each structured abstract in FacetSum is provided by the original author(s) of the article, who are arguably in the best position to summarize their own work. We also provide quantitative analyses and baseline performances on the dataset with mainstream models in Sections 2 and 3.
2 FacetSum for Faceted Summarization
| # documents | |||||
| Train: 46,289 / Dev: 6,000 / Test: 6,000 / OA-Test: 2,243 | |||||
| # words in abstracts | |||||
| Full | Purpose | Method | Findings | Value | |
| mean | 290.4 | 54.1 | 52.0 | 68.6 | 47.3 |
| std | 82.8 | 28.4 | 27.8 | 32.4 | 24.2 |
| # words in paper sections | |||||
| Full | Intro. | Method | Result | Conc. | |
| recall% | - | 84.3% | 67.0% | 72.4% | 79.0% |
| mean | 6,827 | 885 | 1,194 | 2,371 | 747 |
| std | 2,704 | 557 | 861 | 1,466 | 567 |
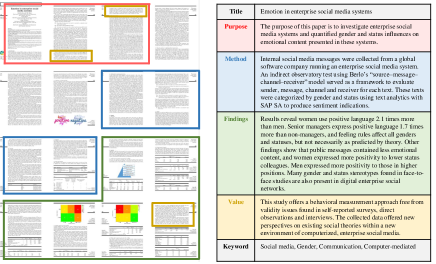
The FacetSum dataset is sourced from journal articles published by Emerald Publishing111The data has been licensed to researchers at subscribing institutions to use (including data mining) for non-commercial purposes. See detailed policies at https://www.emerald.com/ (Figure 1). Unlike many publishers, Emerald imposes explicit requirements that authors summarize their work from multiple aspects Emerald (2021): Purpose describes the motivation, objective, and relevance of the research; Method enumerates specific measures taken to reach the objective, such as experiment design, tools, methods, protocols, and datasets used in the study; Findings present major results such as answers to the research questions and confirmation of hypotheses; and Value highlights the work’s value and originality222There are three optional facets (about research, practical and social implications) that are missing from a large number of articles and hence omitted in this study.. Together, these facets give rise to a comprehensive and informative structure in the abstracts of the Emerald articles, and by extension, to FacetSum’s unique ability to support faceted summarization.
2.1 General Statistics
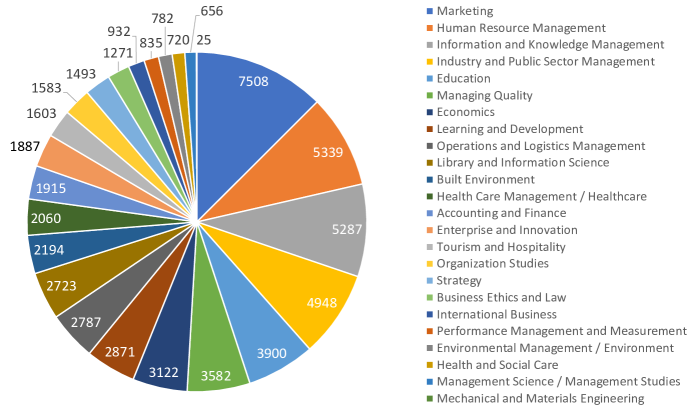
We collect 60,532 publications from Emerald Publishing spanning 25 domains. Table 1 lists some descriptive statistics of the dataset. Since FacetSum is sourced from journal articles, texts therein are naturally expected to be longer compared to other formats of scientific publications. In addition, although each facet is more succinct than the traditional, structure-less abstracts, a full length abstract containing all facets can be considerably longer. Empirically, we compare the source and the target lengths with some existing summarization datasets in similar domains including CLPubSum (Collins et al., 2017), PubMed (Cohan et al., 2018), ArXiv (Cohan et al., 2018), SciSummNet (Yasunaga et al., 2019), and SciTldr (Cachola et al., 2020). On average, the source length in FacetSum is 58.9% longer (6,827 vs 4,297), and the target length is 37.0% longer (290.4 vs 212.0).
From a summarization perspective, these differences imply that FacetSum may pose significantly increased modeling and computation challenges due to the increased lengths in both the source and the target. Moreover, the wide range of research domains (Figure 3, Appendix D) may also introduce much linguistic diversity w.r.t. vocabulary, style, and discourse. Therefore, compared to existing scientific publication datasets that only focus on specific academic disciplines Cohan et al. (2018); Cachola et al. (2020), FacetSum can also be used to assess a model’s robustness in domain shift and systematic generalization.
To facilitate assessment of generalization, we reserve a dev and a test set each consisting of 6,000 randomly sampled data points; the remaining data are intended as the training set. We ensure that the domain distribution is consistent across all three subsets. Besides, we intentionally leave out Open-Access papers as another test set, to facilitate researchers who do not have full Emerald access333 Both the split information of FacetSum and the code for scraping and parsing the data are available at https://github.com/hfthair/emerald_crawler.
2.2 Structural Alignment
In this section, we focus our analysis on one of the defining features of FacetSum — its potential to support faceted summarization. Specifically, we investigate how the abstract structure (i.e., facets) aligns with the article structure. Given an abstract facet and its corresponding article , we quantify this alignment by:
| (1) |
Semantically, consists of sentence indices in that best align with each sentence in .
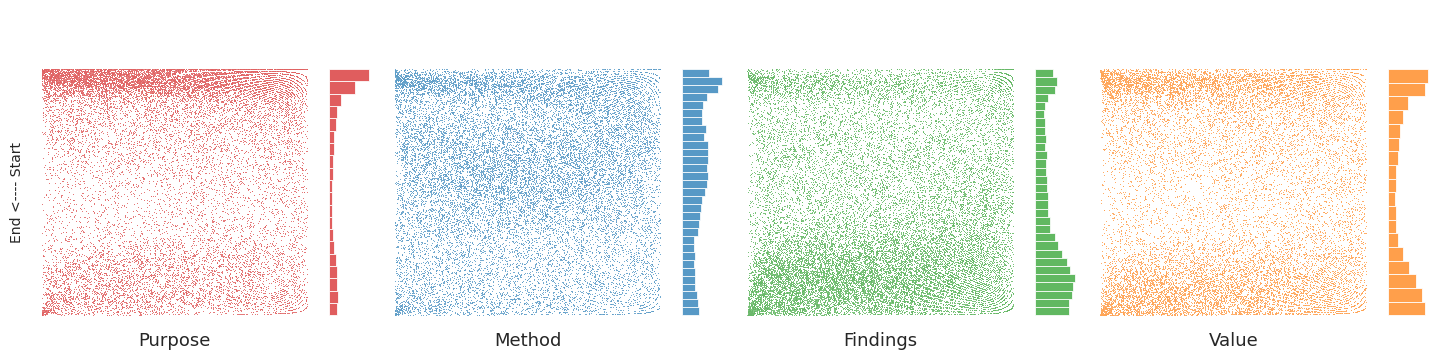
Sentence-level Alignment We first plot the tuples , where is the -th sentence in , and is the number of sentences in . Intuitively, the plot density around position entails the degree of alignment between the facet and the article at that position444We use the relative position so that all positions are commensurate across multiple documents.. With 10,000 articles randomly sampled from FacetSum, Figure 2 exhibits distinct differences in the density distribution among the facets in FacetSum. For example, with Purpose, resemblance is clearly skewed towards the beginning of the articles, while Findings are mostly positioned towards the end; the Method distribution is noticeably more uniform than the others. These patterns align well with intuition, and are further exemplified by the accompanying density histograms.
![[Uncaptioned image]](/html/2106.00130/assets/x2.png)
Section-level Alignment We now demonstrate how different abstract facets align with different sections in an article. Following conventional structure of scientific publications Suppe (1998); Rosenfeldt et al. (2000), we first classify sections into Introduction, Method, Result and Conclusion using keyword matching in the section titles.555 To ensure close-to-perfect precision, we choose keywords that are as specific and prototypical to each section as possible (listed in Appendix A). The resulting recall is around , i.e. about 70% of sections can be correctly retrieved with the title-keyword matching method. And we find 2,751 (out of 6,000) test samples that all four sections are matched successfully. Though far from perfect, we believe this size is sufficient for the significance of subsequent analyses.
Given a section and an abstract , we define the section-level alignment as , where denotes sentences concatenation, and is defined by Equation (1). Table 2 is populated by varying and across the rows and columns, respectively. Full denotes the full paper or abstract (concatenation of all facets). We also include the concatenation of introduction and conclusion (denoted I+C) as a possible value for , due to its demonstrated effectiveness as summaries in prior work Cachola et al. (2020).
The larger numbers on the diagonal (in red) empirically confirm a strong alignment between FacetSum facets and their sectional counterparts in articles. We also observe a significant performance gap between using I+C and the full paper as . One possible reason is that the summaries in FacetSum (particularly Method and Findings) may contain more detailed information beyond introduction and conclusion. This suggests that for some facets in FacetSum, simple tricks to condense full articles do not always work; models need to instead comprehend and retrieve relevant texts from full articles in a more sophisticated manner.
| Model | Source Text | Full | Purpose | Method | Findings | Value | |
|---|---|---|---|---|---|---|---|
| FacetSum Test | |||||||
| Oracle | Greedy Extractive Nallapati et al. (2017) | corresponding | 60.39 | 44.66 | 41.00 | 46.44 | 38.10 |
| Heuristic | Lead-K | corresponding | 36.78 | 17.83 | 15.29 | 15.92 | 16.08 |
| Models | Tail-K | sections | 33.31 | 21.67 | 12.62 | 16.66 | 17.43 |
| SumBasic (Vanderwende et al., 2007) | 38.71 | 18.17 | 15.41 | 16.31 | 16.57 | ||
| Unsupervised | LexRank (Erkan and Radev, 2004) | corresponding | 42.18 | 18.72 | 16.23 | 18.11 | 17.75 |
| Models | LSA (Gong and Liu, 2001) | sections | 35.98 | 18.29 | 15.86 | 16.92 | 16.62 |
| TextRank (Mihalcea and Tarau, 2004) | 41.87 | 21.67 | 13.62 | 18.63 | 19.23 | ||
| HipoRank (Dong et al., 2020) | 42.89 | 22.73 | 15.20 | 18.38 | 19.68 | ||
| BART (Lewis et al., 2020) | I+C | 44.36 | 41.14 | 20.75 | 14.72 | 5.85 | |
| Supervised | BART-Facet | I+C | 47.09 | 43.47 | 29.07 | 30.97 | 28.90 |
| Models | BART | full paper | 42.74 | 41.21 | 20.53 | 14.33 | 5.07 |
| BART-Facet | full paper | 45.76 | 42.55 | 28.07 | 28.98 | 28.70 | |
| FacetSum OA-Test | |||||||
| BART | I+C | 44.97 | 43.51 | 26.73 | 11.79 | 0.31 | |
| BART-Facet | I+C | 51.32 | 43.66 | 30.16 | 32.22 | 29.68 | |
3 Experiments and Results
We use FacetSum to benchmark a variety of summarization models from state-of-the-art supervised models to unsupervised and heuristics-based models. We also provide the scores of a sentence-level extractive oracle system Nallapati et al. (2017). We report Rouge-L in this section and include Rouge-1/2 results in Appendix E.
Unsupervised Models vs Heuristics We report performances of unsupervised and heuristics summarization methods (see Table 3). Tailoring to the unique task of generating summaries for a specific facet, we only use the section (defined in Section 2.2) corresponding to a facet as model input. Evaluation is also performed on the concatenation of all facets (column Full), which resembles the traditional research abstract. Lead-K/Tail-K are two heuristic-based models that extract the first/last sentences from the source text.
We observe that heuristic models do not perform well on Full, where the unsupervised models can achieve decent performance. Nevertheless, all models perform poorly on summarizing individual facets, and unsupervised models fail to perform better than simple heuristics consistently. The inductive biases of those models may not be good indicators of summary sentences on specific facets. A possible reason is that they are good at locating overall important sentences of a document, but they cannot differentiate sentences of each facet, even we try to alleviate this by using the corresponding section as input.
Supervised Models As for the supervised baseline, we adopt the BART model (Lewis et al., 2020), which has recently achieved SOTA performance on abstractive summarization tasks with scientific articles (Cachola et al., 2020). We propose two training strategies for the BART model, adapting it to handle the unique challenge of faceted summarization in FacetSum. In BART, we train the model to generate the concatenation of all facets, joined by special tokens that indicate the start of a specific facet (e.g., |PURPOSE| to indicate the start of Purpose summary). During evaluation, the generated text is split into multiple facets based on the special tokens, and each facet is compared against the corresponding ground-truth summary. In BART-Facet, we train the model to generate one specific facet given the source text and an indicator specifies which facet to generate. Inspired by CATTS (Cachola et al., 2020), we prepend section tags at the beginning of each training input to generate summaries for a particular facet (see implementation details in Appendix C).
Empirically, supervised models outperform unsupervised baselines by a large margin (Table 3). Comparing between the two training strategies, BART-Facet outperforms BART significantly. While BART performs comparably on Purpose, performance decreases drastically for subsequent facets, possibly due to current models’ inadequacy with long targets. Thus it can perform decently at the beginning of generation (40 on Purpose), where the dependency is relatively easy-to-handle. However, the output quality degrades quickly towards the end (5 on Value).
With I+C as source text, both training strategies exhibit much better results than using full paper. This is opposite to the observation in Table 2, potentially due to the limitation of the current NLG systems, i.e., the length of source text has crucial impacts to the model performance. With the much extended positional embeddings in our models (10,000 tokens), we suspect some other issues such as long term dependencies may lead to this discrepancy, which warrants further investigation.
4 Related Work
We acknowledge several previous efforts towards faceted summarization. Prior to our study, generating structured abstracts for scientific publications was also discussed in Gidiotis and Tsoumakas (2019, 2020). The authors built a structured abstract dataset PMC-SA, consisting of 712,911 biomedical articles from PubMed Central, and they proposed to summarize a paper from a specific facet by taking corresponding sections as inputs. Compared with their works, FacetSum covers a wider range of academic fields and we provide in-depth discussions on the structured abstract to justify its value as a novel NLP challenge. Our research shares some resemblance to studies on abstract sentence classification, whose goal is to classify abstract sentences into several facets, instead of summarizing the full text. MEDLINE is commonly used for this task Kim et al. (2011), so as the Emerald data Stead et al. (2019). A recent study Huang et al. (2020) introduced a new dataset CODA, in which 10,966 abstracts are split into subsentences and labelled into five categories by third-party annotators. However, we think scientific documents are generally difficult to comprehend for people without specific training, thus original authors are in the best position to summarize their own work. Faceted summarization was also involved in CL-SciSumm 2016 Shared Task Jaidka et al. (2018), where the faceted summary of a paper is defined as the citation sentences in its successor studies, since new studies typically describe previous work from different perspectives. However, this idea may not easily scale up in the real world since many papers do not have enough number of citations, especially for newly published ones.
5 Conclusion & Future Work
We introduce FacetSum to support the research of faceted summarization, which targets summarizing scientific documents from multiple facets. We provide extensive analyses and results to investigate the characteristics of FacetSum. Our observations call for the development of models capable of handling very long documents and outputting controlled text. Specifically, we will consider exploring the following topics in future work: (1) incorporating methods for long-document processing, such as reducing input length by extracting key sentences (Pilault et al., 2020) or segments Zhao et al. (2020); (2) examining the possibility of building a benchmark for systematic generalization Bahdanau et al. (2018) with the domain categories; (3) automatically structuring traditional abstracts Huang et al. (2020) with FacetSum.
References
- Bahdanau et al. (2018) Dzmitry Bahdanau, Shikhar Murty, Michael Noukhovitch, Thien Huu Nguyen, Harm de Vries, and Aaron Courville. 2018. Systematic generalization: What is required and can it be learned? In International Conference on Learning Representations.
- Belica (2021) Mišo Belica. 2021. sumy: Automatic text summarizer. https://github.com/miso-belica/sumy.
- Cachola et al. (2020) Isabel Cachola, Kyle Lo, Arman Cohan, and Daniel S Weld. 2020. Tldr: Extreme summarization of scientific documents. In Proceedings of the 2020 Conference on Empirical Methods in Natural Language Processing: Findings, pages 4766–4777.
- Cohan et al. (2018) Arman Cohan, Franck Dernoncourt, Doo Soon Kim, Trung Bui, Seokhwan Kim, Walter Chang, and Nazli Goharian. 2018. A discourse-aware attention model for abstractive summarization of long documents. In Proceedings of the 2018 Conference of the North American Chapter of the Association for Computational Linguistics: Human Language Technologies, Volume 2 (Short Papers), pages 615–621.
- Collins et al. (2017) Ed Collins, Isabelle Augenstein, and Sebastian Riedel. 2017. A supervised approach to extractive summarisation of scientific papers. In Proceedings of the 21st Conference on Computational Natural Language Learning (CoNLL 2017), pages 195–205, Vancouver, Canada. Association for Computational Linguistics.
- Contractor et al. (2012) Danish Contractor, Yufan Guo, and Anna Korhonen. 2012. Using argumentative zones for extractive summarization of scientific articles. In Proceedings of COLING 2012, pages 663–678.
- Dong et al. (2020) Yue Dong, Andrei Romascanu, and Jackie CK Cheung. 2020. Hiporank: Incorporating hierarchical and positional information into graph-based unsupervised long document extractive summarization. arXiv preprint arXiv:2005.00513.
- Emerald (2021) Emerald. 2021. Writing an article abstract. https://www.emeraldgrouppublishing.com/how-to/authoring-editing-reviewing/write-article-abstract. [Online; accessed 26-January-2021].
- Erkan and Radev (2004) Günes Erkan and Dragomir R Radev. 2004. Lexrank: Graph-based lexical centrality as salience in text summarization. Journal of artificial intelligence research, 22:457–479.
- Gidiotis and Tsoumakas (2019) Alexios Gidiotis and Grigorios Tsoumakas. 2019. Structured summarization of academic publications. In Joint European Conference on Machine Learning and Knowledge Discovery in Databases, pages 636–645. Springer.
- Gidiotis and Tsoumakas (2020) Alexios Gidiotis and Grigorios Tsoumakas. 2020. A divide-and-conquer approach to the summarization of long documents. IEEE/ACM Transactions on Audio, Speech, and Language Processing, 28:3029–3040.
- Gong and Liu (2001) Yihong Gong and Xin Liu. 2001. Generic text summarization using relevance measure and latent semantic analysis. In Proceedings of the 24th annual international ACM SIGIR conference on Research and development in information retrieval, pages 19–25.
- Grusky et al. (2018) Max Grusky, Mor Naaman, and Yoav Artzi. 2018. Newsroom: A dataset of 1.3 million summaries with diverse extractive strategies. In Proceedings of the 2018 Conference of the North American Chapter of the Association for Computational Linguistics: Human Language Technologies, Volume 1 (Long Papers), pages 708–719.
- Hartley (2014) James Hartley. 2014. Current findings from research on structured abstracts: an update. Journal of the Medical Library Association: JMLA, 102(3):146.
- Hartley and Sydes (1997) James Hartley and Matthew Sydes. 1997. Are structured abstracts easier to read than traditional ones? Journal of Research in Reading, 20(2):122–136.
- Hartley et al. (1996) James Hartley, Matthew Sydes, and Anthony Blurton. 1996. Obtaining information accurately and quickly: are structured abstracts more efficient? Journal of information science, 22(5):349–356.
- Honnibal et al. (2020) Matthew Honnibal, Ines Montani, Sofie Van Landeghem, and Adriane Boyd. 2020. spaCy: Industrial-strength Natural Language Processing in Python.
- Huang et al. (2020) Ting-Hao Huang, Chieh-Yang Huang, Chien-Kuang Cornelia Ding, Yen-Chia Hsu, and C Lee Giles. 2020. Coda-19: Using a non-expert crowd to annotate research aspects on 10,000+ abstracts in the covid-19 open research dataset. In Proceedings of the 1st Workshop on NLP for COVID-19 at ACL 2020.
- Jaidka et al. (2016) Kokil Jaidka, Muthu Kumar Chandrasekaran, Sajal Rustagi, and Min-Yen Kan. 2016. Overview of the cl-scisumm 2016 shared task. In Proceedings of the joint workshop on bibliometric-enhanced information retrieval and natural language processing for digital libraries (BIRNDL), pages 93–102.
- Jaidka et al. (2018) Kokil Jaidka, Muthu Kumar Chandrasekaran, Sajal Rustagi, and Min-Yen Kan. 2018. Insights from cl-scisumm 2016: the faceted scientific document summarization shared task. International Journal on Digital Libraries, 19(2-3):163–171.
- Kim et al. (2011) Su Nam Kim, David Martinez, Lawrence Cavedon, and Lars Yencken. 2011. Automatic classification of sentences to support evidence based medicine. In BMC bioinformatics, volume 12, pages 1–10. BioMed Central.
- Lewis et al. (2020) Mike Lewis, Yinhan Liu, Naman Goyal, Marjan Ghazvininejad, Abdelrahman Mohamed, Omer Levy, Veselin Stoyanov, and Luke Zettlemoyer. 2020. Bart: Denoising sequence-to-sequence pre-training for natural language generation, translation, and comprehension. In Proceedings of the 58th Annual Meeting of the Association for Computational Linguistics, pages 7871–7880.
- Lu et al. (2020) Yao Lu, Yue Dong, and Laurent Charlin. 2020. Multi-xscience: A large-scale dataset for extreme multi-document summarization of scientific articles. In Proceedings of the 2020 Conference on Empirical Methods in Natural Language Processing (EMNLP), pages 8068–8074.
- Mihalcea and Tarau (2004) Rada Mihalcea and Paul Tarau. 2004. TextRank: Bringing order into text. In Proceedings of the 2004 Conference on Empirical Methods in Natural Language Processing, pages 404–411, Barcelona, Spain. Association for Computational Linguistics.
- Nallapati et al. (2017) Ramesh Nallapati, Feifei Zhai, and Bowen Zhou. 2017. Summarunner: a recurrent neural network based sequence model for extractive summarization of documents. In Proceedings of the Thirty-First AAAI Conference on Artificial Intelligence, pages 3075–3081.
- Narayan et al. (2018) Shashi Narayan, Shay B Cohen, and Mirella Lapata. 2018. Don’t give me the details, just the summary! topic-aware convolutional neural networks for extreme summarization. In Proceedings of the 2018 Conference on Empirical Methods in Natural Language Processing, pages 1797–1807.
- Ott et al. (2019) Myle Ott, Sergey Edunov, Alexei Baevski, Angela Fan, Sam Gross, Nathan Ng, David Grangier, and Michael Auli. 2019. fairseq: A fast, extensible toolkit for sequence modeling. In Proceedings of NAACL-HLT 2019: Demonstrations.
- Paulus et al. (2018) Romain Paulus, Caiming Xiong, and Richard Socher. 2018. A deep reinforced model for abstractive summarization. In International Conference on Learning Representations.
- Pilault et al. (2020) Jonathan Pilault, Raymond Li, Sandeep Subramanian, and Chris Pal. 2020. On extractive and abstractive neural document summarization with transformer language models. In Proceedings of the 2020 Conference on Empirical Methods in Natural Language Processing (EMNLP), pages 9308–9319, Online. Association for Computational Linguistics.
- Rosenfeldt et al. (2000) Franklin L Rosenfeldt, John T Dowling, Salvatore Pepe, and Meryl J Fullerton. 2000. How to write a paper for publication. Heart, Lung and Circulation, 9(2):82–87.
- See et al. (2017) Abigail See, Peter J Liu, and Christopher D Manning. 2017. Get to the point: Summarization with pointer-generator networks. In Proceedings of the 55th Annual Meeting of the Association for Computational Linguistics (Volume 1: Long Papers), pages 1073–1083.
- Sharma et al. (2019) Eva Sharma, Chen Li, and Lu Wang. 2019. Bigpatent: A large-scale dataset for abstractive and coherent summarization. In Proceedings of the 57th Annual Meeting of the Association for Computational Linguistics, pages 2204–2213.
- Stead et al. (2019) Connor Stead, Stephen Smith, Peter Busch, and Savanid Vatanasakdakul. 2019. Emerald 110k: a multidisciplinary dataset for abstract sentence classification. In Proceedings of the The 17th Annual Workshop of the Australasian Language Technology Association, pages 120–125.
- Suppe (1998) Frederick Suppe. 1998. The structure of a scientific paper. Philosophy of Science, 65(3):381–405.
- Tauchmann et al. (2018) Christopher Tauchmann, Thomas Arnold, Andreas Hanselowski, Christian M Meyer, and Margot Mieskes. 2018. Beyond generic summarization: A multi-faceted hierarchical summarization corpus of large heterogeneous data. In Proceedings of the Eleventh International Conference on Language Resources and Evaluation (LREC 2018).
- Vanderwende et al. (2007) Lucy Vanderwende, Hisami Suzuki, Chris Brockett, and Ani Nenkova. 2007. Beyond sumbasic: Task-focused summarization with sentence simplification and lexical expansion. Information Processing & Management, 43(6):1606–1618.
- Yasunaga et al. (2019) Michihiro Yasunaga, Jungo Kasai, Rui Zhang, Alexander R. Fabbri, Irene Li, Dan Friedman, and Dragomir R. Radev. 2019. Scisummnet: A large annotated corpus and content-impact models for scientific paper summarization with citation networks. Proceedings of the AAAI Conference on Artificial Intelligence, 33(01):7386–7393.
- Zhao et al. (2020) Yao Zhao, Mohammad Saleh, and Peter J Liu. 2020. Seal: Segment-wise extractive-abstractive long-form text summarization. arXiv preprint arXiv:2006.10213.
Appendix A Keyword List for Identifying Paper Sections
| Category | Keyword |
|---|---|
| Introduction | intro, purpose |
| Method | design, method, approach |
| Result | result, find, discuss, analy |
| Conclusion | conclu, future |
Appendix B Most Frequent Words in Each Abstract Facet
| Facet | Verb | Noun | Adjective |
|---|---|---|---|
| Purpose | aim | paper | social |
| examin | purpos | new | |
| investig | studi | organiz | |
| explor | manag | differ | |
| develop | research | public | |
| Method | base | studi | structur |
| conduct | data | qualit | |
| collect | analysi | differ | |
| test | model | empir | |
| develop | paper | social | |
| Findings | found | result | signific |
| indic | studi | posit | |
| suggest | manag | social | |
| provid | effect | differ | |
| identifi | relationship | higher | |
| Value | provid | studi | new |
| contribut | paper | social | |
| develop | research | differ | |
| base | manag | empir | |
| examin | literatur | import |
Appendix C Implementation Details
To make BART take full text as input, we extend the positional embedding to 10,000 tokens. This was required to leverage long text of papers in FacetSum with average length of 6000 words.
Experiments of unsupervised baselines are implemented with Sumy Belica (2021) and official code of HipoRank. We tune the hyperparameters of HipoRank with the validation set. The BART experiments are finetuned using Fairseq Ott et al. (2019), with learning rate of , batch size of 1, max tokens per batch of 10,000 and update frequency of 4. We finetune all models for 20,000 steps with single NVIDIA Tesla V100 16GB and we report the results of the last checkpoint. The small batch size is the consequence of the large input size. For inference, we use beam size of 4 and maximum length of 500/200 tokens for BART/BART-Facet respectively.
Appendix D Domains Covered by FacetSum
In Figure 3, we show the distribution of domain categories in FacetSum.
Appendix E Full Results
In this section, we provide additional experiment results. In Table 6, we show the full results of the extractive oracle system (first row in Table 3). In Table 7, we provide full results of all other models (heuristic models, unsupervised models, and supervised models in Table 3).
| R1/R2/RL | Full | Purpose | Method | Findings | Value |
|---|---|---|---|---|---|
| Fullbody | 64.92/33.75/60.39 | 57.35/30.24/49.42 | 53.30/26.40/45.58 | 59.30/33.25/52.42 | 53.39/26.84/45.55 |
| ICbody | 58.82/28.42/54.17 | 53.60/27.13/45.73 | 43.13/17.08/35.64 | 52.03/25.90/44.86 | 48.97/22.84/41.09 |
| Introbody | 53.32/22.96/48.59 | 52.51/26.48/44.66 | 41.27/16.05/34.03 | 44.67/17.49/37.10 | 44.65/17.80/36.47 |
| Methodbody | 52.05/20.52/47.35 | 45.16/16.61/36.84 | 48.60/21.67/41.00 | 44.77/17.69/37.67 | 40.94/13.55/32.94 |
| Resultbody | 56.85/23.79/51.97 | 47.90/18.07/38.96 | 42.31/14.46/34.41 | 53.71/26.32/46.44 | 44.93/16.91/36.66 |
| Conclubody | 55.26/25.26/50.58 | 47.76/18.88/38.94 | 40.53/13.84/32.83 | 51.81/25.81/44.73 | 46.14/19.66/38.10 |
| R1/R2/RL | Full | Purpose | Method | Findings | Value |
|---|---|---|---|---|---|
| FacetSum Test | |||||
| Lead-K | 39.65/11.01/36.78 | 21.95/4.89/17.83 | 18.69/5.94/15.29 | 18.84/4.31/15.92 | 20.14/3.05/16.08 |
| Tail-K | 35.90/10.96/33.31 | 25.48/7.23/21.67 | 14.88/2.64/12.62 | 19.25/4.41/16.66 | 20.90/4.71/17.43 |
| SumBasic | 42.11/10.01/38.71 | 22.23/4.68/18.17 | 18.40/5.02/15.41 | 19.15/3.93/16.31 | 20.64/3.08/16.57 |
| LexRank | 46.35/15.12/42.18 | 22.97/5.28/18.72 | 19.44/5.84/16.23 | 21.66/5.66/18.11 | 22.39/4.05/17.75 |
| LSA | 39.84/9.59/35.98 | 22.47/4.91/18.29 | 19.10/5.58/15.86 | 20.29/4.59/16.92 | 20.96/3.31/16.62 |
| TextRank | 46.90/16.04/41.87 | 28.29/9.39/21.67 | 17.55/4.32/13.62 | 23.90/7.17/18.63 | 25.99/7.07/19.23 |
| HipoRank | 46.48/15.42/42.89 | 27.71/8.29/22.73 | 18.27/4.65/15.20 | 21.75/5.31/18.38 | 24.54/5.26/19.68 |
| BART I+C | 47.21/19.59/44.36 | 46.61/27.10/41.14 | 23.85/7.98/20.75 | 16.84/5.34/14.72 | 7.21/1.93/5.85 |
| BART-Facet I+C | 50.62/20.97/47.09 | 49.59/28.70/43.47 | 34.61/11.82/29.07 | 36.42/12.63/30.97 | 35.37/11.75/28.90 |
| BART full body | 45.49/18.10/42.74 | 46.74/27.09/41.21 | 23.66/7.92/20.53 | 16.39/4.63/14.33 | 6.30/1.62/5.07 |
| BART-Facet full body | 49.29/19.60/45.76 | 48.65/27.72/42.55 | 33.49/11.01/28.07 | 34.46/10.49/28.98 | 35.27/11.44/28.70 |
| FacetSum OA-Test | |||||
| BART I+C | 48.85/20.84/44.97 | 49.43/29.44/43.51 | 31.1/10.16/26.73 | 13.78/4.45/11.79 | 0.4/0.1/0.31 |
| BART-Facet I+C | 48.31/22.63/51.32 | 49.59/28.69/43.66 | 35.82/12.84/30.16 | 37.46/14.02/32.22 | 35.9/12.75/29.68 |
Appendix F Example of Outputs by BART and BART-Facet
In Table 8, we show an example of the generated faceted summaries by BART and BART-Facet of the same paper, compared against the ground-truth faceted abstract.
| Facet | Ground Truth | BART | BART-Facet |
|---|---|---|---|
| Purpose | The purpose of this paper is to advance the information society research by examining and better understanding the impact of the adoption information and communication technologies (ICT) within households on improving sustainability. | The purpose of this paper is to answer the question: Does the adoption of information and communication technologies (ICT) within households contribute to sustainability? For this purpose, the study focuses on addressing the following specific questions: What criteria clearly and deeply describe the ICT adoption within households? What are the criteria that clearly describe sustainability within households, and are there statistically significant correlations between ICT and sustainability? | The purpose of this paper is to answer the question: Does the adoption of information and communication technologies (ICT) within households contribute to sustainability? |
| Method | The survey questionnaire was used and data collected from 679 Polish households were statistically analyzed to understand the phenomena of ICT adoption and sustainability as well as identify correlations between them. | A survey was carried out in Poland. The data were collected through a structured questionnaire and analyzed using structural equation modeling (SEM). | The study is based on a quantitative research design. The data were collected through a questionnaire survey among the households in Poland. The survey was carried out in two phases. In the first phase, the ICT adoption within households was measured using a structured questionnaire, and in the second phase the data were analyzed using structural equation modeling (SEM) to test the hypothesized relationships. |
| Findings | The research findings reveal that the ICT adoption is well described by the ICT outlay, information culture, ICT management and ICT quality, whereas sustainability is composed of ecological, economic, socio-cultural and political sustainability. Furthermore, the ICT quality, ICT management and information culture have a significant impact on sustainability, whereas the ICT outlay does not have such an impact. | Results show that ICT is a key enabler of sustainability in households. The results also show that there are statistically significant correlation between the IIT adoption within the households and sustainability. | The results show that the adoption of ICT within households is positively related to sustainability. The results also show that there are statistically significant correlations between the ICT adoption within households and sustainability. |
| Value | The paper provides and verifies a new theoretical model of sustainable information society to depict various dimensions shaping the ICT adoption and their impact on different types of sustainability in the context of households. | This study is the first to empirically investigate the impact of ICT on sustainability. The findings of this study will be complementary with findings concerning the contribution of IIT to sustainability in enterprises and allow for the advancement in the sustainable information society (SIS) research. | This study contributes to the literature by providing a deeper understanding of the ICT adoption within households and the contribution of ICT to sustainability in transition economies, i.e. the former European Eastern Bloc countries. |