SReferences
High resolution mid-infrared optical coherence tomography with kHz line rate
Abstract
We report on Mid-infrared (MIR) OCT at 4 m based on collinear sum-frequency upconversion and promote the A-scan scan rate to 3 kHz. We demonstrate the increased imaging speed for two spectral realizations, one providing an axial resolution of 8.6 µm, and one providing a record axial resolution of 5.8 µm. Image performance is evaluated by sub-surface micro-mapping of a plastic glove and real-time monitoring of CO2 in parallel with OCT imaging.
1 Introduction
Mid-infrared optical coherence tomography (MIR OCT) was first introduced in 2007 by Colin et al [1]. It is however only recently that the technology has become mature enough to harness the deep penetration ability when imaging turbid media. In one approach a supercontinuum (SC) source is combined with a slow pyroelectric array detector [2] where a second is based on frequency entanglement via spontaneous parametric downconversion [3]. A third technology was realized by the Authors and is based on an SC source combined with sum-frequency upconversion [4]. To date, this solution still holds the record in axial resolution and imaging speed of 8.6 µm and 0.3 kHz, respectively.
In this paper we report on an improvement of the sum-frequency upconversion detection scheme that provides a tenfold increase in imaging speed to a 3 kHz line rate. Additionally, by introducing an improvement of the optical setup, we present two spectral bandwidth realizations, one providing an 8.6 µm axial resolution, and one providing a record 5.8 µm axial resolution. We evaluate the imaging performance for the two bandwidths and we characterize the noise, sensitivity and axial resolution. As specific demonstration cases we image a nitrile plastic glove and provide a temporal demonstration of real-time monitoring of CO2 in parallel with OCT imaging.
2 Methods and materials
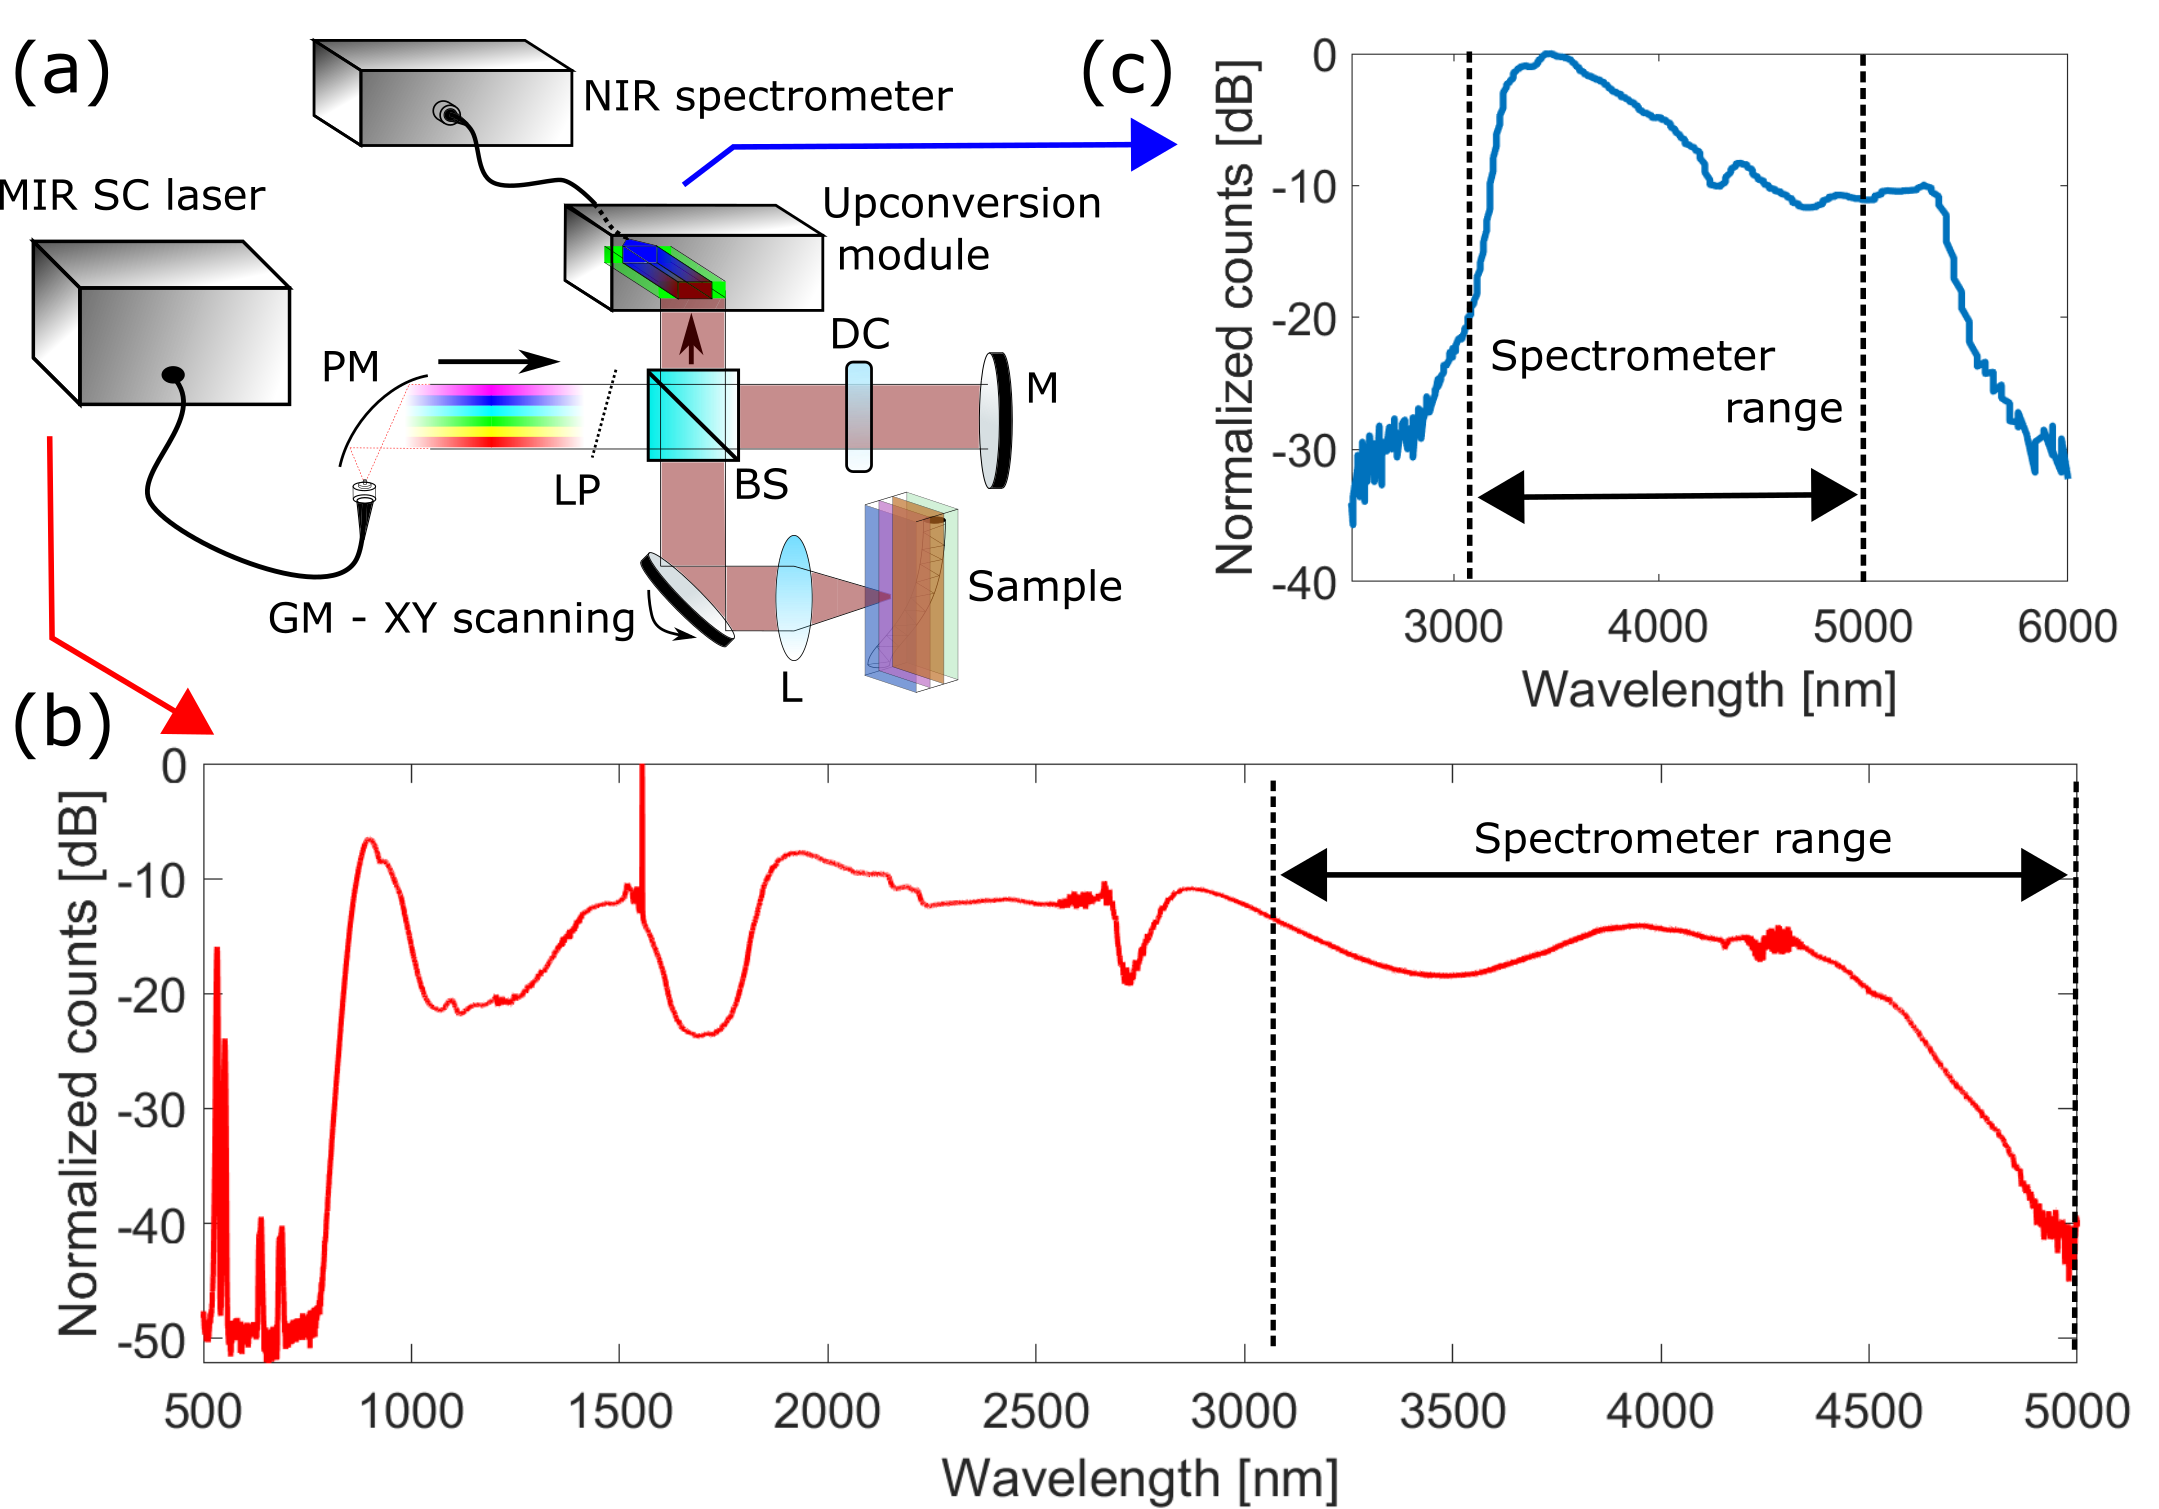
The MIR OCT system presented in this work is an improved version of the first system used in [4]. It exploits the latest development in MIR SC and broadband sum-frequency upconversion technology. A schematic of the OCT system is presented in Fig. 1(a). A custom-made MIR SC source based on a 1.55 µm master-oscillator power amplifier (MOPA) pump laser with a pulse duration of 1 ns and repetition rate of 2 MHz, is pumping a ZBLAN fiber, which provides a continuous spectrum from 0.8 to 5 µm as shown in Fig. 1(b). The light beam is subsequently long-pass (LP) filtered to remove unexploited power in the near-infrared (NIR) range with either a 3.5 µm or a 2.4 µm LP filter yielding the bandwidths BW1 (3.5 - 5.0 µm) or BW2 (2.4 - 4.9 µm), respectively. By using BW2 instead of BW1 we allow for utilization of more of the full detection range for the combined spectrometer and upconversion module (3.2 - 5.1 µm). After the spectral selection, the light beam enters the Michelson interferometer with a reference and a sample arm. In the sample arm the sample is exposed to either 18 mW (BW1) or 52 mW (BW2). The full detection range (3.2 - 5.1 µm) corresponds to 22 mW. The sample is scanned with a lateral resolution of µm [4].
After recombination of the reference and sample beam, the mixed beam is focused into the upconversion module where upconversion from MIR wavelengths to NIR wavelengths is carried out based on sum-frequency generation. The module is composed of a 1064 nm laser cavity with a periodically poled lithium-niobate crystal. In contrast to the recent upconversion system applied in [5, 4], where the poling period is constant and the broadband phase-matching is accomplished by angularly distributing the light beam by a tight beam focus, the broadband phase-matching in this setup is achieved collinearly [6]. This is done by exploiting a chirped periodically poled crystal with the poling period linearly decreasing from 23.5 µm to 22 µm from input to output over a 20 mm length. By mixing the 1064 nm CW laser with the broad MIR spectrum, the MIR wavelengths are converted to NIR wavelengths with spectral components converted separately in space along the propagation axis dictated by the phase-matching condition , where the respective k-vectors are those of the MIR wavelength, the 1064 nm mixing laser, the poling periodicity , and the NIR wavelength. The spectral range (or bandwidth) of the upconversion module, measured with a glow bar as light source, is shown in Fig 1(c). Finally, the upconverted light is guided by a single mode fiber to a commercial NIR spectrometer (Wasatch Photonics) with 4096 elements covering the wavelength range of 796-879 nm with a maximum line rate of 40 kHz. An electronic gain setting was selected to maximize the effective dynamic range. In addition to the MIR OCT system, a customized NIR OCT system designed for dermatological imaging [7] was utilized for comparison. To construct OCT images, normalization, k-space re-sampling, and general dispersion compensation were carried out [7, 8].
3 Results
3.1 Noise characterization
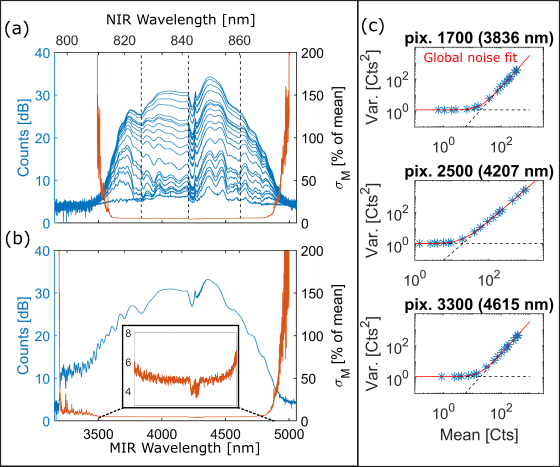
The first step in evaluating the MIR OCT system was to characterize the noise properties. The raw spectra with dark count subtraction is presented for BW1 in Fig. 2(a) for different reference arm power levels (sample arm blocked), and for BW2 in Fig. 2(b) for the maximum reference power level. Each spectrum is an average of 500 sequentially recorded single spectra with a spectrometer integration time of 300 µs. This tenfold decrease in integration time, compared to our previous report [4], is possible due to the improved collinear upconversion efficiency which significantly increases the strength of the interferometric OCT signal.
In OCT the noise is comprised of three components: the read (digitization and read-out) and dark noise dictated by the detector, the shot noise dictated by the photon statistics, and finally the excess noise, , typically stemming from the spectral power fluctuations of the light source, which are significant when using an SC source. Together they present the total noise fluctuations seen in a detected spectrum described in variance as . When evaluating the single pixel noise we calculate the relative total noise (standard deviation) , with M designating a pulse train of M pulses within the spectrometer integration time. We find for the maximum signal (spectrum) a in the range of (red graphs, Fig 2(a) and 2(b)) where the best NIR SC sources for OCT show levels of around [9]. As we shall see, for these high signal levels the noise is solely dominated by excess noise of the SC source. The boundaries for in Fig. 2(a) (largest power level) and (b) express the bandwidth of BW1 and BW2 to 3.5-5.0 µm and 3.2-4.9 µm, respectively. We note that the dips in the spectra of Fig. 2(a) and (b) at µm wavelength is a result of the ambient atmospheric CO2 absorption.
The next step is to decompose the three noise components of . The term is expected to be independent of laser power, where obeys Poissonian statistics and thus scales linearly with the mean power registered by the spectrometer. scales with the mean power squared. It depends on the pulse repetition rate and the pulse-to-pulse relative intensity noise (RIN) of the SC source determined by the nonlinear dynamics of the SC generation process [10]. As our SC source is using long pump pulses, the SC generation is based on modulational instability amplifying quantum noise and is thus inherently noisy [11]. We therefore do not expect to have access to the shot-noise limited regime [12]. This is confirmed in Fig. 2(c) where single pixel signals of the spectral series of Fig. 2(a) are evaluated through the variance vs. mean signal. Fitting data sets by the total noise model with a, b, and c parameters acting as weighting of the three noise terms, we find that within the spectrometer dynamic range the noise is entirely dominated by either for low signal levels, or for high signal levels. The detector noise is found to render count. An optimum operation regime is found at counts where .
3.2 OCT performance
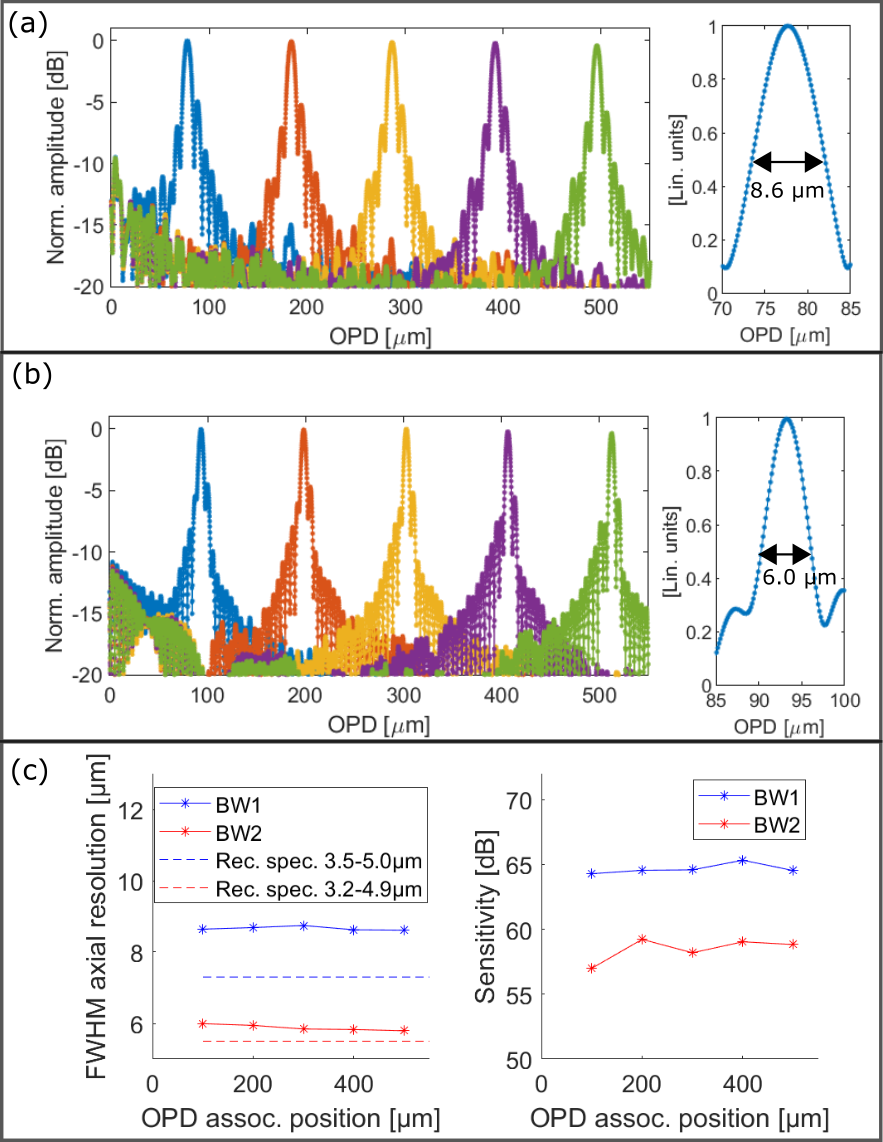
The next step was to evaluate the axial resolution and sensitivity performance of the MIR OCT system operated at a 3 kHz line rate. A mirror was inserted as a sample and a controlled attenuation of the signal from this was introduced to avoid detector saturation. In doing so, the point-spread-function limited A-scan was generated. A vital part of this is careful re-sampling from wavelength space to wavenumber space and dispersion compensation to remove the residual dispersion mismatch between reference and sample arm [8]. Zero-padding was done prior to the Fourier transform in order to mitigate any sampling influence on resolution and sensitivity. Examples of A-scans for BW1 and BW2 are presented in Fig. 3(a) and (b), respectively, producing a signal 6 dB roll-off at 2.1 mm (not in figure). The respective zoom-ins of the shortest optical path difference (OPD) A-scan and associated axial resolution is marked. A summary of the associated A-scan resolutions is found in Fig. 3(c) (left). These are extracted by full-width half-maximum (FWHM) readings. For BW1 an axial resolution of 8.6-8.7 µm was found, matching that reported previously [4]. For BW2, we find an improved axial resolution of 5.8-6.0 µm, which to our knowledge is a record in µm center wavelength OCT. The theoretical resolutions of rectangularly shaped spectra defined by BW1 and BW2 (given by the FWHM of a sinc-shaped central lobe after Fourier transform) are marked by dashed lines in Fig. 3(c). As the read-off FWHM is strongly dependent on the spectral shape this theoretical comparison primarily reveals deviation in energy distribution between the perfect rectangular spectrum and a irregularly-shaped experimental spectrum.
Sensitivity values associated with the A-scans of Fig. 3(a) and (b) are presented in Fig. 3(c) (right). BW1 and BW2 demonstrates sensitivities of 65 dB and 59 dB, respectively, the difference being a result of the different reference signals applied. These values resemble that reported previously when using non-collinear upconversion [4].
3.3 Spatial and temporal imaging
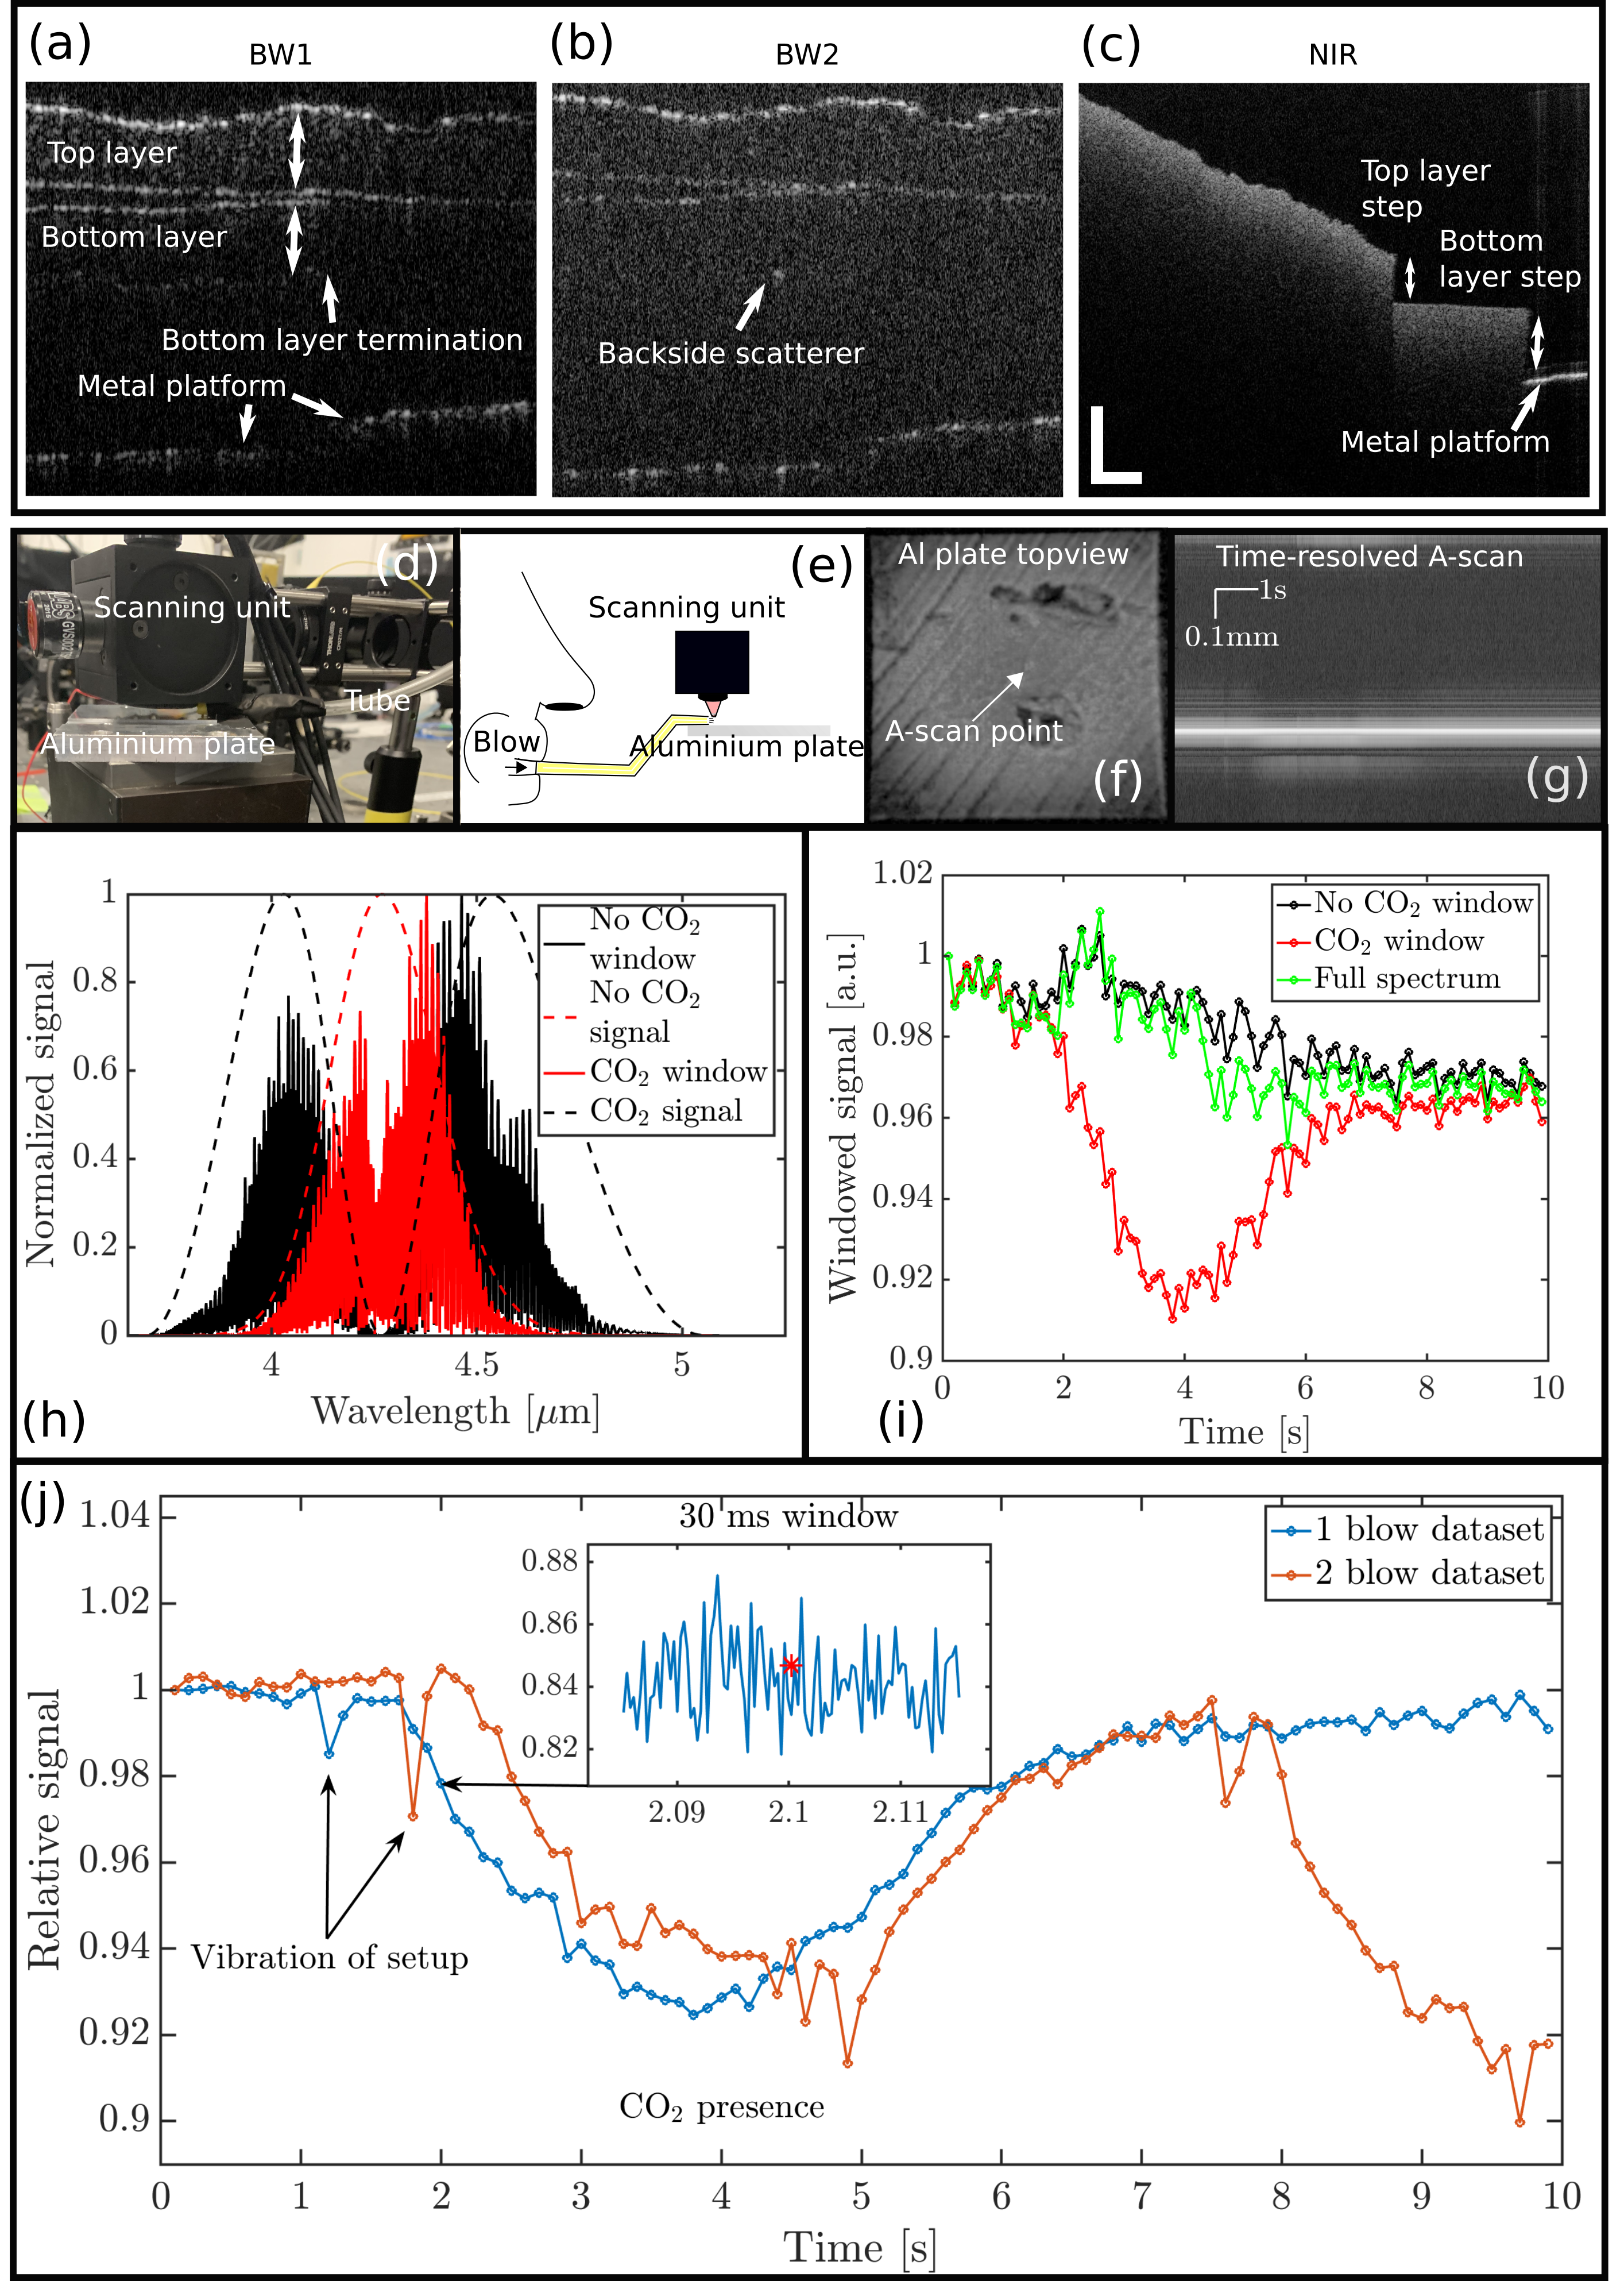
To demonstrate imaging capabilities, results from two imaging sessions are presented. The first is of a cut-out of a nitrile plastic glove (Dermatril) from Honeywell, USA, certified for laboratory use. The glove represents a highly scattering material in the NIR where MIR OCT is expected to provide better penetration. This fact is documented in Fig. 4(a)-(c). B-scans of the glove produced by applying BW1 and BW2 are depicted in Fig. 4(a) and (b), respectively, where penetration through the two layers of plastic is manifested in imaging the underlying metal platform on which the glove rests. In Fig. 4(a) BW1 enables visualization of the backside of the second layer where it is only clearly visible in a single point for BW2 in Fig. 4(b), due to the reduced sensitivity. As seen from Fig. 4(c), our NIR OCT system does not penetrate even a single plastic layer and from the surface a signal extinction tail is seen, similar to what is observed when multiple scattering comprises the majority of the depth signal [4]. For this reason, the NIR OCT scan is taken across the edge of the cut-off in a "staircase" manner in order to visualize both plastic layers and the metal platform.
The second demonstration is performed by spectroscopically monitoring CO2 deviations in the air above an aluminium plate. A photo of the sample setup is given in Fig. 4(d). A voluntary person blows into a plastic tube extending down to the plate, as illustrated in Fig. 4(e), where the tube termination is arranged so no air flow enters the interferometer. During this exercise, A-scans are recorded at a fixed single point on the metal plate, the position indicated in the C-scan in Fig. 4(f). In that way, a temporal B-scan is constructed as depicted in Fig. 4(g). Fig. 4(h) shows the spectral decomposition of the corresponding interferograms into two sub-windows: one being a coarse CO2 window at 4.27 µm with a FWHM (Gaussian) width of 295 nm (red dashed line) and one the entire spectrum (BW1) subtracted by the CO2 window (black dashed line). The integrated signals in the two spectral windows are then evaluated during a single human exhalation in a time slot of 10 seconds as presented in Fig. 4(i). The ratio between the two windowed signals is depicted in Fig. 4(j) (blue data points). First a mechanical instability at 1.2s is seen as a sharp dip indicating initiation of the exhalation and thereby translation of the air column in the tube. Secondly, a significant drop to a relative signal intensity of 0.92 is seen lasting four seconds before the initial condition is regained. The four seconds corresponds to the exhalation time of our test person manifested in a smooth spectral transition. A retake of the experiment with two exhalations is also presented in Fig. 4(j) (orange data points). It is important to point out that each data point in Fig. 4(i) and (j), is an average of 100 spectra, each spectrum measured over a 300 µs integration. The finer temporal resolution is indicated by the inset of Fig. 4(j) which also marks the spectral data of Fig. 4(h) as a red data point.
4 Discussion and conclusion
Going from a non-collinear to a collinear upconversion provides unequivocally a significant advancement in the MIR OCT performance. The advancement was demonstrated for a 300 µs spectrometer integration time and for two different source bandwidths, BW1 and BW2. BW1 and BW2 were for the most of the detector dynamic range dominated by excess noise; not surprising when utilizing a modulation instability based SC source. From these the best case axial resolutions of 8.6 µm and 5.8 µm were produced, the latter a new record in MIR to the best of our knowledge.
An image demonstration was performed on a plastic glove (Fig. 4(a)-(c)) with the advantage in penetration seen when comparing the NIR OCT image with MIR OCT images of BW1 and BW2. What is noteworthy is the difference in Fig. 4(a) and (b) where the backside of the second plastic layer is visible for (a), but this signal is entirely buried in noise for (b) apart from in a single point. Also the difference in the general background noise can be recognized. This example underlines the important outcome of the sensitivity performance when imaging a curving and rough surface, as a glove, where the dB sensitivity difference between BW1 and BW2 (Fig. 3(c)) is decisive when tracking such a sub-surface interface. Careful consideration is thus needed when prioritizing between axial resolution and sensitivity in applying our system.
A simple temporal imaging demonstration was performed as a proof-of-principle to highlight the system’s unique ability to spectroscopically monitor CO2 flow in parallel with OCT imaging. With a temporal resolution of 300 µs we show that this record imaging speed can follow real-time gas-flow fluctuations, but is however susceptible to chromatic effects from mechanical vibrations resulting in misleading spectroscopic signals as indicated in Fig. 4(j). This means that it is essential to have the sample setup absolutely fixed during spectroscopic measurements in order to mitigate error sources spurred by spatial chromatism.
In conclusion, we have presented a new MIR OCT scheme based on collinear sum-freqeuncy upconversion introducing kHz line rate MIR OCT imaging and an axial resolution below 6 µm. With this, we have reached a speed where real-time gas flow tracing can be monitored in the setting of OCT.
5 Disclosures
The authors declare no conflicts of interest.
6 Funding
We acknowledge support by Innovation Fund Denmark under the project J. No. 4107-00011A (ShapeOCT).
References
- [1] Christopher S Colley, Jeremy C Hebden, David T Delpy, Alison D Cambrey, Robert A Brown, Evgeny A Zibik, Wing H Ng, Luke R Wilson, and John W Cockburn. Mid-infrared optical coherence tomography. Review of Scientific Instruments, 78(12):123108, 2007.
- [2] Ivan Zorin, Rong Su, Andrii Prylepa, Jakob Kilgus, Markus Brandstetter, and Bettina Heise. Mid-infrared fourier-domain optical coherence tomography with a pyroelectric linear array. Optics express, 26(25):33428–33439, 2018.
- [3] Aron Vanselow, Paul Kaufmann, Ivan Zorin, Bettina Heise, Helen M Chrzanowski, and Sven Ramelow. Frequency-domain optical coherence tomography with undetected mid-infrared photons. Optica, 7(12):1729–1736, 2020.
- [4] Niels M Israelsen, Christian R Petersen, Ajanta Barh, Deepak Jain, Mikkel Jensen, Günther Hannesschläger, Peter Tidemand-Lichtenberg, Christian Pedersen, Adrian Podoleanu, and Ole Bang. Real-time high-resolution mid-infrared optical coherence tomography. Light: Science & Applications, 8(1):1–13, 2019.
- [5] Ajanta Barh, Christian Pedersen, and Peter Tidemand-Lichtenberg. Ultra-broadband mid-wave-ir upconversion detection. Optics letters, 42(8):1504–1507, 2017.
- [6] Søren MM Friis and Lasse Høgstedt. Upconversion-based mid-infrared spectrometer using intra-cavity linbo 3 crystals with chirped poling structure. Optics letters, 44(17):4231–4234, 2019.
- [7] Niels Møller Israelsen, Michael Maria, Mette Mogensen, Sophie Bojesen, Mikkel Jensen, Merete Haedersdal, Adrian Podoleanu, and Ole Bang. The value of ultrahigh resolution oct in dermatology-delineating the dermo-epidermal junction, capillaries in the dermal papillae and vellus hairs. Biomedical optics express, 9(5):2240–2265, 2018.
- [8] Adrian Bradu, Niels Møller Israelsen, Michael Maria, Manuel J Marques, Sylvain Rivet, Thomas Feuchter, Ole Bang, and Adrian Podoleanu. Recovering distance information in spectral domain interferometry. Scientific reports, 8(1):1–16, 2018.
- [9] Mikkel Jensen, Iván Bravo Gonzalo, Rasmus Dybbro Engelsholm, Michael Maria, Niels Møller Israelsen, Adrian Podoleanu, and Ole Bang. Noise of supercontinuum sources in spectral domain optical coherence tomography. JOSA B, 36(2):A154–A160, 2019.
- [10] Kyei Kwarkye, Mikkel Jensen, Rasmus D Engelsholm, Manoj K Dasa, Deepak Jain, Patrick Bowen, Peter M Moselund, Christian R Petersen, and Ole Bang. In-amplifier and cascaded mid-infrared supercontinuum sources with low noise through gain-induced soliton spectral alignment. Scientific reports, 10(1):1–11, 2020.
- [11] John M. Dudley, Goëry Genty, and Stéphane Coen. Supercontinuum generation in photonic crystal fiber. Reviews of Modern Physics, 78(4):1135–1184, 11 2006.
- [12] Shreesha Rao D. S., Mikkel Jensen, Lars Grüner-Nielsen, Jesper Toft Olsen, Peter Heiduschka, Björn Kemper, Jürgen Schnekenburger, Martin Glud, Mette Mogensen, Niels Møller Israelsen, and Ole Bang. Shot-noise limited, supercontinuum based optical coherence tomography. arXiv preprint arXiv:2010.05226, 2020.