Long-term Scientific Impact Revisited
Abstract
Citation based measures are widely used as quantitative proxies for subjective factors such as the importance of a paper or even the worth of individual researchers. Here we analyze the citation histories of papers published in journals of the American Physical Society between and and argue that state-of-the-art models of citation dynamics and algorithms for forecasting nonstationary time series are very likely to fail to predict the long-term ( years after publication) citation counts of highly-cited papers using citation data collected in a short period (say, years) after publication. This is so because those papers do not exhibit distinctive short-term citation patterns, although their long-term citation patterns clearly set them apart from the other papers. We conclude that even if one accepts that citation counts are proxies for the quality of papers, they are not useful evaluative tools since the short-term counts are not informative about the long-term counts in the case of highly-cited papers.
I Introduction
“There are things that can be measured. There are things that are worth measuring. But what can be measured is not always what is worth measuring; what gets measured may have no relationship to what we really want to know” [1]. These words of caution regarding the indiscriminate use of metrics in today’s society make us wonder whether citations of academic papers are among those things that are worth measuring. In our view, the answer is a resounding yes when citations are considered for their own sake [2, 3, 4]. In fact, citation networks, citation distributions and citation dynamics are topics that cover many of the issues addressed by complexity science [5]. In addition and in contrast to most problems addressed by that novel branch of science, the predictions of the mechanistic models of citation patterns can readily be tested against empirical data available in citation datasets.
However, when citation based measures are used as a quantitative proxy of a paper’s importance [6] or as a tool to evaluate the quality of journals [7, 8] as well as of individual researchers [9], the value of measuring citations is not evident. Here we argue that even if one accepts that citation counts are a good proxy for those subjective features, they are essentially worthless as evaluative tools because papers that are highly cited in the long term, say, years after publication, do not exhibit a distinctive citation record in, say, the first years after publication, which is the typical period used to evaluate the performance of individual researchers. This very feature makes the prediction of the long-term citation counts of highly-cited papers using state-of-the-art mechanistic models of citation dynamics [10] and algorithms for forecasting nonstationary time series [11] highly inaccurate.
In particular, in this paper we analyze the citation history of papers published in journals of the American Physical Society (APS) between and and sort them in 4 classes according to the similarity of the shapes of their cumulative citation distributions. We find a strong correlation between the class of a paper and its total citation counts years after publication. The citation distribution function associated to the class that is more likely to include highly-cited papers exhibits a distinctive shape with an inflection point at about years after publication that misdirects prediction models trained with data collected in a short period (say, years) after publication.
The rest of this paper is organized as follows. In section II we characterize the sample of papers extracted from the APS Data Sets for Research [12]. Modeling and predicting the citation counts of those papers are the focus of the other sections. In particular, the two mechanistic models of citation dynamics used to explain the citation counts, viz., the WSB model [10] and the SIR epidemic model [13], are described briefly in section III together with the basic ARIMA (AutoRegressive Integrated Moving Average) model [11] for time series prediction. The fitting and prediction performances of those models are then discussed in sections IV and V, respectively. Finally, section VI is reserved to our concluding remarks.
II The APS Dataset
The APS Data Sets for Research [12] comprises citing article pairs and bibliographic meta-data of papers published in the APS journals since . Here we focus on the sample of papers published between and that received at least citations during the five years period after their publication, which amounts to of the papers published in the APS journals in that period. The selected sample comprises papers published in Physical Review, in Physical Review Letters and in Reviews of Modern Physics. We track the number of citations that paper in this sample received up to years after its publication.
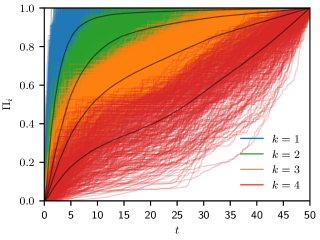
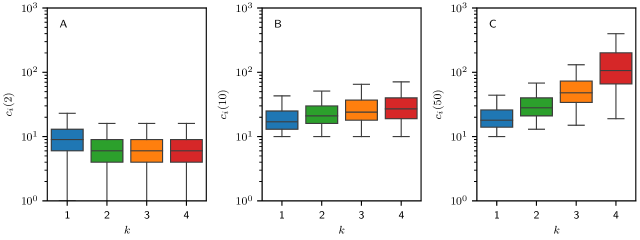
The cumulative distribution functions of the citations received by each targeted paper in the years period considered are shown in Fig. 1, where we have used the -means clustering algorithm [14] to sort those papers into classes according to the similarity of their cumulative distributions. The black curves in this figure indicate the typical (or average) cumulative distribution of each class. Of particular interest are the citations received in the first two years after publication since this is the period used to measure the Impact Factor (IF) of a journal [15]: papers in class received more than of their citations in that period, papers in class received about , papers in class , and papers in class received a meager . As illustrated in Fig. 2, which shows the boxplots of the number of citations received by papers in class at years after publication, there are no significant differences in the distribution of citations received by papers of distinct classes in that short time span (i.e., for years).
The boxplots of Fig. 2 reveal the intriguing finding that papers in class receive, on the average, more citations than the papers in the other classes for sufficiently large time spans. In fact, the average (or, more precisely, the median) number of citations increases monotonically with the class index in panels B and C that show the citation counts for and years after publication, respectively. Hence, papers in class are likely to be among the most cited ones. In fact, the odds that a randomly selected paper in class is among the most cited papers in our sample of papers is about . We emphasize that these results are not consequences of the definition of classes, which are determined by the similarity of the shapes of the citation patterns in Fig. 1 and do not use information about the number of citations received by the targeted papers.
Since the number of classes is an input parameter to the -means clustering algorithm, a word is in order about the choice . Of course, we have tried many different choices of , each choice resulting in a variant of Fig. 1. On the one hand, we have found it difficult to spot qualitative differences between the average cumulative distributions associated to adjacent classes for . On the other hand, for the average cumulative distribution that exhibits an inflection point and that characterizes class disappears because of the merging of classes and . Hence the choice .
III Models of citation dynamics
Here we focus on two mechanistic models of citation dynamics, viz., the WSB model and the SIR epidemic model, that can explain a large variety of citation patterns by tunning a few parameters only. In this section we offer a brief account of these two models and in the next sections we compare their fitting and prediction performances with the basic ARIMA (AutoRegressive Integrated Moving Average) model [11], which is widely used in fitting and forecasting nonstationary time series [16, 17]. Since the ARIMA model is not a model of citation dynamics, we will not examine it any further in this paper.
The aim of the mechanistic models, as well as of ARIMA, is to fit the empirical total citation counts received by paper up to years after its publication. In order to distinguish between the empirical citation counts and the citation counts predicted by the models we use the notation for the latter.
III.1 The WSB model
The WSB model is a successful mechanistic model of citation dynamics that builds on three assumptions, viz., preferential attachment, fitness and aging [10]. The name of the model is an acronym for the name of their proponents. Preferential attachment means that the probability that a publication is cited is an increasing function of its current number of citations [18, 19, 20]. Fitness expresses the notion that papers differ with respect to the perceived novelty and importance of their contents [21, 22], whereas aging captures the fact that the perceived novelty and importance of a paper eventually fade out [23]. Although there are many intangible factors behind an author’s decision to cite a paper, such as the reputation of its authors and of the journal where it was published [24] that cannot be described by a mechanistic model, the WSB model does a remarkably good job at predicting long-term citations of papers in classes and as we will show in this paper.
More pointedly, the WSB model expresses the total citations counts received by paper up to time after its publication through a disarmingly simple formula [10]
| (1) |
where . Here the paper-dependent parameters , and are related to the relative importance of paper with respect to the other papers, the time taken for paper to reach its citation peak, and its longevity, respectively. Those parameters are obtained by fitting eq. (1) to the data describing the citation history of paper . The parameter is the mean number of references of the papers in the sample considered, which has little effect on the overall predictive performance of the model and so it is set to the fixed value for all papers in the sample [10].
III.2 The SIR epidemic model
In line with the seminal attempt to describe the spread of Feynman diagrams through the theoretical physics communities of different countries using models of epidemics [25], the SIR epidemic model [26] was used recently to fit the citation history of highly-cited papers [13]. In this framework, the total number of citations paper receives up to time is
| (2) |
where is the number of papers in an abstract population of papers not yet written that are susceptible to cite paper and is the number of citations paper can still receive after time . The decrease in the number of susceptible papers is determined by a contact process that mimics the spread of an infectious disease, i.e.,
| (3) |
where is the number of papers that have cited paper before or at time and that can still influence susceptible papers to cite that paper. The parameter is a measure of the degree of persuasion of the influential papers and is a constant. The equation for the number of influential papers is
| (4) |
where the parameter controls the rate at which the influential papers cease to be persuasive to produce new citations of paper . Hence, the SIR epidemic model has three free parameters, viz., , and that must be tuned to fit the empirical cumulative number of citations of paper .
We find that the SIR epidemic model exhibits a fitting and prediction performances practically indistinguishable from those of the Bass model that builds on the mechanisms that drive the adoption of a new product (viz., innovation and imitation) to explain the citation dynamics [27, 28]. This is the reason we will not consider the Bass model in this contribution.
IV Goodness of fit
Here we address the fitting performances of the models discussed in the previous section. Figure 3 illustrates the citation histories of four papers that are representative of the different classes and that have approximately the same number of citations (about ) in the 50 years period considered. In particular, panel A shows the citation history of paper [29] in class , panel B of paper [30] in class , panel C of paper [31] in class , and panel D of paper [32] in class . The symbols in this figure are the empirical citation counts and the curves are the citation counts produced by the models . Regardless of the class considered, there are no perceivable differences between the fittings produced by the WSB and SIR models and both models exhibit a somewhat wanting performance for the papers in classes and . As expected, the ARIMA model fits the data perfectly since, unlike the mechanistic models, it is not constrained by a fixed functional form.
The analysis of the results exhibited in Fig. 3 offers only a qualitative assessment of the goodness of fit of the models for particular papers. A more useful and robust quantitative measure is the weighted KS test [10] given by
| (5) |
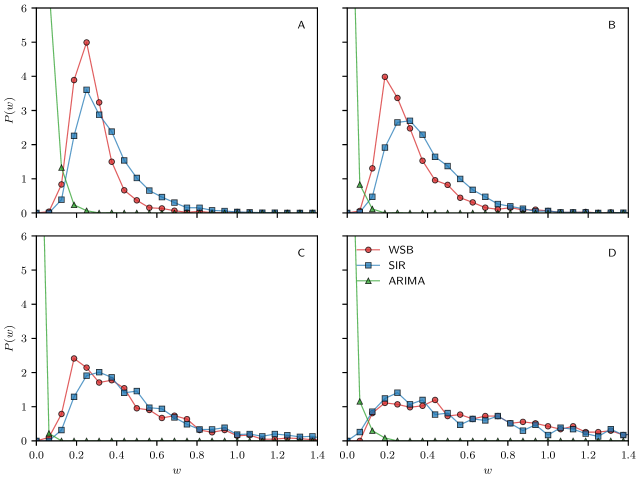
where is the upper limit of the fitting range, which in our case is years. Essentially, picks the largest deviation between the theoretical and empirical counts for paper in the entire fitting range, so it is a worst-case measure. Since for each paper we have a value of we can consider the distribution of probability for papers in the different classes, which is shown in Fig. 4. A good fitting performance is signaled by a high peak of at very low values of , as exhibited by the ARIMA model. The quality of the fitting decreases as the right-tail of the distribution increases. The weighted KS measure allows us to realize that the WSB model marginally outperforms the SIR model for all classes except for class for which both models exhibit a similar very poor performance. Hence, our findings show that the mechanistic models considered fail to explain the long-term citation histories of highly-cited papers, which prompts the problem of how to modify the WSB model in order to fit the citation history of papers in class . We will not address this attractive issue in this contribution, however.
Of course, fitting citation counts makes sense only for the mechanistic models since the interpretation of the model parameters can yield valuable information about the characteristics of the targeted papers such as their perceived novelty and importance [10, 13]. In contrast, we learn nothing by fitting citation histories with the ARIMA model since its parameters are not interpretable in terms of the citation dynamics. Nevertheless, we choose to consider the ARIMA model in this section because it illustrates nicely the distribution for models that fit the data very well. The practical use of the ARIMA model is the prediction of citation counts that we address in the next section.
V Predicting citation counts
Behind the study of mechanistic models of citation dynamics is, of course, the issue of whether the citation counts of a particular paper can be predicted or not, which is the topic of this section. In addition to the three models used in the previous section to fit the citation histories of papers, in this section we consider the naive expectation of citation counts, which assumes that papers do not receive new citations after the training period. The naive expectation plays the role of a null model to assess the quality of the predictions of the WSB, SIR and ARIMA models [33].
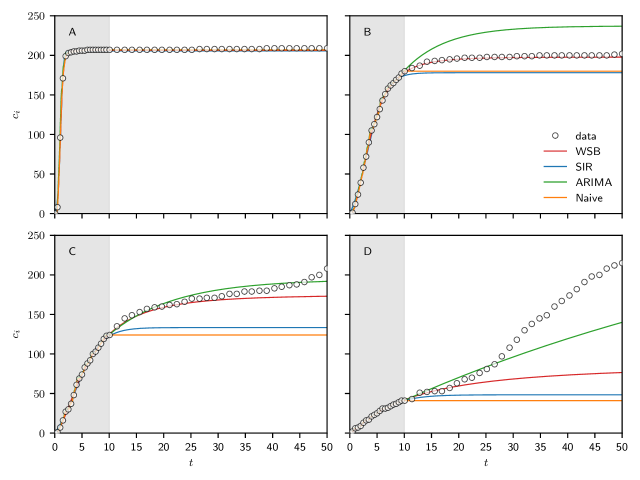
To predict the citation counts of a paper, the parameters of the models are tuned to fit the empirical citation counts in a certain training period. Here, we set the training period to years after publication. Figure 5 shows the prediction performances of the four models for the same papers exhibited in Fig. 3. We observe that all models fit the empirical citation counts very well in the training period, which is highlighted by the gray background in the figure. The models predict accurately the citation counts of the representative paper of class , but this success is obscured by the fact that the prediction of the naive expectation model is equally accurate. In fact, we will show later that the naive expectation is the best predictor for papers in class , which amounts to of the papers in our sample. The real challenge is predicting citation counts of papers in the other classes and Fig. 5 indicates that the WSB model is the most consistent predictor of all the models considered, in the sense that it predicts accurately the long-term citation counts of the representative paper of class , the middle-term citation counts of the representative paper of class and the short-term citation counts of the representative paper of class . The prediction performance of the SIR model is comparable to the performance of the null model for the four papers considered. The disastrous long-term prediction performances of all models for the representative paper of class is another evidence that the mechanistic models considered here are not suitable to describe the citation history of papers in that class.
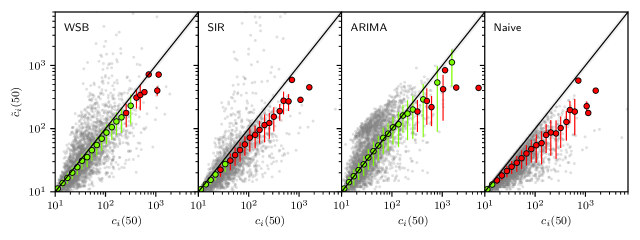
Figure 6 exhibits a qualitative method to assess the long-term predictive power of the models for all the papers in our sample. The scatter plot for each model shows the real number of citations of a paper at years after publication (i.e., ) in the x-axis and the predicted number (i.e., ) in the y-axis. We recall that the model parameters were adjusted in the time window years. Since all gray points (each point correspond to a paper) should lie on the diagonal for the perfect predictor, the distance of the points to the diagonal is a indication of the quality of the prediction. In fact, collecting the papers which have a similar number of citations in a same bin allows us to estimate the mean and the standard deviation of the predicted counts for each bin. These mean citation counts are represented by the colored symbols in the figure: if the mean is less than one standard deviation apart from the diagonal the symbol is colored green, otherwise it is colored red. The density of point above (below) the diagonal measures the tendency of the models to overestimate (underestimate) the citation counts. We note that the naive expectation model always underestimates the citation counts. The results are consistent with our findings for the representative papers of each class summarized in Fig. 3: the WSB and the ARIMA models are the best predictors and their average prediction performances are poor for highly-cited (i.e., class ) papers only.
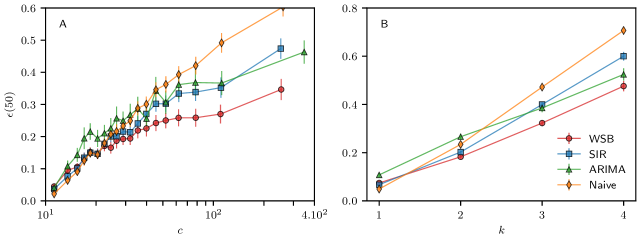
In order to extract quantitative information from the scatter plots of Fig. 6, we consider the mean absolute percentage error defined as [34]
| (6) |
where is a set of interest (e.g., the set of papers in class ) and stands for the cardinality of , as usual. The lower the value of , the better the prediction performance at time for papers in the set . Figure 7 shows the mean absolute percentage error at years after publication for the set of papers whose citation counts fall in the bin centered at (panel A) and for the set of papers in class (panel B). Of course, since the class of a paper is strongly correlated with its citation count, these two panels yield essentially the same information. For all models, the mean absolute percentage error increases with the number of citations in accordance with our qualitative analysis of Fig. 6. As already pointed out, the naive expectation model exhibits the best prediction performance for papers in class and, somewhat surprisingly, the ARIMA model exhibits the worst performance for papers in class and . The WSB model significantly outperforms the other models for classes and . However, the mean absolute percentage error of about for papers in class reinforces the sense of inadequacy of the mechanistic models to describe and predict the long-term citation counts of highly-cited papers.
Since the prediction performance of the WSB model has already been addressed in the literature [10, 34, 33], it is appropriate to highlight our original contributions to this issue, which are twofold. First, the previous studies considered the citation histories and citation predictions up to years after publication, whereas here we have extended that range to years. Although this extension makes no difference for papers in classes and , it is necessary to expose the inadequacy of the WSB model to describe papers in classes and (see Fig. 5). Second and most importantly, we have used the K-means clustering algorithm to sort the papers in classes according to the shape of their citation cumulative distributions (see Fig. 1). Somewhat surprisingly, we have found that those classes correlate strongly with the citation counts of the papers and that the prediction performance of the WSB model, as well as of the other models considered here, varies greatly depending on the class of the target paper (see Fig. 7). In particular, the WSB model does a remarkably good job at predicting the long-term citation counts of papers in classes and , which comprise of the papers in our sample, but fails unarguably for papers in class , which comprises of the papers only. We recall that papers in class , however, are very likely to be among the most cited papers in our sample.
VI Conclusion
Our results imply that use of citation based measures collected in a relatively short period (typically five years after publication) as a quantitative proxy of a paper’s importance is unfounded, even if one accepts that the number of citations correlates strongly with the (subjective) notion of the importance of a scientific contribution. This is so because papers that are highly cited in the long term (say, years after publication) do not exhibit a distinctive citation record in the first years after publication (see Fig. 2). This feature makes the prediction of the long-term citation counts of those papers using known mechanistic models of citation dynamics and algorithms for forecasting nonstationary time series basically useless (see Fig. 7). However, once we know the entire citation history of a paper we can realize that highly-cited papers exhibit a very distinctive citation pattern, which is easily singled out by the K-means clustering algorithm (see Fig. 1). Unfortunately, this sort of information has no predictive value since, as pointed out, to draw the cumulative distribution of citations we must know the complete citation counts of a paper.
Acknowledgments
We thank the American Physical Society for letting us use their citation database. The research of JFF was supported in part by Grant No. 2020/03041-3, Fundação de Amparo à Pesquisa do Estado de São Paulo (FAPESP) and by Grant No. 305058/2017-7, Conselho Nacional de Desenvolvimento Científico e Tecnológico (CNPq). SMR was supported by the Coordenação de Aperfeiçoamento de Pessoal de Nível Superior - Brasil (CAPES) - Finance Code 001.
References
- [1] J. Z. Muller, The Tyranny of Metrics (Princeton University Press, Princeton, 2018)
- [2] E. Garfield, R. K. Merton, Citation indexing: Its theory and application in science, technology, and humanities, vol. 8 (Wiley New York, 1979).
- [3] L. I. Meho, Phys. World 20, 32 (2007).
- [4] S. Fortunato, C. T. Bergstrom, K. Börner, J. A. Evans, D. Helbing, S. Milojević, A. M. Petersen, F. Radicchi, R. Sinatra, B. Uzzi, A. Vespignani, L. Waltman, D. Wang, A.-L. Barabási, Science 359 (2018).
- [5] S. E. Phelan, Emergence 3, 120 (2001).
- [6] N. Wade. Science 188, 429 (1975).
- [7] E. Garfield, Science 178, 471 (1972).
- [8] E. Garfield, Scientometrics 1, 359 (1979).
- [9] N. De Bellis, Bibliometrics and citation analysis: from the science citation index to cybermetrics (Scarecrow Press, 2009).
- [10] D. Wang, C. Song, A.-L. Barabási, Science 342, 127 (2013).
- [11] S. Seabold, J. Perktold, in 9th Python in Science Conference (2010).
- [12] APS Data Sets for Research. https://journals.aps.org/datasets. Accessed 27 April 2021.
- [13] S. M. Reia, J. F. Fontanari, Eur. Phys. J. Plus 136, 207 (2021).
- [14] D. Steinley, Brit. J. Math. Stat. Psy. 59, 1 (2006).
- [15] E. Garfield, JAMA 295, 90 (2006).
- [16] C. Chatfield, Time-series forecasting (CRC Press, 2000).
- [17] R. J. Hyndman, G. Athanasopoulos, Forecasting: principles and practice (OTexts, 2018).
- [18] D. J. S. Price, Science since Babylon (Yale University Press, New Haven, 1975) .
- [19] R. Merton, The Sociology of Science (University of Chicago Press, Chicago, 1973).
- [20] S. Redner, Phys. Today 58, 49 (2005).
- [21] J. G. Foster, A. Rzhetsky, and J. A. Evans, Am. Sociol. Rev. 80, 875 (2015).
- [22] J. Li, Y. Yin, S. Fortunato and D. Wang, Nat. Rev. Phys. 1, 301 (2019).
- [23] Y.-H. Eom and S. Fortunato, PLoS ONE 6, e24926 (2011).
- [24] Y. Dong, R. A. Johnson, and N. V. Chawla, IEEE Trans. Big Data 2, 18 (2016).
- [25] L. M. Bettencourt, A. Cintrón-Arias, D. I. Kaiser, C. Castillo-Chávez, Physica A 364, 513 (2006).
- [26] W. O. Kermack, A. G. McKendrick, Proc. R. Soc. A 115, 700 (1927).
- [27] J. Mingers, J. Oper. Res. Soc. 59, 1013 (2008).
- [28] C. Min, Y. Ding, J. Li, Y. Bu, L. Pei, and J. Sun, J. Assoc. Inf. Sci. Technol. 69, 1271 (2018).
- [29] A. H. Rosenfeld, A. Barbaro-Galtieri, W. J. Podolsky, L. R. Price, P. Soding, C. G. Wohl, M. Roos, W. J. Willis, Rev. Mod. Phys. 39, 1 (1967).
- [30] W. Galbraith, E. W. Jenkins, T. F. Kycia, B. A. Leontic, R. H. Phillips, A. L. Read, R. Rubinstein, Phys. Rev. 138, B913 (1965).
- [31] C. M. Perey, F. Perey, Phys. Rev. 132, 755 (1963).
- [32] R. P. Madden, K. Codling, Phys. Rev. Lett. 10, 516 (1963).
- [33] J. Wang, Y. Mei, D. Hicks, Science 345, 149 (2014).
- [34] H. Shen, D. Wang, C. Song, A.L. Barabási, in Proceedings of the AAAI Conference on Artificial Intelligence, vol. 28 (2014).