Generating Interesting Song-to-Song Segues With Dave
Abstract.
We introduce a novel domain-independent algorithm for generating interesting item-to-item textual connections, or segues. Pivotal to our contribution is the introduction of a scoring function for segues, based on their ‘interestingness’. We provide an implementation of our algorithm in the music domain. We refer to our implementation as Dave. Dave is able to generate 1553 different types of segues, that can be broadly categorized as either informative or funny. We evaluate Dave by comparing it against a curated source of song-to-song segues, called The Chain. In the case of informative segues, we find that Dave can produce segues of the same quality, if not better, than those to be found in The Chain. And, we report positive correlation between the values produced by our scoring function and human perceptions of segue quality. The results highlight the validity of our method, and open future directions in the application of segues to recommender systems research.
1. Introduction
Often a recommender system makes use of relationships between items. Knowledge of these relationships and can be used in the recommendation task itself and can enable the explanation of the recommendations. However, there remains much room for research into the discovery of these relationships and how to measure their strength. In (Behrooz et al., 2019), Behrooz et al. propose the concept of “segues”. Segues are short texts that explicitly connect one item to another. In (Behrooz et al., 2019), segues are used as a mean of enhancing the user experience with voice assistants in music streaming services. The authors provide a simple prototype which is able to generate song-to-song segues, and they evaluate the prototype qualitatively, with the goal only of exploring the potential of the idea.
In this paper we elaborate on the concept of segue, and we provide a domain-independent algorithm for generating interesting item-to-item textual connections. A distinguishing feature of our work is its ability to highlight interesting segues, according to a novel theory of interestingness.
Our algorithm assumes a knowledge graph as an abstract representation for items and information about items. In our abstraction, segues are paths from one item to another, and is a scoring function for paths. We ‘get back’ from the abstraction by mapping paths to texts.
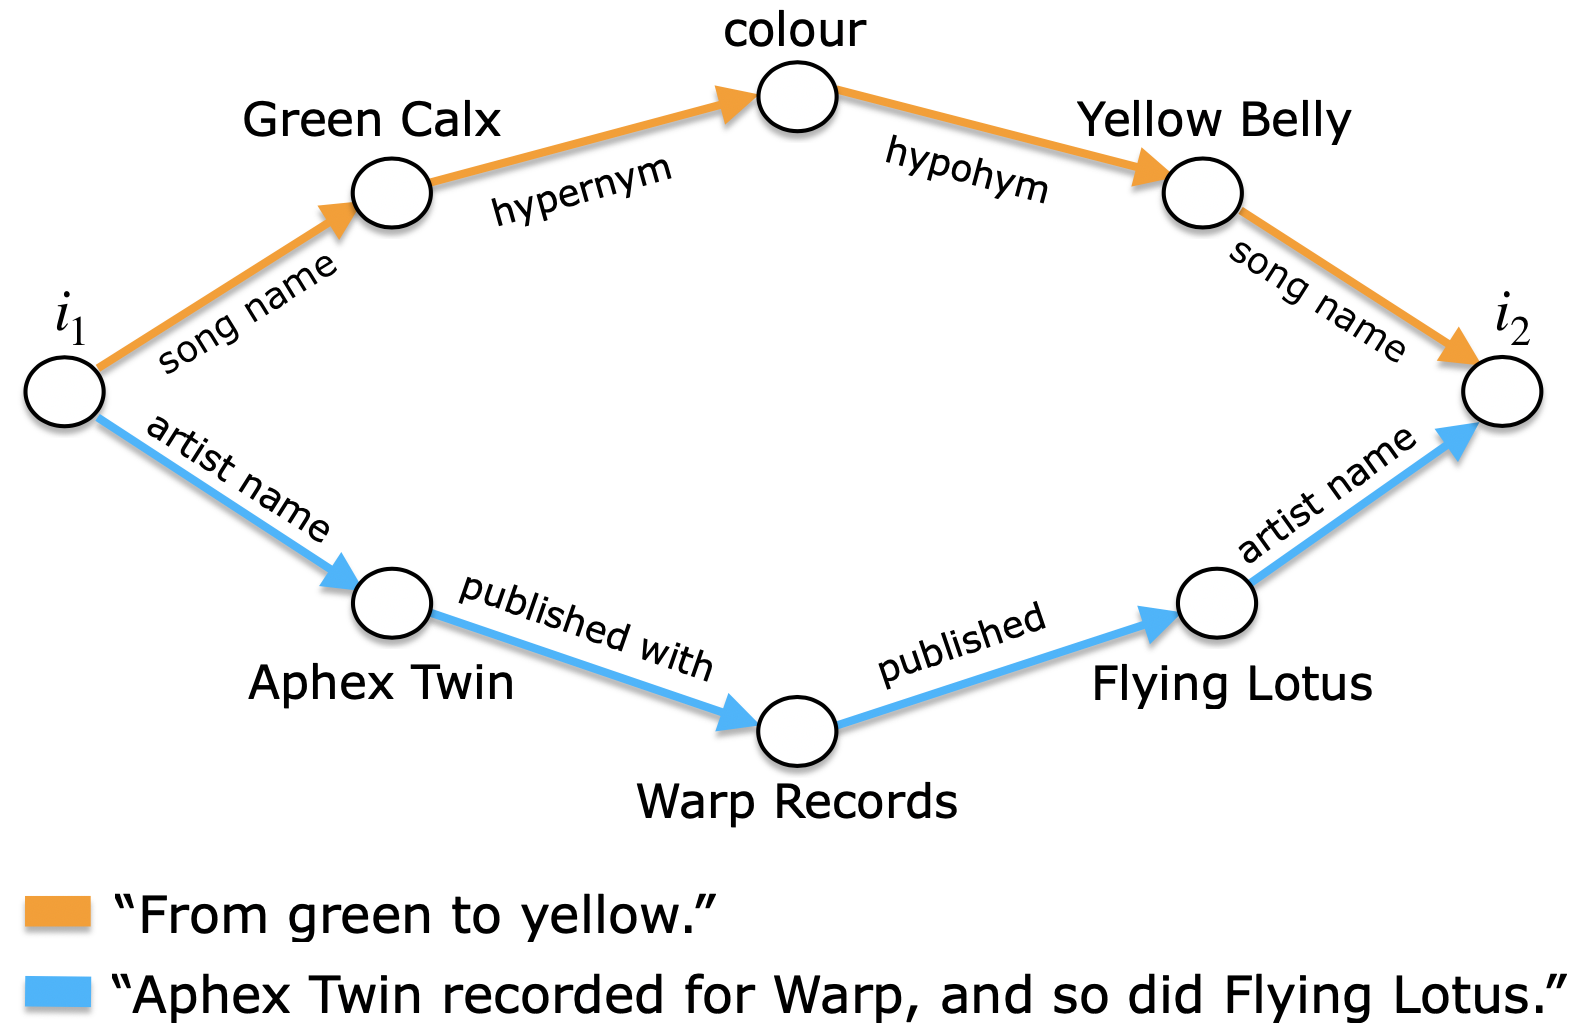
We implement the algorithm in the music domain. We refer to our implementation as Dave. Dave can generate song-to-song segues of 1553 different types. Segue types range from factual to word-play. See Figure 1 for examples.
We evaluate Dave qualitatively by means of a user trial, where we compare Dave’s segues against curated segues from a segment of the Radcliff & Maconie Show on BBC Radio 6 called The Chain. In the case of factual segues, we find that Dave can produce segues of the same quality, if not better, than those to be found in The Chain. The results highlight the validity of our method, and open future directions in the applications of segues to recommender systems research. We release the source code and the dataset, consisting of the answers gathered during the user trial, to facilitate future research on the subject.111https://github.com/GiovanniGabbolini/dave
The remainder of this paper is organised as follows: Section 2 frames segues in the literature on recommender systems and user interfaces for music retrieval, and provides an overview of interestingness measures in data mining. Section 3 explains how Dave works. Section 4 details the experimental procedure and analyses the results. Section 5 discusses conclusions and future work.
2. Related Work
2.1. Explanations and recommender systems
Explanations of recommendations is an active research topic that has helped to increase the value of recommender systems, guided by goals that go beyond recommendation accuracy (Tintarev and Masthoff, 2011). We refer the reader to the paper by Nunes and Jannach (Nunes and Jannach, 2017) for a comprehensive survey on the subject. Vig et al. (Vig et al., 2009) divide explanations into three categories: feature-based (“We have recommended this item because of your interest in this feature”), item-based (“We have recommended this item because you like this other item”) and user-based (“People who liked this item also liked this other item”). Segues are strongly related to both item-based and feature-based explanations. In fact, segues make item-to-item connections explicit by leveraging item features. They are therefore related to the item- and feature-based hybrid explanations described in (Papadimitriou et al., 2012).
There is a growing body of research that uses knowledge graphs for computing recommendations (Musto et al., 2019a; Musto et al., 2018, 2017; Bellini et al., 2017; Ostuni et al., 2014; Di Noia et al., 2012; Di Noia et al., 2016) and some research that then uses the knowledge graph for explanations of those recommendations (Passant, 2010; Musto et al., 2019b, 2016; Bellini et al., 2018; Zhao et al., 2020; Koettgen and Seeger, 2020). For example, in (Musto et al., 2019b, 2016) the authors explain recommendations by jointly representing the following in a knowledge graph: items liked by a user; items recommended to the user; and features mined from DBPedia. The candidate explanations are paths from the user profile to the recommended items, which are ranked and translated into natural language. Bellini et al. (Bellini et al., 2018) propose an autoencoder neural network for explainable recommendation. The hidden layer, and its connections to the input and output, are replaced by a knowledge graph. The graph is mined from DBPedia, and contains item features. In parallel with recommendations, the model also delivers explanations by leveraging the weights learned for the graph edges.
In some recommenders, the items to be recommended are inferred from paths, and the same paths are also used for explanations. Passant (Passant, 2010), for example, proposes a heuristic for scoring paths by relevance, and recommends items associated with the most relevant paths. In (Zhao et al., 2020; Koettgen and Seeger, 2020), paths are scored through the use of deep neural networks that learn from past user interactions. We consider our work to be closely related to path-based recommenders: we introduce a scoring function for paths that can be used for recommendation and explanation purposes. Our scoring function is novel because it strives to maximize the quality of segues.
2.2. User interfaces for music retrieval
The study of intelligent user interfaces for music retrieval has been an active research topic for twenty years now (Knees et al., 2020). The main goal of early interfaces was to facilitate the browsing of personal music collections, for example, by representing songs in 2D or 3D maps. Gulik and Vignoli (Gulik and Vignoli, 2005) visualize artists as dots in a 2D map where proximity is determined by similarity across attributes such as genre, tempo and year; Tzanetakis et al. (Tzanetakis, 2001) visualize songs as dots in a 3D map, arranged by running PCA on song features, and where the genre of a song determines the colour of its dot. Another approach consists in representing collections linearly. Pohle et al. (Pohle et al., 2007), for example, arrange songs circularly by solving a Travelling Salesman Problem, where the distances are determined by song-to-song similarity.
Recently, with the advent of streaming services, the quantity of music available to listeners shifted from relatively small personal collections to, virtually, all music content. Modern interfaces are, for the most part, not built to handle the visualization of these very large collections, but to automatically search for personalized sets of songs, and to show just these to the user (Knees et al., 2020). In Pampalk et al. (Pampalk and Goto, 2007), for example, new artists are recommended based on a seed artist picked by the user. The recommendation algorithm is based on artist-to-artist similarity. The seed song is visualized as a sun, and the recommendations as sun rays, labelled by keywords.
The idea of segues is complementary to the work on user interfaces for music retrieval as proposed in the literature. These interfaces use similarity to facilitate browsing, search and recommendation (Knees and Schedl, 2016). Segues, on the other hand, make the connections explicit. Segues were first introduced in (Behrooz et al., 2019). There, the authors developed a simple prototype able to generate segues for consecutive songs in playlists. They score individual segues simply with static segue preference weights but they also take into account, for example, the position of the segue in the playlist and its proximity to segues of the same type, in order to obtain a degree of segue diversity. Their experimental procedure consisted of unstructured interviews, aimed at exploring the potential of the idea. Our contribution fills a number of gaps in this previous work. We develop interestingness, a scoring mechanism for individual segues. And, we evaluate our system with a larger user trial, comparing it with a curated baseline.
2.3. Interestingness measures for data mining
Data mining is the discovery of patterns in large and complex datasets (Hand and Adams, 2015). Measuring the interestingness of discovered patterns is an active and important field of study, surveyed by Geng and Hamilton (Geng and Hamilton, 2006). Most research in this direction has focused on the interestingness of certain kinds of patterns, such as association rules, classification rules and summaries. Geng and Hamilton highlight that interestingness is usually defined as a combination of different components, such as: conciseness (rewarding patterns that contain a relatively small number of elements); peculiarity or infrequency (rewarding patterns if they are far away from other discovered patterns, according to some distance measure); surprisingness (rewarding patterns that contradict a person’s existing knowledge or expectations); and actionability in some domain (rewarding patterns if they enable decision-making about future actions in this domain).
There is a smaller amount of research on the interestingness of paths in graphs. Lin and Chalupsky (Lin and Chalupsky, 2003), for example, propose that the interestingness of a path of a given type is determined by the infrequency of that type of path in the graph. Ramakrishnan et al. (Ramakrishnan et al., 2005) leverage three heuristics for interestingness. The first implements the idea that more specific nodes and edges convey more information than general ones, e.g. “singer” is more specific than “person”. They compute specificity from hierarchies of node and edge types. Their second heuristic favours paths that cross different domains, e.g. from music to cinema. For this, a manual labelling, assigning domains to the nodes in the graph, is required. The third takes into account the infrequency of the path type. Aleman-Meza et al. (Aleman-Meza et al., 2003) also introduce three heuristics for interestingness. The first implements the idea of conciseness, and is computed from path length. The second is a heuristic for user-personalized paths. It leverages personalized weights assigned to regions of the graph. The third is concerned with trust in data sources. Again in this case, trust weights are manually assigned to regions of the graph.
3. Method
Our goal is to generate interesting item-to-item textual connections, or “segues”. That is, we aim for interestingness, and we discourage trivial and boring segues. We are interested in generating factual connections, but also in amusing ones, based on simple word-play.
3.1. Algorithm
Our algorithm uses a knowledge graph as an abstract representation for items and information about those items. In our abstraction, segues are paths from an item to another item, and interestingness is a scoring function from paths to numbers. We ‘get back’ from the abstraction through another function, which maps paths to texts. In particular, the algorithm for finding a segue from an item to another item works as follows: we find the paths in that connect to , we score them based on their interestingness, keeping only the best one, which is translated to text, and finally returned. This approach allows us to exploit heterogeneous data (Fensel et al., 2020), and is domain-independent. The algorithm is summarized as Algorithm 1.
In the following, we will provide details for Algorithm 1. We start by presenting some preliminary concepts:
- A knowledge graph:
-
is a set of triples , where and denote, respectively, the sets of entities and relationships. A special subset of entities , are the items (in our case, songs). Every entity has a type and a value. For example, an entity that represents a song has type equal to “song” and a value equal to the song URI. Every relationship has a type.
- A path:
-
in is an ordered list of entities and relationships in , where each triple in must be in . The type of is the ordered concatenation of the entity and relationship types in .
We turn to the components of Algorithm 1, namely , and . is a path-finding procedure that returns all the simple paths, i.e. those without cycles, starting from the item and reaching the item in . However, we allow for the possibility of constraining the paths that can find; see Section 3.2.2. works by template filling, with canned templates indexed by the path type, and completed with information on the entities and relationships that constitute it. Our focus for this work was mainly on and so we devote the remainder of this section to explaining our definition.
Defining a scoring function for segues based on interestingness is not a trivial task. To be concrete, we refer to Figure 1: which one of the two segues is more interesting? There is no correct answer to this question, as interestingness can depend upon personal relatedness (Schank, 1979) and background knowledge (Kintsch, 1980). In this context, we develop a simple theory of interestingness according to which a ranking can be determined. Our theory builds upon the concepts of infrequency and conciseness. We believe that infrequent segues are more interesting, as pointed out by Schank (Schank, 1979) and Kintsch (Kintsch, 1980) when discussing interestingess of general statements. We also believe that concise segues are more interesting, as supported by Geng et al. (Geng and Hamilton, 2006) in the context of interestingness in data mining. Our definition of interestingness applies to paths in knowledge graphs and consists of three heuristics. The heuristics rely only on statistical information and simple content descriptors, that can be defined independently of the domain, as they do not depend on the semantics of segues.
- Rarity:
-
We define the rarity of a path using the proportion of paths in that have the same type as . To formalize this, let be the set of all path types in ; and let be the number of paths in that are of type . Then,
- Unpopularity:
-
We define the unpopularity of a path using the notion of centrality of an entity . An entity is central if it has a high number of incoming and outgoing edges, compared with other entities of the same type. A path that visits central entities is more popular than one that does not. To formalize this, let be the set of incoming and outgoing edges to and from an entity in . We define the centrality of an entity as:
Then, we define the of a path as:
- Shortness:
The heuristics and both implement the idea of favouring infrequent segues, but in a different fashion: has high values for infrequent path types, while has high values for paths that include infrequent entities. For example, a path that connects people who share a birthday is likely to have a fairly high value for , but not necessarily for , e.g. if both people are very famous. Or, paths that connect people who have the same hair colour will have a low value for , but can have a high value for , e.g. if the shared hair colour is something unusual such as “green”. The heuristic implements the concept of conciseness.
We define the of a path in as the convex combination of the three heuristics:
It ranges from zero to one. are parameters to be tuned, subject to
3.2. Implementation
We implement Algorithm 1 as described in Section 3.1 for the music domain. We consider items to be songs, and obtain song-to-song segues as a result. We will refer to our implementation from now on as Dave.
3.2.1. Knowledge graph
We represent a song with three fields: song name, artist name and album name. The representation allows missing values, e.g. a song that is not part of an album, and can be easily changed with only minor modifications to the rest of our implementation, e.g. if songs were instead represented by their Spotify URIs.
Our implementation uses a knowledge graph with 40 distinct node types and 230 distinct edge types, and can provide segues of 1153 different path types. We build the knowledge graph with data that we harvest from three main resources:
- MusicBrainz:
-
We use MusicBrainz222https://musicbrainz.org/ as the main source of factual data. We exploit the MusicBrainz APIs.333https://python-musicbrainzngs.readthedocs.io/en/v0.7.1/ They allow us to navigate the MusicBrainz database, and offer entity-linking functionalities. In a first step, we link the actual song, its album and its artist to their respective MusicBrainz URIs. Then, we mine different sorts of factual data, ranging from the genres of the song to the birth places of the artists.
- Wikidata:
-
We use Wikidata444https://wikidata.org/ as an additional source of factual data. There exists a mapping from MusicBrainz URIs to Wikidata URIs, making it easy to use both resources. From Wikidata, we mine biographical data about artists that is not available in MusicBrainz, e.g. the awards that an artist has won.
- WordNet:
-
We use WordNet (Fellbaum, 2000) to mine lexical data about the words in song, artist and album names, e.g. hypernyms and hyponyms.
In addition, we gather some further lexical data through a number of different resources. For example, we link words in song, artist and album names to their stems using the Porter stemmer (Porter, 1980), and to their phonetics with the NRL algorithm (Elovitz et al., 1976). We provide a complete description of entities and relationships that build up the knowledge graph in the additional materials.555https://doi.org/10.5281/zenodo.4619395
The factual data that we obtain from MusicBrainz and Wikidata allows for conventional, informative segues. On the other hand, the lexical data from WordNet and other resources yields less conventional and perhaps amusing connections based on word-play. We show two examples in Figure 1.
3.2.2. Algorithm
As mentioned in Section 3.1, we constrain the component of Algorithm 1; specifically, we constrain it to find only paths that go from a start song to another song without visiting another song. This constraint limits the number of paths to be scored, at the price of losing some indirect paths. We believe that some of these indirect paths would be filtered out by anyway, since they would have low values for . We set the weights to be used in the score to . The weights were set after empirical experimentation, using songs that were not used in the user trial. We discuss other ways to set the weights in Section 5.
4. Experiments
We evaluate Dave by means of a user trial, where we compare Dave’s segues against a curated source of segues called The Chain. The Chain is a segment of the Radcliffe & Maconie Show on BBC Radio 6. In this segment of the show, listeners call in and propose the next song, always making sure that there is a connection (sometimes informative, sometimes funny) between the previous song and the next one. The Chain is made for entertainment and therefore offers very interesting segues, with strong creative traits. A database with all the segues that have appeared in The Chain is available on the internet.666https://www.thechain.uk At the time of writing, it comprises more than segues. A direct comparison with curated segues is our means of assessing the quality of segues from Dave. We do not include any other algorithmic baseline, as we are not aware of any other similar systems in the literature. The only work that deals with segues is (Behrooz et al., 2019). We cannot compare with their work their scoring mechanism is presented in insufficient detail to be reproducible.
Our user trial is a within-subject trial with two treatments: Dave and The Chain. We generate segues to show in each treatment using the following procedure. One segue is sampled at random from a fixed random sub-sample of The Chain, of cardinality equal to 200 segues. The corresponding segue is generated by Dave by picking the segue that maximizes the , when starting from the same song as The Chain, and going towards a song from a fixed sample of songs, of cardinality equal to 496 songs. These 496 songs are a random sub-sample of 20000 songs from the RecSys Challenge 2018 Dataset (Chen et al., 2018). We use MusicBrainz as a source of artist data to filter out artists based on the country in which they were born or in which they are based, and on the musical genres with which they are associated. Specifically, we keep only artists born or based in the UK, and who are associated with at least one genre from the following: blues, blues-rock, pop, pop-rock, rock, soft-rock, funk, jazz, r&b and soul. This country and these genres are ones that predominate in The Chain. This filtering ensure that the songs that Dave can choose from match the style of songs found in The Chain, thus mitigating one confounder from the user trial.
Each participant is asked to evaluate six segues: she undergoes both treatments three times. The order of treatments in each pair is randomized. We make sure that the same segues are not shown multiple times to a participant.
In the following, we provide details on the user trial design, we present statistics on the answers, and, finally, we analyze the results in depth.
4.1. User trial design
The user trial begins with an instructions page. It continues with a three-part survey, whose parts we will refer to as intro, segue evaluation and outro. The trial concludes with a final page that offers an optional comments box. In the following, we describe the three parts of the survey. We provide screenshots of the user trial text and its workflow in the additional materials.777https://doi.org/10.5281/zenodo.4619395
4.1.1. Intro
In the intro, we ask each participant some questions to identify how much she engages with music. A previous study has highlighted that segues might be especially suited for music ‘nerds’ (Behrooz et al., 2019). By asking these questions in our trial, we can see whether music engagement correlates with segue appreciation, for example. The source of the questions that we ask is the Goldsmiths Musical Sophistication Index (Gold-MSI) (Müllensiefen et al., 2014). The index comprises five aspects. Four of the aspects are concerned with music skills, such as musical training and singing abilities. We restrict ourselves to the remaining aspect, the one called Active Engagement (AE). AE covers “a range of active musical engagement behaviours (e.g. I often read or search the internet for things related to music) as well as the deliberate allocation of time and money on musical activities (e.g. I listen attentively to music for hours per day)” (Müllensiefen et al., 2014). We follow (Müllensiefen et al., 2014), and we measure AE by asking ten questions, with answers on a seven point scale.
We are also interested in English proficiency, as we want to make sure that participants can properly understand the segues. So in the intro we also ask the participant to identify her level of proficiency from among four options: “Low”, “Mid”, “High” and “Mother Tongue”. We do not collect demographic information, as we considered it not essential for the scope of the study.
4.1.2. Segue evaluation
In the segue evaluation phase, each participant is asked to evaluate six segues, as described in Section 4. We show the segues, as well as the titles and artists of the songs that they connect. We do not provide any means for the user to listen to the songs. For every segue, we ask questions to measure a variety of quality metrics. First, we ask whether the segue is likeable, of high-quality, and whether it sparked-interest in the next song. Second, we asked how the participant perceived its content, on three dimensions: informative, funny and creative. Lastly, we wanted to make sure that the connection between the two songs is expressed in an understandable way by the segue, and that the segue is well-written. We call these three groups of dependent variables respectively: valence, content and text quality metrics. The dependent variables introduced in this part of the survey are summarized in Table 1. We measure all of them using five point Likert scales.
| name | dependent variables |
|---|---|
| valence quality metrics | likeable, high-quality, sparked-interest |
| content quality metrics | funny, informative, creative |
| text quality metrics | understandable, well-written |
4.1.3. Outro
In the outro part of the trial, we measure the familiarity of the participant with the songs and artists involved in the segues that she has evaluated. Familiarity with songs and artists might be a confounder for the quality metrics, and we want to address these effects, if any. We consider familiarity because it has been shown to be an accurate predictor of musical choice, at least as good as liking (Ward et al., 2014), and we assume there may be an extension of the results in (Ward et al., 2014) to segues. We measure familiarity with the songs and artists of both the first song and second song in each segue. Familiarity is measured with a simple two point scale: “Familiar” and “Not familiar”. We decided to ask about familiarity in the outro, after the segue evaluation, so that we avoid accentuating any confounding effects.
4.2. Answer statistics
In total, 158 people completed the trial. They are undergraduate Computer Science students recruited in a university in Ireland. The median completion time for the survey is 7 minutes, with a maximum of 68 minutes and minimum of 2 minutes. We discard answers from people who took less than 3 minutes, as we are worried about their reliability. No participant declared their English proficiency to be “low” but we further filter out participants with “mid” English proficiency, since they also might not be able to properly evaluate segues. We are left with people with “high” proficiency and those for whom English is their mother tongue (90% of the total). After the filtering, we end up with 151 people. We convert Active Engagement answers to numbers from one to seven, and segue evaluation Likert scale answers to numbers from one to five. We also analyze the comments left by the participants, 35 comments in total, but we do not discuss them in this paper for lack of space and because they do not add much to our analysis.
User categories
In some of our analysis, we partition participants based on their level of Active Engagement with music (AE). We summed the answers to the AE questions given by each participant, obtaining a distribution of total AE scores. We divided participants according to the quartiles of this distribution, giving four categories: “low-AE”, “mid-low-AE”, “mid-high-AE” and “high-AE”. We validated this partition by considering confidence intervals of segue evaluation answers: the quartiles show good internal cohesion.
Segue categories
We believe that segues can be divided into two categories: those that are intended to amuse (“funny”) and those that are intended to impart information (“informative”). We decided to create a ground truth that assigns each segue to one of the two categories. We, the two authors of this paper, separately labeled every segue manually, guided by the following criterion: a segue is funny if it is written with the goal of making the listener smile, and a segue is informative if it is written with the goal of giving information to the listener. A segue can have both goals, e.g. if it presents information in a funny way. In such borderline cases, we assigned the goal that seemed dominant. We disagreed upon the labelling in 13 out of 400 cases (Cohen’s ). We solved divergences as follows: given a segue where there was disagreement, we found a second segue whose category was not in dispute, and that both of us considered to be similar to . We then assigned to the category of . We validate the ground truth by double-checking it against the answers to the survey. In particular, participants were asked to express how much segues were informative and funny. We computed mean values of their answers, considering separately segues labelled as informative and funny in the ground truth. We carry out a t-test for assessing the significance of differences in the mean values. We found that the mean for informative is statistically significantly higher than the mean for funny for segues labelled as informative ( vs , ), and the opposite for segues labelled as funny ( vs , ). We conclude that participants in the survey agree with our manual labeling, thus providing some support for the reliability of the ground truth.
The ground truth reveals that The Chain is biased towards funny segues: roughly three out of every four of its segues are funny. Dave is approximately balanced. We show some examples of informative and funny segues in Tables 2 and 3.
| treatment | first song | segue | second song | ||||
|---|---|---|---|---|---|---|---|
| Dave | Weather To Fly by Elbow |
|
|
||||
| The Chain |
|
|
Pass It On by The Coral |
| treatment | first song | segue | second song | ||||||
|---|---|---|---|---|---|---|---|---|---|
| Dave | Fleety Foot by Black Uhuru | From foot to faces… | Faces by Ed Sheeran | ||||||
| The Chain |
|
|
|
4.3. Results
In this section, we analyze the answers to the segue evaluation part of the survey, dividing by treatments, segue category and user category. We also investigate the effect of familiarity. And, finally, we evaluate the effectiveness of and the correlation between quality metrics.
4.3.1. Performance in the quality metrics
We compute the average for each quality metric given in Table 1 within treatment (Dave and The Chain), presenting separately the results for informative segues (Table 4) and funny segues (Table 5). We conduct a t-test for assessing the significance of differences between the two treatments. We discuss these results below.
Informative segues
For informative segues (Table 4), Dave outperforms the human-curated segues of The Chain for two of the three valence quality metrics but the differences are not statistically significant. There are statistically significant differences on the content quality metrics: The Chain is perceived as more funny and creative (), while Dave is more informative (). Finally, turning to the text quality metrics, Dave’s segues turn out to be better written and more understandable than The Chain’s but again without statistical significance.
Funny segues
When it come to funny segues (Table 5), human-curated segues from The Chain outperform Dave’s segues across all the quality metrics, with statistically significant differences. We notice low values for funny in both treatments. We might expect it to be higher in the category of segues we are considering. This may be due to the medium of presentation of the segues, i.e. read on a screen. We might expect better results if, for example, segues were spoken. It may also just be that the word-play humour of these segues does not appeal to the sense-of-humour of the trial participants.
| likeable | high-quality | sparked-interest | funny | informative | creative | understandable | well-written | |
|---|---|---|---|---|---|---|---|---|
| Dave | ||||||||
| The Chain |
| likeable | high-quality | sparked-interest | funny | informative | creative | understandable | well-written | |
|---|---|---|---|---|---|---|---|---|
| Dave | ||||||||
| The Chain |
4.3.2. Correlation of quality metrics
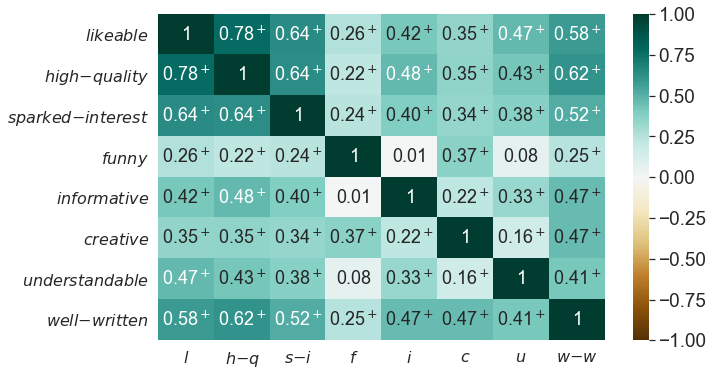
We compute pairwise correlations of the eight quality metrics and this is shown for all segues in Figure 2. There is high correlation (, ) between both high-quality and likeable with sparked-interest: good segues can spark interest in the next song. We notice that informative has higher correlation than funny with all the valence quality metrics: a segue perceived as very informative is likely to be also perceived as very likeable, high-quality, and is more likely to spark interest in the next song. This happens to a lesser extent for segues perceived as very funny. Therefore, from a recommender systems point-of-view, where sparking interest is important, it might be more fruitful to address efforts into generating informative segues, as opposed to funny segues. However, this observation might be just due to the medium of presentation of the segues i.e. read. We do not know whether the result would generalize to other mediums, e.g. spoken.
The same happens with understandable, which is statistically significantly correlated with informative but not with funny. Further, creative has good correlation with all the valence quality metrics: creativity is a good asset for segues. Finally we report high correlation of well-written with all valence quality metrics (ranging from 0.52 to 0.62, ). This is expected, since segues are consumed in textual form. How they are written is very important, as important as the content itself.
We have also looked at these correlations in various subdivisions of the data: within treatment (Dave or The Chain), within segue category (funny or informative) and within user category (low-AE, etc.). The narrative that would accompany each of these correlation matrices is not appreciably different from the one we have given above. Hence, to save space, we do not show these more specific correlation matrices in this paper.
4.3.3. Performance in quality metrics and user category
We divide users into four groups, as explained in Section 4.2, and we compute the average of the answers to the quality metric questions within each user category. We conduct a statistical test for assessing the significance of differences in performance, comparing the lowest level of AE with the other three. We show the results in Table 6. Only one metric changes statistically significantly: sparked-interest. This is reasonable: higher active engagement with music is somehow correlated with a propensity for music discovery. The other main quality metrics slightly increase with AE, but the differences are not statistically significant. The results we obtain if we further divide, e.g. by treatment or by segue category, confirm those that we have presented in Table 6. The results contradict the intuition that segues are especially suited to ”nerds” (Behrooz et al., 2019). The result might change if segues were to include more musicological detail, for example, the synthesizer brand used by two artists during a recording. At present, Dave’s knowledge graph does not contains these kinds of details and so does not allow Dave to produce segues such as these.
| likeable | high-quality | sparked-interest | funny | informative | creative | understandable | well-written | |
|---|---|---|---|---|---|---|---|---|
| low-AE | ||||||||
| mid-low-AE | ||||||||
| mid-high-AE | ||||||||
| high-AE |
4.3.4. Performance in quality metrics and familiarity
We consider whether quality metrics are related or not to familiarity with the artists and songs involved in the segues. For lack of space, we focus our attention on familiarity with songs, stating only briefly the results we have for artists. We divide answers into four groups, based on whether participants are familiar or not with each of the two songs connected by the segue, and we compute the averages of each group. We conduct a statistical test for assessing the significance of differences in performance, comparing the first group (familiar with neither song) with the other three. We do not further partition by treatment, segue category or user category, as the cardinality of some of the groups is already small. We show the results in Table 7.
We observe that familiarity with songs, in general, leads to higher appreciation of segues. Segues are more likeable when connecting two familiar songs than when connecting two unfamiliar songs (). And, segues are able to spark interest more when the songs are already familiar, with respect to when they are not (). Moreover, they are perceived as better written (), and more understandable ().
When repeating the analysis but considering familiarity with the artists, we observe the same phenomena, but the increases in the metrics have lower magnitudes. We conclude that familiarity with artists is a weaker confounder than familiarity with songs.
| likeable | high-quality | sparked-interest | funny | informative | creative | understandable | well-written | |
|---|---|---|---|---|---|---|---|---|
| familiar with | ||||||||
| neither song | ||||||||
| just song | ||||||||
| just song | ||||||||
| both songs |
4.3.5. Interestingness and quality metrics
The function is our computational means for assessing whether a segue foud by Dave is good or not. We would like to verify whether it agrees with the human perception of quality or not. To this end, we compute the correlation of the valence quality metrics and for all of Dave’s segues that were used in the user trial.
We find that there is a statistically significant correlation between the valence quality metrics and for informative segues. This indicates that the function, without being aware of semantics, relying only on statistical information and simple content descriptors, can successfully rate the quality of informative segues: on average, segues rated low by the trial participants are low also in , and vice versa. We believe that this is a very good result, given the complexity of the task. We observe worse results with funny segues, where we do not find any statistically significant correlations: deeper considerations might be needed, e.g. the role of semantics. We also compute the correlation with content quality metrics, but we do not find any strong statistically significant correlations. This is expected, since is independent from the semantics of the segues.
Finally, we turn to the correlation with text quality metrics. We do not find any correlation between and well-written. This is as expected, since well-written does not depend directly on , but on . But, we do find statistically significant correlation in informative segues for understandable (0.22, ). This is an indication that , even though it is built around the concept of infrequency, does not favour obscure segues.
We report all the results in Table 8.
| interestingness | ||
|---|---|---|
| informative segues | funny segues | |
| likeable | ||
| high-quality | ||
| sparked-interest | ||
| funny | ||
| informative | ||
| creative | ||
| understandable | ||
| well-written | ||
5. Conclusions and Future Work
In this paper we introduced a novel method for generating item-to-item segues and implemented it in the case of song-to-song segues in a system called Dave. Dave can provide a wide variety of segues, that can be categorized as either funny or informative. The core of our method is , a domain-independent function for scoring the interestingness of paths in knowledge graphs.
We evaluate Dave by means of a user trial, where we compare it against curated segues from a segment of the Radcliffe & Maconie Show on BBC Radio 6 program, called The Chain. The use of The Chain may be a limitation of this work. Segues from The Chain have a peculiar style that fits the radio program, and are tailored to a particular kind of audience. They tend to be amusing and very creative. Dave, on the other hand, tends to be factual, and can only deliver funny segues made of word-play. In order to alleviate such problems, we compared funny segues and informative segues from the two methods separately. Notice too that, even though The Chain has a high percentage of funny segues, this does not mean that its informative segues are weak: The Chain is curated by experts and draw on the considerable knowledge of thousands of BBC listeners. In any case, the user trial was intended as a method to assess how Dave’s segues compare with curated segues from a trustworthy source — segues that we can assume to be “really good”. This gives a way of finding how far Dave is from being “really good”. Our goal is not to demonstrate that our algorithm can be substituted for the listeners to the show, instead, we aim to provide an evaluation in a scenario where no algorithmic baseline is available.
We find that Dave can produce informative segues of the same quality, if not better, than The Chain. We believe that this is an astonishing result, that gives an idea of the quality of our method. But, when turning to funny segues, the results are not as good. We believe that this is partially due to the interestingness function, as we find evidence that it is much better suited to rate the quality of informative segues. Another reason might be that funny segues from Dave are limited to word-play, and this kind of humour does not appeal to everyone and may, in particular, not appeal to the participants in our user trial. In fact, even curated funny segues from The Chain are not perceived as funny by participants in our trial. This may be a mismatch in sense of humour between listeners to the show and participants in the trial. It may also be due, in part, to the fact that segues are being read rather than being spoken. It is fair to say that, overall, the task of tackling the funny segues is only partly solved by the proposed model.
We find that good segues can spark interest in songs, and that this effect increases the more the user has high active engagement with music. Future directions might include the construction of a recommender system that incorporates segues to guide the discovery of new music, especially helping to solve the open problem of acceptance of recommendations for songs that deviate from user expectations (so-called divergent song recommendations (Mehrotra et al., 2020)). We also notice that segues are particularly appreciated when they deal with music the user is already familiar with. Future work might therefore also concern the application of segues to enhance recommendations for repeated consumption, a popular topic in the music domain (Tsukuda and Goto, 2020).
We are also interested in exploring the idea of learning the weights used by the scoring function, and in particular learning personalized weights that would adjust to fit the tastes of the user.
Other future directions involve the use of multiple segues to provide a narrative to accompany a playlist.
Lastly, we are interested in exploiting the domain-independent nature of our contribution, and to work with other kinds of items. For example, segues might be used by point-of-interest recommenders in the tourism domain to build a story around places to visit, going towards the idea of a virtual and intelligent tour guide.
Acknowledgements.
We thank Peter Knees of TU Wien for useful discussions about the design of the user trial. This publication has emanated from research conducted with the financial support of Science Foundation Ireland under Grant number 12/RC/2289-P2 which is co-funded under the European Regional Development Fund. For the purpose of Open Access, the authors have applied a CC BY public copyright licence to any Author Accepted Manuscript version arising from this submission.References
- (1)
- Aleman-Meza et al. (2003) Boanerges Aleman-Meza, Chris Halaschek, I. Budak Arpinar, and Amit Sheth. 2003. Context-Aware semantic association ranking. Proceedings of the 1st International Conference on Semantic Web and Databases, SWDB 2003 (2003), 24–41.
- Aleman-Meza et al. (2005) Boanerges Aleman-Meza, Christian Halaschek-Wiener, I. Budak Arpinar, Cartic Ramakrishnan, and Amit P. Sheth. 2005. Ranking complex relationships on the semantic web. IEEE Internet Computing 9, 3 (2005), 37–44. https://doi.org/10.1109/MIC.2005.63
- Behrooz et al. (2019) Morteza Behrooz, Sarah Mennicken, Jennifer Thom, Rohit Kumar, and Henriette Cramer. 2019. Augmenting Music Listening Experiences on Voice Assistants. In Proceedings of the 20th International Society for Music Information Retrieval Conference, ISMIR 2019, Delft, The Netherlands, November 4-8, 2019, Arthur Flexer, Geoffroy Peeters, Julián Urbano, and Anja Volk (Eds.). 303–310. http://archives.ismir.net/ismir2019/paper/000035.pdf
- Bellini et al. (2017) Vito Bellini, Vito Walter Anelli, Tommaso Di Noia, and Eugenio Di Sciascio. 2017. Auto-Encoding User Ratings via Knowledge Graphs in Recommendation Scenarios. In Proceedings of the 2nd Workshop on Deep Learning for Recommender Systems (Como, Italy) (DLRS 2017). Association for Computing Machinery, New York, NY, USA, 60–66. https://doi.org/10.1145/3125486.3125496
- Bellini et al. (2018) Vito Bellini, Angelo Schiavone, Tommaso Di Noia, Azzurra Ragone, and Eugenio Di Sciascio. 2018. Knowledge-aware Autoencoders for Explainable Recommender Systems. ACM International Conference Proceeding Series (2018), 24–31. https://doi.org/10.1145/3270323.3270327 arXiv:1807.06300
- Chen et al. (2018) Ching-Wei Chen, Paul Lamere, Markus Schedl, and Hamed Zamani. 2018. Recsys Challenge 2018: Automatic Music Playlist Continuation. In Proceedings of the 12th ACM Conference on Recommender Systems (Vancouver, British Columbia, Canada) (RecSys ’18). Association for Computing Machinery, New York, NY, USA, 527–528. https://doi.org/10.1145/3240323.3240342
- Di Noia et al. (2012) Tommaso Di Noia, Roberto Mirizzi, Vito Claudio Ostuni, Davide Romito, and Markus Zanker. 2012. Linked Open Data to Support Content-Based Recommender Systems. In Proceedings of the 8th International Conference on Semantic Systems (Graz, Austria) (I-SEMANTICS ’12). Association for Computing Machinery, New York, NY, USA, 1–8. https://doi.org/10.1145/2362499.2362501
- Di Noia et al. (2016) Tommaso Di Noia, Vito Claudio Ostuni, Paolo Tomeo, and Eugenio Di Sciascio. 2016. SPrank: Semantic Path-Based Ranking for Top-¡i¿N¡/i¿ Recommendations Using Linked Open Data. ACM Trans. Intell. Syst. Technol. 8, 1, Article 9 (Sept. 2016), 34 pages. https://doi.org/10.1145/2899005
- Elovitz et al. (1976) H. S. Elovitz, R. W. Johnson, A. McHugh, and J. E. Shore. 1976. Automatic translation of English text to phonetics by means of letter-to-sound rules. Naval Research Lab. Report.
- Fellbaum (2000) C. Fellbaum. 2000. WordNet : an electronic lexical database. Language 76 (2000), 706.
- Fensel et al. (2020) Dieter Fensel, Umutcan Şimşek, Kevin Angele, Elwin Huaman, Elias Kärle, Oleksandra Panasiuk, Ioan Toma, Jürgen Umbrich, and Alexander Wahler. 2020. Introduction: What Is a Knowledge Graph? Springer International Publishing, Cham, 1–10. https://doi.org/10.1007/978-3-030-37439-6_1
- Geng and Hamilton (2006) Liqiang Geng and Howard J. Hamilton. 2006. Interestingness measures for data mining: A survey. Comput. Surveys 38, 3 (2006), 3. https://doi.org/10.1145/1132960.1132963
- Gulik and Vignoli (2005) Rob Gulik and Fabio Vignoli. 2005. Visual Playlist Generation on the Artist Map. In in Proc. of the ISMIR Intl. Conf. on Music Information Retrieval. 520–523.
- Hand and Adams (2015) David J. Hand and Niall M. Adams. 2015. Data Mining. American Cancer Society, 1–7. https://doi.org/10.1002/9781118445112.stat06466.pub2
- Kintsch (1980) Walter Kintsch. 1980. Learning from text, levels of comprehension, or: Why anyone would read a story anyway. Poetics 9, 1 (1980), 87 – 98. https://doi.org/10.1016/0304-422X(80)90013-3 Special Issue Story Comprehension.
- Knees and Schedl (2016) Peter Knees and Markus Schedl. 2016. Introduction to Music Similarity and Retrieval. Springer Berlin Heidelberg, Berlin, Heidelberg, 1–30. https://doi.org/10.1007/978-3-662-49722-7_1
- Knees et al. (2020) Peter Knees, Markus Schedl, and Masataka Goto. 2020. Intelligent User Interfaces for Music Discovery. Transactions of the International Society for Music Information Retrieval 3(1) (2020), 165–179.
- Koettgen and Seeger (2020) Volker B. Koettgen and Timm Seeger. 2020. Cafe: Coarse-to-Fine Neural Symbolic Reasoning for Explainable Recommendation. CIKM 2020 (2020). https://doi.org/10.1145/3340531.3412038
- Lin and Chalupsky (2003) Shou De Lin and Hans Chalupsky. 2003. Unsupervised link discovery in multi-relational data via rarity analysis. Proceedings - IEEE International Conference on Data Mining, ICDM (2003), 171–178. https://doi.org/10.1109/icdm.2003.1250917
- Mehrotra et al. (2020) Rishabh Mehrotra, Chirag Shah, and Benjamin Carterette. 2020. Investigating Listeners’ Responses to Divergent Recommendations. In Fourteenth ACM Conference on Recommender Systems (Virtual Event, Brazil) (RecSys ’20). Association for Computing Machinery, New York, NY, USA, 692–696. https://doi.org/10.1145/3383313.3418482
- Müllensiefen et al. (2014) Daniel Müllensiefen, Bruno Gingras, Jason Musil, and Lauren Stewart. 2014. The musicality of non-musicians: An index for assessing musical sophistication in the general population. PLoS ONE 9, 2 (2014). https://doi.org/10.1371/journal.pone.0089642
- Musto et al. (2017) Cataldo Musto, Pierpaolo Basile, Pasquale Lops, Marco de Gemmis, and Giovanni Semeraro. 2017. Introducing linked open data in graph-based recommender systems. Information Processing & Management 53, 2 (2017), 405 – 435. https://doi.org/10.1016/j.ipm.2016.12.003
- Musto et al. (2019a) Cataldo Musto, Pierpaolo Basile, and Giovanni Semeraro. 2019a. Embedding Knowledge Graphs for Semantics-Aware Recommendations Based on DBpedia. In Adjunct Publication of the 27th Conference on User Modeling, Adaptation and Personalization (Larnaca, Cyprus) (UMAP’19 Adjunct). Association for Computing Machinery, New York, NY, USA, 27–31. https://doi.org/10.1145/3314183.3324976
- Musto et al. (2018) Cataldo Musto, Tiziano Franza, Giovanni Semeraro, Marco de Gemmis, and Pasquale Lops. 2018. Deep Content-Based Recommender Systems Exploiting Recurrent Neural Networks and Linked Open Data. In Adjunct Publication of the 26th Conference on User Modeling, Adaptation and Personalization (Singapore, Singapore) (UMAP ’18). Association for Computing Machinery, New York, NY, USA, 239–244. https://doi.org/10.1145/3213586.3225230
- Musto et al. (2016) Cataldo Musto, Fedelucio Narducci, Pasquale Lops, Marco De Gemmis, and Giovanni Semeraro. 2016. ExpLOD: A framework for explaining recommendations based on the linked open data cloud. RecSys 2016 - Proceedings of the 10th ACM Conference on Recommender Systems (2016), 151–154. https://doi.org/10.1145/2959100.2959173
- Musto et al. (2019b) Cataldo Musto, Fedelucio Narducci, Pasquale Lops, Marco de Gemmis, and Giovanni Semeraro. 2019b. Linked open data-based explanations for transparent recommender systems. International Journal of Human Computer Studies 121 (2019), 93–107. https://doi.org/10.1016/j.ijhcs.2018.03.003
- Nunes and Jannach (2017) Ingrid Nunes and Dietmar Jannach. 2017. A systematic review and taxonomy of explanations in decision support and recommender systems. User Modeling and User-Adapted Interaction 27, 3-5 (2017), 393–444. https://doi.org/10.1007/s11257-017-9195-0 arXiv:2006.08672
- Ostuni et al. (2014) Vito Claudio Ostuni, Tommaso Di Noia, Roberto Mirizzi, and Eugenio Di Sciascio. 2014. A Linked Data Recommender System Using a Neighborhood-Based Graph Kernel. In E-Commerce and Web Technologies, Martin Hepp and Yigal Hoffner (Eds.). Springer International Publishing, Cham, 89–100.
- Pampalk and Goto (2007) E. Pampalk and M. Goto. 2007. MusicSun: A New Approach to Artist Recommendation. In in Proc. of the ISMIR Intl. Conf. on Music Information Retrieval. 205–210.
- Papadimitriou et al. (2012) Alexis Papadimitriou, Panagiotis Symeonidis, and Yannis Manolopoulos. 2012. A generalized taxonomy of explanations styles for traditional and social recommender systems. Data Mining and Knowledge Discovery 24 (05 2012), 555–583. https://doi.org/10.1007/s10618-011-0215-0
- Passant (2010) Alexandre Passant. 2010. dbrec - Music Recommendations Using DBpedia. The Semantic Web – ISWC 2010 1380 (2010), 1–16.
- Pohle et al. (2007) T. Pohle, P. Knees, M. Schedl, E. Pampalk, and G. Widmer. 2007. “Reinventing the Wheel”: A Novel Approach to Music Player Interfaces. IEEE Transactions on Multimedia 9, 3 (2007), 567–575. https://doi.org/10.1109/TMM.2006.887991
- Porter (1980) M. Porter. 1980. An algorithm for suffix stripping. Program 14 (1980), 130–137.
- Ramakrishnan et al. (2005) Cartic Ramakrishnan, William H. Milnor, Matthew Perry, and Amit P. Sheth. 2005. Discovering informative connection subgraphs in multi-relational graphs. ACM SIGKDD Explorations Newsletter 7, 2 (2005), 56–63. https://doi.org/10.1145/1117454.1117462
- Schank (1979) Roger C. Schank. 1979. Interestingness: Controlling inferences. Artificial Intelligence 12, 3 (1979), 273 – 297. https://doi.org/10.1016/0004-3702(79)90009-2
- Tintarev and Masthoff (2011) Nava Tintarev and Judith Masthoff. 2011. Designing and Evaluating Explanations for Recommender Systems. Springer US, Boston, MA, 479–510. https://doi.org/10.1007/978-0-387-85820-3_15
- Tsukuda and Goto (2020) Kosetsu Tsukuda and Masataka Goto. 2020. Explainable Recommendation for Repeat Consumption. In Fourteenth ACM Conference on Recommender Systems (Virtual Event, Brazil) (RecSys ’20). Association for Computing Machinery, New York, NY, USA, 462–467. https://doi.org/10.1145/3383313.3412230
- Tzanetakis (2001) G. Tzanetakis. 2001. Automatic Musical Genre Classification of Audio Signals. In in Proc. of the ISMIR Intl. Conf. on Music Information Retrieval. 205–210.
- Vig et al. (2009) Jesse Vig, Shilad Sen, and John Riedl. 2009. Tagsplanations: Explaining Recommendations Using Tags. In Proceedings of the 14th International Conference on Intelligent User Interfaces (Sanibel Island, Florida, USA) (IUI ’09). Association for Computing Machinery, New York, NY, USA, 47–56. https://doi.org/10.1145/1502650.1502661
- Ward et al. (2014) Morgan K. Ward, Joseph K. Goodman, and Julie R. Irwin. 2014. The same old song: The power of familiarity in music choice. Marketing Letters 25, 1 (2014), 1–11. https://doi.org/10.1007/s11002-013-9238-1
- Zhao et al. (2020) Kangzhi Zhao, Xiting Wang, Yuren Zhang, Li Zhao, Zheng Liu, Chunxiao Xing, and Xing Xie. 2020. Leveraging Demonstrations for Reinforcement Recommendation Reasoning over Knowledge Graphs. SIGIR 2020 - Proceedings of the 43rd International ACM SIGIR Conference on Research and Development in Information Retrieval (2020), 239–248. https://doi.org/10.1145/3397271.3401171