Review in “Solar Magnetic Variability and
Climate”
C. de Jager, S. Duhau, A.C.T. Nieuwenhuizen, 2020
book
contents Stip Media
order: vincent@stipmedia.nl
Small-scale solar surface magnetism
Robert J. Rutten1,2,3
1 Lingezicht Astrophysics,
Deil, The Netherlands
2 Institute of Theoretical Astrophysics,
University in Oslo, Oslo, Norway
3 Rosseland Centre for Solar Physics,
University in Oslo, Oslo, Norway
Abstract. This contribution to “Solar Magnetic
Variability and Climate” reviews small-scale magnetic features on the
solar surface, in particular the strong-field but tiny magnetic
concentrations that constitute network and plage and represent most
magnetism outside sunspots and filaments.
Where these are mostly of the same polarity, as in active-region
plage, their occurrence varies with the activity variations measured
by the sunspot number, but when they appear bipolar-mixed on small
scales they can also result from granular-scale dynamo action that
does not vary with the cycle.
Magnetic concentrations constituting network, plage, faculae.
Solar surface magnetism exhibits a major discrete component in addition to sunspots in active regions. It consists of small magnetic concentrations (henceforth MC) with kilogauss field strength, spread over the Sun in irregular patterns. They represent a low but long tail in the size hierarchy of strong-field features that emanate more or less upright (radially, locally vertically) through the surface (Zwaan 1967). For reviews see de Wijn et al. (2009) and Borrero et al. (2017).
Sunspot umbrae are the largest vertical flux concentrations. In their surrounding penumbrae the fields partly fan out to larger height and partly bend back to below the surface. Next come magnetic pores: mini-umbrae without penumbra, of granular or slightly larger size, also appearing dark on the surface. The yet smaller MCs also represent upright field bundles but with much smaller cross-section at the surface, at most a few hundred km diameter, usually less. Hence, telescopes need sub-arcsecond or better angular resolution to observe them (1 arcsec measures about 700 km on the Sun). Even then their fine structure is often not resolved. They therefore became known as magnetic “elements” or “points” (magnetic points, facular points, bright points). The “bright” is because they appear bright in many diagnostics (more below). They are not limited to active regions as spots and pores usually are. In these they do appear in denser concentrations but elsewhere they are also present, including very quiet areas. There are fewer in the polar caps, but the ones there are important gauges of polar fields.
Near the limb the small MCs are known as faculae. These were observed well before their small-bright-point signature closer to disk center was recognized because they appear brighter in slanted viewing. Faculae were already visible towards the limb in white light images that did not reach the high resolution of modern telescopes. This fortunate visibility enables using the number of polar faculae as polar field proxy, using Sheeley’s inventories of their numbers on historical Mount Wilson full-disk photographs.
In principle the best way to observe MCs is through their strong-field signature in Zeeman line splitting or broadening. However, this fails towards the limb where the radial MC fields become less aligned with the line of sight as required for circular-polarization Zeeman signature.
However, also on the disk magnetograms sampling Zeeman diagnostics generally show them incompletely. The Helioseismic and Magnetic Imager (HMI) onboard the Solar Dynamics Observatory (SDO) collects full-disk magnetograms every 45 seconds since the spring of 2010, but while these monitor the distribution of the stronger concentrations over the visible disk continuously, their angular resolution and magnetic sensitivity are low so that they detect only larger ones and do not resolve these.
The mid-ultraviolet images (1600 Å and 1700 Å) of the Atmospheric Imaging Assembly (AIA) onboard SDO chart these small magnetic concentrations more completely in the form of bright grains, but without polarity distinction as magnetograms do. The resolution is as bad as for HMI but the MC inventory is more complete through higher contrast, especially towards the solar limb.
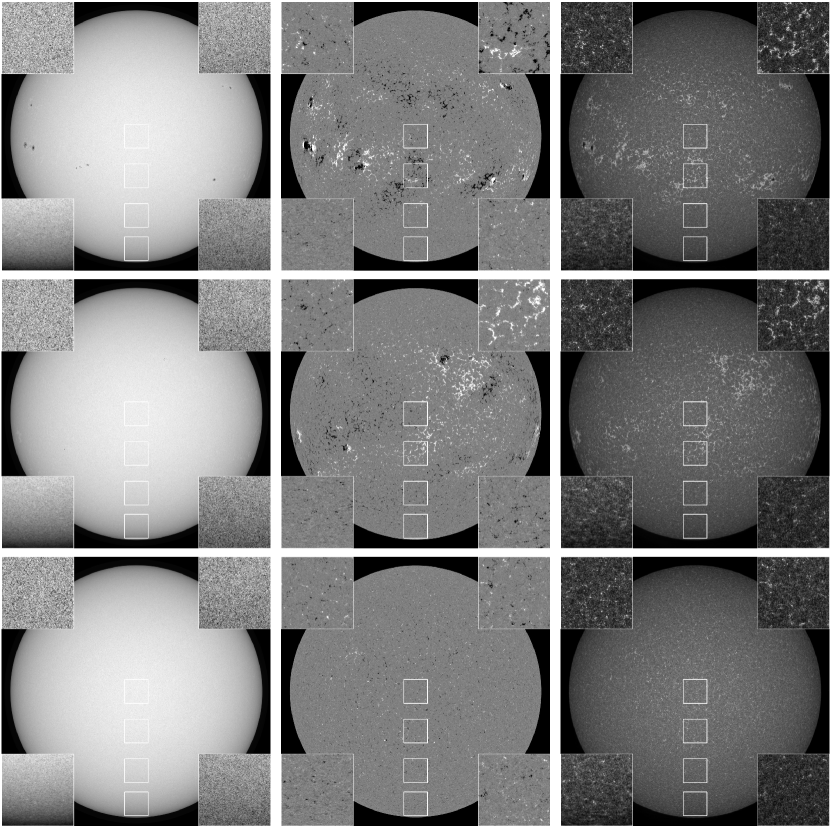
Figure 1 shows simultaneous images from HMI and AIA at high, medium, and low levels of activity. Each image contains magnified cut-outs to show detail. Only the top continuum image in the first column contains sizable spots, primarily in the southern activity belt. Elsewhere it shows granulation. The corresponding magnetogram in the second column show extended groupings of small black or white (opposite polarity) grains marking MCs. They are densest where there is most activity and there display the Hale polarity laws. The dense groups around spots constitute active-region plage, but away from spots there are also extended clusters with a preferred polarity, also called plage or “active network”. They display tilts according to Joy’s law. Similar ones appear in the second magnetogram but in the bottom magnetogram there are no extended groupings. The insets show that the plages have roughly cellular ordering constituting magnetic network. The top-right inset in the second magnetogram shows this network as mostly unipolar (white) but with a few opposite-polarity (black) “internetwork” grains in the cell interiors.
Towards the poles the magnetograms show less network patterning and more bipolar salt-and-pepper MC sprinkling, but still with some preference for small-scale polarity sharing.
The ultraviolet 1700 Å images from AIA in the third column illustrate that all magnetic elements appear as bright grains at this wavelength. The weaker 1700 Å grains between these mark acoustic waves fed by the solar surface oscillations. Comparing the various insets with the corresponding magnetogram insets shows nearly 1:1 pattern equality (apart from the polarity sign) between bright ultraviolet grains and kilogauss MCs.
Formation and brightness of small magnetic concentrations.
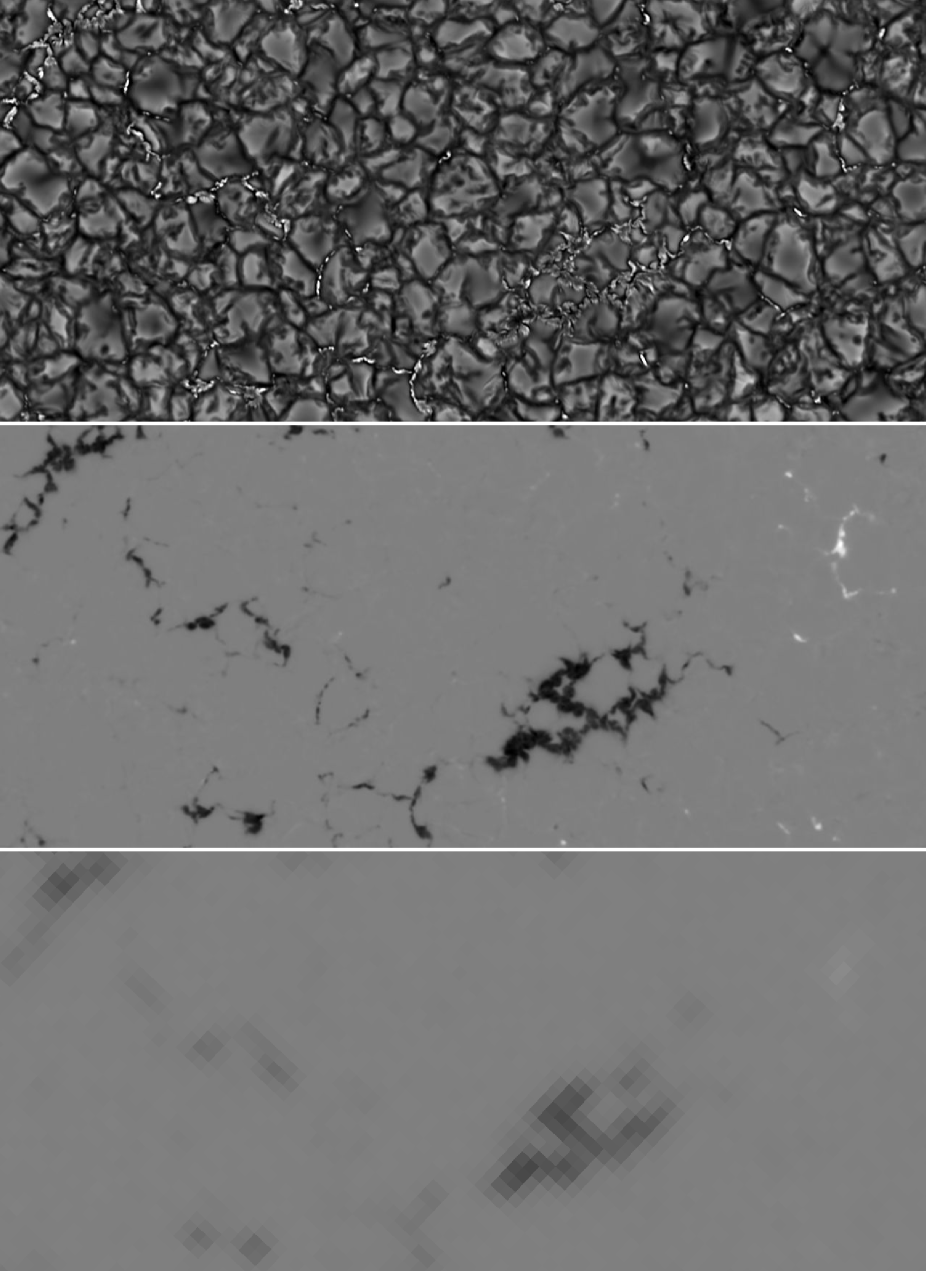
Much higher resolution than in Fig. 1 is obtained at the best ground-based telescopes, in images in which these small magnetic concentrations appear bright with respect to their surroundings. Most reside in intergranular lanes so they become invisible at low resolution because their local brightness cancels against the surrounding darkness. Figure 2 shows the state of the art with observations from the Swedish 1-m Solar Telescope (SST), currently the best ground-based solar telescope by combining an outstanding site, superb optics, vacuum technology, advanced adaptive wavefront correction, further numerical image restoration, and fast high-quality Fabry-Pérot imaging spectrometers operating at red and at violet wavelengths (Scharmer et al. 2019).
The top panel shows surface granulation. Within some intergranular lanes there are numerous small bright features, clearly not “points” but with varying shape, often elongated, that generally follow the morphology of the intergranular lane in which they reside (and follow with time in image sequences). The SST magnetic map in the second panel shows that this small scene contains mostly negative-polarity network, including a somewhat larger “enhanced network” patch with larger bright point density. There is some positive-polarity network at right. There are very few magnetic concentrations above the sensitivity threshold in the internetwork areas; also these have corresponding bright features in the top panel.
The two magnetograms are both clipped at 1500 Gauss absolute field strength. The magnetic features appear much weaker in the HMI magnetogram because they are much smaller than the pixels over which their averaged magnetic signature is measured, as demonstrated by the smallness of the bright points in the top panel. This comparison shows the poor rendering of small-scale magnetism in HMI magnetograms. Only the larger field patches remain diffusely visible. Thus, the magnetograms in Fig. 1 show tips of MC icebergs only. These were clipped at only 100 Gauss in order to display their location and polarity more completely, not their actual field strength. The SST field map comes closer to resolving them, with many pixels showing apparent field strengths above 1000 Gauss.
The nature of these small MCs and why they appear bright are well understood. Just as in umbrae the strong magnetic field suppresses turbulent convection locally, so that outward convective energy transport from below is inhibited which makes them cooler than their surroundings. The strong field also contributes high magnetic pressure. Persistent presence of such strong-field features (they often last hours) requires correspondingly low gas pressure inside so that the sum of both pressures balances the outside field-free gas pressure (“magnetostatic equilibrium”, Spruit 1976).
In contrast to sunspot umbrae and pores, the small MCs do not appear darker but brighter than their surroundings. Naturally this was initially attributed to unidentified heating, but from their magnetostatic modeling Spruit (1976) and Spruit & Zwaan (1981) suggested that the apparent brightening comes from the hot walls of the tube-like MCs below the surface. Their insides are relatively cool from the magnetic suppression of outward convective energy flow, but the hot-wall radiation scatters out to produce a bright feature if the MC is small enough, whereas this contribution becomes negligible for larger pores and umbrae. Towards the limb the viewing along the slanted line of sight passes further through the relatively empty fluxtube than besides that, and so samples the hot granule behind causing the enhanced contrast of limbward faculae with stalk-like appearance.
Subsequently, the kilogauss strength of MC fields was established with dual-line spectropolarimetry by Frazier & Stenflo (1978), verified in a number of studies (reviewed by Solanki 1993), and then followed by detailed numerical MHD simulations (e.g., Keller et al. 2004; Carlsson et al. 2004) in which magnetic concentrations appear and brighten very similar to those in the best observations, also as limb faculae in slanted viewing. These simulations insert uniform magnetic field of a few hundred Gauss, horizontal or vertical, throughout or at the bottom of a well-developed purely hydrodynamic simulation and then follow its reconfiguration and shredding by the continuing turbulent convection. Below the surface the gas pressure generally dominates over the magnetic pressure so that the fields are forced to follow the gas motions (in the low-density corona this is reversed so that gas in coronal loops is frozen-in to the field). The uniform initial field is so quickly transformed into more or less vertical threads that are expelled by the convective flows from granules to their surrounding lanes, and then swept to mesogranular boundaries.
The simulations are yet too small in volume to harbor larger supergranulation, but the observed network patterning which outlines boundaries between supergranulation flow cells implies that subsequent sweeping to and collection in supergranular boundaries follows (more below). In summary, the simulations show that any field moving from somewhere into the turbulent convection just below the surface is transformed into kilogauss concentrations that are swept along by the local granular, mesogranular and supergranular flows.
The low internal gas pressure enhances apparent MC brightness in spectral diagnostics that are density-sensitive. Atomic lines such as the optical ones from Fe I weaken or even vanish in MCs because most or all iron becomes ionized within them; in the older literature this small-scale vanishing was called “line gaps”. Molecular bands as the Fraunhofer-named G-band of CH molecules near 4310 Å and the CN band below 3884 Å weaken from enhanced dissociation. The first convincing bright-point MC observations were therefore done (at Pic du Midi) in the G band which permits imaging with relative wide (10 Å) spectral bandpass, hence high signal-to-noise. In the outer damping wings of the Balmer lines and the strong Ca II lines the opacity diminishes from smaller density-sensitive collisional broadening; this is the case in the top panel of Fig. 2 which samples wavelengths in the overlapping outer damping wings of Ca II H & K between these lines. In the mid-ultraviolet continua sampled by AIA the MCs show enhanced brightening from ionization of Fe I and Mg I which contribute most continuous opacity at these wavelengths; this brightening is evident in the third column of Fig. 1. For all these diagnostics the smaller opacity within the MCs implies deeper apparent holes for outward hot-wall radiation, hence a larger contribution of that, and also larger transparency in facular viewing along slanted lines of sight close to the limb that so penetrate further into the hotter granules behind the MCs and sample more of their brightness.
Weak internetwork fields.
The kilogauss MCs that constitute network and plage are smaller than the spots and pores in active regions, but they do not represent the smallest or weakest in the hierarchy of solar magnetic surface features. In recent years it has become clear that also within quiet-Sun supergranular cells weak “internetwork” fields are copiously present in very tangled and dynamic form on granular scales. The first telltale was measurement of Hanle depolarization (Trujillo Bueno et al. 2004), followed by detection of abundant primarily horizontal fields at granular scales in full-Stokes spectropolarimetry with the Hinode satellite (Lites et al. 2008, 2017) of which the 50-cm aperture furnishes the highest resolution and sensitivity in magnetogram sequences from space so far. The absence of fast-varying atmospheric image distortion (“seeing”) in space permits much longer integration times than for groundbased telescopes, resulting in much higher sensitivity and hence weaker field detection than possible with SST and HMI magnetometry as in Fig. 2.
Numerical MHD simulations (see Pietarila Graham et al. 2010) have established that such weak small-scale quiet-Sun fields likely result mostly from local convection near the surface operating as a small-scale dynamo, less from convective shredding of stronger kilogauss network/plage MCs or from shredding yet larger preceding active regions. These weak internetwork fields are relatively stronger and more vertical in intergranular lanes. Higher up, but still within the low photosphere, they close across granules in tiny horizontal loops. The latter loops cover more area than the lane fields so that the dominating weak-field signature in Hinode data is horizontal. This small-scale near-surface dynamo action is inherent in the turbulent convection producing the granulation and does not vary with latitude or the activity cycle.
Network and plage patterns.
Small kilogauss concentrations and weak internetwork fields are the producers of larger-scale network and plage patterns on the solar surface as seen in the magnetograms of Fig. 1. Such production was first established for the kilogauss concentrations called ephemeral regions (Harvey & Martin 1973). They are small bipolar kilogauss MC pairs that emerge from deeper layers, presumably as tiny Omega loops in the overall toroidal field system that rise buoyantly through the surface, similarly to the much larger ones that produce active regions with bipolar spot pairs. They seem to emerge randomly in the activity belts but not near the poles. The emerging pairs are most easily detected in internetwork regions where they pop up in isolation. They are then seen to split; the two components are then transported in random-walk fashion along with the supergranular flows to the cell boundaries. Underway they frequently suffer same-polarity merging and opposite-polarity cancelation, but enough survive and make it to the network to replenish all its magnetic flux on a time scale of one to a few days, while a similar amount of flux vanishes though cancelation (Schrijver et al. 1997).
Merging enhances their local field strength. Apparent cancelation can be due to fields with U-loop shape rising through and out of the surface, with the observed surface cross-sections of their legs appearing to move together and vanishing. Similarly, apparent cancelation may result from fields with inverted U-loop shape sinking below the surface. Other cancelation can occur in small-scale magnetic reconnection in which only the net surplus of the polarity with larger flux remains visible. Operating at small scales, these processes are probably also important in shredding and converting larger-scale magnetic fields to the small scales where Ohmic dissipation can remove them, hence in doing away with the flux that surfaces at large activity and is not spilled into space by CMEs etc. A good discussion of these processes and their role in flux spreading and removal is given in Chapt. 6 of Schrijver & Zwaan (2000).
Numerical simulations suggest that the weak granular internetwork fields found with Hinode are insufficient to play a direct role in the overlying chromosphere (Martínez-Sykora et al. 2019). However, Gošić et al. (2014) have used sensitive multi-day Hinode spectropolarimetry to show that also these weak features tend to drift per random walk to the supergranular cell boundaries, suffering much merging and cancelation underway. In merging the combined weak field may become strong enough to suppress internal convection and “collapse” into kilogauss tube-like MCs which may so contribute to strong-field network as seen in Fig. 1. Gošić et al. (2014) found that weak-field merging dominates markedly over cancelation and that the resulting net quiet-field contribution can replenish all network flux within one day, competitive with ephemeral regions. The picture so emerges that larger-scale unipolar network and plage patterns are found where equatorial field in the form of ephemeral regions or polar field in the form of polar faculae win the competition with the weak-field granular dynamo producing salt-and-pepper bipolar network.
The full-disk magnetograms and their cut-out enlargements in the second column of Fig. 1 demonstrate resulting strong-field plage and network patterns. The high activity sampled in the first-row magnetogram has extended dominating-polarity plage areas along the activity belts but fewer MCs with more salt-and-pepper appearance and less cellular patterning in faculae towards the poles. The medium activity sampled in the second magnetogram shows similar but lower amplitude patterns. The low activity sampled in the bottom magnetogram shows salt-and-pepper sprinkling all over the disk, with only one minor active region in the North-East.
Quiet bipolar network produced by local dynamo action on granular scales does not vary with cycle phase or latitude. Ephemeral regions tend to emerge preferentially in the activity belts and produce bipolar network in addition to the more active unipolar network and plage found in and near active regions that resulted from much larger toroidal-system loop emergence. Thus, active region network and plage as well as quieter network produced by ephemeral regions occupies the activity belts and is modulated along with the cycle, with the sunspot number a valid proxy. Similarly, where polar field emergence dominates over the granular dynamo the number of polar faculae represents a valid proxy (Muñoz-Jaramillo et al. 2012).
Small-scale magnetism and the heliosphere.
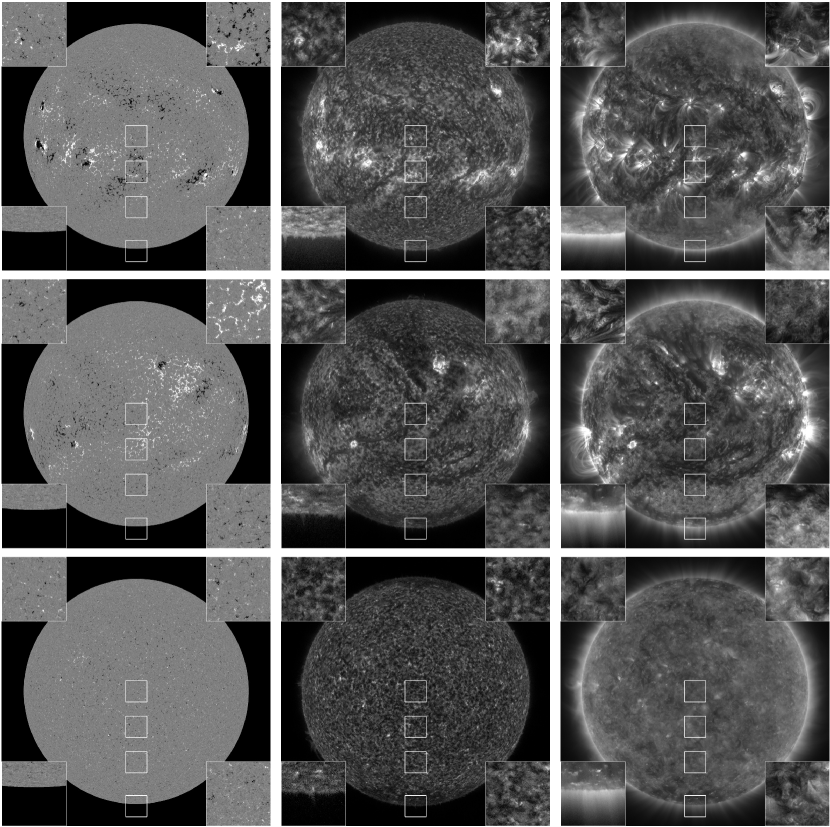
Figure 3 is a companion to Fig. 1. It shows corresponding heating patterns in the outer solar atmosphere: the chromosphere in the middle column, the corona in the third column. For these diagnostics brightness implies the presence of 100 000 K gas (304 Å) and of 1 million K gas (171 Å), respectively.
The top row sampling high activity shows activity belts dominated by active regions, especially on the Southern hemisphere. These harbor dense clusters of 304 Å emission (here truncated by greyscale clipping). In 171 Å they show much closed connectivity in the form of coronal loops. Towards the poles the heating appears more homogeneous, showing grainy patterns in 304 Å that correspond fairly close to the underlying magnetic network patterns (compare the 304 Åinsets with the magnetogram insets). Towards the poles the 171 Åimage shows more diffuse million-K brightness with many polar plumes (bright outward stalks). The 171 Å cut-outs retain only slight and diffuse underlying network signature.
The middle row shows similar scenes but with an extra component: coronal holes that are visible in both the chromospheric and coronal images. They include an extended polar cap one at the South pole. Comparison with the magnetogram at left shows that the holes tend to neighbor unipolar plage. The 171 Å insets show better (but diffuse) correspondence with the 304 Å ones here.
The bottom low-activity row shows more common regular polar-cap holes, in the chromosphere regular network-size blobs everywhere, roughly representing a map of the supergranulation. The corona shows much less loop connectivity but yet there is 1-million K heating everywhere, with isolated grainy patches of extra heating of which some coincide with bright 304 Å enhanced-heating grains.
The precise mechanisms through which small-scale MCs govern this overlying heating are not yet identified, but most likely they are a mixture of magnetic reconnection and Alvenic wave and shock generation and dissipation. In larger-scale eruptions as flares and surges reconnection plays a key role. On the smaller scales discussed here it is now well established that small Ellerman bombs in active regions are due to opposite-polarity MC cancelation marking strong-field reconnection, both observationally (Watanabe et al. 2011 and with numerical simulations (Hansteen et al. 2019). In quiet network well away from active regions similar but smaller “Ellerman-bomb like” reconnective cancelation events were detected with the SST (Rouppe van der Voort et al. 2016) and then also in simulations (Danilovic 2017).
Much more ubiquitous are so-called “spicules type II” that emanate from all network including monopolar network and also in coronal holes; the latter are easier detected as off-limb spicules through less closed-field confusion. Their tips may reach coronal temperatures (off-limb: De Pontieu et al. 2011, on-disk: Henriques et al. 2016). Recent simulations including ion-neutral separation (Martínez-Sykora et al. 2018) suggest that these are not produced by kilogauss MC cancelation but as shocks from tension release of complex tangled weaker fields. These spicules are probably a major contributor to quiet-Sun heating.
Within coronal holes, in particular polar ones, the production of solar plumes that may also govern the fast solar wind is attributed to opposite-polarity cancelation against network MCs (Wang & Sheeley 1995).
The largest-scale eruptive effect of network and plage outside active regions concerns quiet-Sun filament formation and eruption into coronal mass ejections (CME). Away from activity, filaments form above polarity dividing lines between extended opposite-polarity regions as those in the magnetograms in the top and center rows of Fig. 1), in particular dividers where closed fields arch away on both sides. Filaments may then live for months but suddenly snap into CME-producing eruptions from tether cutting by pattern changes including new flux emergence. The CME catalogs compiled and compared in detail by Lamy et al. (2019) show that from cycle minimum to maximum the overall CME frequency increases tenfold, while the latitudes where they occur spread from only near the equator to all latitudes, with polar crown filaments during cycle maximum. Twice more CMEs result from erupting filaments than from flares, but the highest source-region correlation is with coronal streamers. Thus, the large-scale polarity patterns as in the high-activity magnetograms in Fig. 1 play a pivotal role. Such patterns are absent in the minimum-activity magnetogram at the bottom. Indeed, the observed daily CME production rate tracks the sunspot number quite well and without delay, so that both active-region and quiet-Sun CME production can be handled with this proxy.
References
- Borrero et al. (2017) Borrero, J. M., Jafarzadeh, S., Schüssler, M., & Solanki, S. K. 2017, Space Sci. Rev., 210, 275 ADS
- Bose et al. (2019) Bose, S., Henriques, V. M. J., Joshi, J., & Rouppe van der Voort, L. 2019, A&A, 631, L5 ADS
- Carlsson et al. (2004) Carlsson, M., Stein, R. F., Nordlund, Å., & Scharmer, G. B. 2004, ApJL, 610, L137 ADS
- Danilovic (2017) Danilovic, S. 2017, A&A, 601, A122 ADS
- De Pontieu et al. (2011) De Pontieu, B., McIntosh, S. W., Carlsson, M., et al. 2011, Science, 331, 55 ADS
- de Wijn et al. (2009) de Wijn, A. G., Stenflo, J. O., Solanki, S. K., & Tsuneta, S. 2009, Space Sci. Rev., 144, 275 ADS
- Frazier & Stenflo (1978) Frazier, E. N. & Stenflo, J. O. 1978, A&A, 70, 789 ADS
- Gošić et al. (2014) Gošić, M., Bellot Rubio, L. R., Orozco Suárez, D., Katsukawa, Y., & del Toro Iniesta, J. C. 2014, ApJ, 797, 49 ADS
- Hansteen et al. (2019) Hansteen, V., Ortiz, A., Archontis, V., et al. 2019, A&A, 626, A33 ADS
- Harvey & Martin (1973) Harvey, K. L. & Martin, S. F. 1973, SoPh, 32, 389 ADS
- Henriques et al. (2016) Henriques, V. M. J., Kuridze, D., Mathioudakis, M., & Keenan, F. P. 2016, ApJ, 820, 124 ADS
- Keller et al. (2004) Keller, C. U., Schüssler, M., Vögler, A., & Zakharov, V. 2004, ApJL, 607, L59 ADS
- Lamy et al. (2019) Lamy, P. L., Floyd, O., Boclet, B., et al. 2019, Space Sci. Rev., 215, 39 ADS
- Lites et al. (2008) Lites, B. W., Kubo, M., Socas-Navarro, H., et al. 2008, ApJ, 672, 1237 ADS
- Lites et al. (2017) Lites, B. W., Rempel, M., Borrero, J. M., & Danilovic, S. 2017, ApJ, 835, 14 ADS
- Martínez-Sykora et al. (2018) Martínez-Sykora, J., De Pontieu, B., De Moortel, I., Hansteen, V. H., & Carlsson, M. 2018, ApJ, 860, 116 ADS
- Martínez-Sykora et al. (2019) Martínez-Sykora, J., Hansteen, V. H., Gudiksen, B., et al. 2019, ApJ, 878, 40 ADS
- Muñoz-Jaramillo et al. (2012) Muñoz-Jaramillo, A., Sheeley, N. R., Zhang, J., & DeLuca, E. E. 2012, ApJ, 753, 146 ADS
- Pietarila Graham et al. (2010) Pietarila Graham, J., Cameron, R., & Schüssler, M. 2010, ApJ, 714, 1606 ADS
- Rouppe van der Voort et al. (2016) Rouppe van der Voort, L. H. M., Rutten, R. J., & Vissers, G. J. M. 2016, A&A, 592, A100 ADS
- Scharmer et al. (2019) Scharmer, G. B., Löfdahl, M. G., Sliepen, G., & de la Cruz Rodríguez, J. 2019, A&A, 626, A55 ADS
- Schrijver et al. (1997) Schrijver, C. J., Title, A. M., van Ballegooijen, A. A., Hagenaar, H. J., & Shine, R. A. 1997, ApJ, 487, 424 ADS
- Schrijver & Zwaan (2000) Schrijver, C. J. & Zwaan, C. 2000, Solar and Stellar Magnetic Activity ADS
- Solanki (1993) Solanki, S. K. 1993, Space Sci. Rev., 63, 1 ADS
- Spruit (1976) Spruit, H. C. 1976, SoPh, 50, 269 ADS
- Spruit & Zwaan (1981) Spruit, H. C. & Zwaan, C. 1981, SoPh, 70, 207 ADS
- Trujillo Bueno et al. (2004) Trujillo Bueno, J., Shchukina, N., & Asensio Ramos, A. 2004, Nat, 430, 326 ADS
- Wang & Sheeley (1995) Wang, Y. M. & Sheeley, N. R., J. 1995, ApJ, 452, 457 ADS
- Watanabe et al. (2011) Watanabe, H., Vissers, G., Kitai, R., Rouppe van der Voort, L., & Rutten, R. J. 2011, ApJ, 736, 71 ADS
- Zwaan (1967) Zwaan, C. 1967, SoPh, 1, 478 ADS