REAM: An Enhancement Approach to Reference-based Evaluation Metrics for Open-domain Dialog Generation
Abstract
The lack of reliable automatic evaluation metrics is a major impediment to the development of open-domain dialogue systems. Various reference-based metrics have been proposed to calculate a score between a predicted response and a small set of references. However, these metrics show unsatisfactory correlations with human judgments. For a reference-based metric, its reliability mainly depends on two factors: its ability to measure the similarity between the predicted response and the reference response, as well as the reliability of the given reference set. Yet, there are few discussions on the latter. Our work attempts to fill this vacancy. We first clarify an assumption on reference-based metrics that, if more high-quality references are added into the reference set, the reliability of the metric will increase. Next, we present REAM: an enhancement approach to Reference-based EvAluation Metrics111Interested reader may contact the authors to obtain a copy of the code and the data. for open-domain dialogue systems. A prediction model is designed to estimate the reliability of the given reference set. We show how its predicted results can be helpful to augment the reference set, and thus improve the reliability of the metric. Experiments validate both the effectiveness of our prediction model and that the reliability of reference-based metrics improves with the augmented reference sets.
1 Introduction
The lack of reliable automatic evaluation metrics is a major impediment to the development of open-domain dialogue systems (Li and Jurafsky, 2016; Gao et al., 2019; Li et al., 2020a). The underlying difficulty in evaluation lies in the diversity of the possible outcomings. Existing evaluation metrics for open-domain dialogue systems can be roughly divided into reference-based and reference-free metrics. Reference-based metrics usually measure how similar a generated response is to the reference responses. Reference-free metrics, on the other hand, measure the quality of a response without any reference and usually focus on specific aspects of the responses. For example, much work often computes the perplexity of a generated response as a measure of fluency (Li et al., 2020b), and adopts Dist-1/2 (Li et al., 2016b) to measure the diversity of the response. In this work, we focus on reference-based metrics.
BLEU (Papineni et al., 2002), originally for machine translation, is now a popular reference-based metric to evaluate open-domain dialog systems automatically. However, it has been shown that BLEU and other word-overlap metrics such as METEOR (Banerjee and Lavie, 2005) and ROUGE (Lin, 2004), rely on surface-form similarities only without considering the semantic diversity, thus fail to correlate well with human judgements (Liu et al., 2016). Instead, embedding-based metrics are adopted to consider the semantic meaning of a word defined by a distributed representation. For example, Zhang et al. (2020) introduce an embedding-based metric BERTScore that computes the similarity between the generated response and reference responses using contextual embeddings obtained from BERT (Devlin et al., 2019).
Intuitively, the reliability of a referenced-based metric depends on two factors: (1) the ability of the metric to measure the similarity between the generated response and the reference response and (2) the reliability of the reference set for evaluating each generated response. As can be seen from above, most current work falls into improving the former factor, while few considers the latter. However, without a high-quality reference set, the results obtained by all these metrics will have a poor correlation with human judgments.
Unlike most previous studies that propose new evaluation metrics, the focus of our study is on improving the reliability of the reference set. We first clarify an assumption on reference-based metrics that, if more high-quality responses are added into the reference set, the correlation of reference-based metrics with human judgments will increase. We perform experiments to demonstrate that the standard BLEU Papineni et al. (2002) does not hold this assumption, but two existing metrics can. One is a modified BLEU metric Freitag et al. (2020) that compares the generated response with each reference response within the set using single-reference BLEU. We refer this modified BLEU as BLEU*. The other is the BERTScore Zhang et al. (2020), which can also be used to evaluate responses with multiple references.
In this work, we propose REAM: an enhancement approach to Reference-based EvAluation Metrics for open-domain dialogue systems. Our approach, which can enhance a reference-based metric that satisfies our assumption (such as BLEU* and BERTScore), consists of two parts: (1) reliability prediction and (2) high-quality references augmentation. In the first part, we devise a reliability prediction model to estimate the reliability of the reference set. Given a query and its reference set, the model will predict a reliability score to reflect how reliable a metric is used to evaluate the results of the query using the given reference set. In the second part, we aim to augment high-quality references with the help of the reliability prediction model. We introduce two ways to handle reference candidates with different qualities. If the acquired reference candidates are considered reliable, we can adopt automatic annotation. If we are not certain about the relevance of the reference candidates, human annotators are needed for an interactive annotation. Experimental results show that our proposed approach can effectively enhance the reliability of the reference set and improve the correlation of the reference-based metrics BLEU* and BERTScore.
The rest of this paper is organized as follows. In Section 2, we introduce our assumption on the reference-based metrics, and conduct a series of preliminary experiments to validate this assumption on existing metrics. We also provides details about data collection and metric evaluation in this section. Section 3 describes our reliability prediction model and Section 4 presents how to augment high-quality references with the help of the proposed reliability prediction model. Section 5 shows our experimental results about the proposed reliability prediction model as well as different strategies to augment the reference set. Section 6 describes related work. Finally, we conclude our work and discuss some future work in Section 7.
2 Research Questions and Settings
We first make an assumption on reference-based metrics for open-domain dialog system that if more high-quality reference responses are added to the reference set, a reference-based metric will show a higher correlation with human judgments. We want to draw such an assumption due to two considerations. First, by considering the nature of open-domain dialog, a query is possible to be relevant to multiple diverse responses. Including more relevant responses in the reference set can naturally help alleviate the assessment difficulty associated with linguistic variation. Second, if a low-quality response, e.g. a general response “I don’t know” is added to the reference set, the reference-based metric will assign a very high score for the same low-quality predicted response, resulting in a low correlation. Therefore, only by ensuring that the responses in the reference set are of high-quality can we avoid the metric assigning high scores to low-quality responses.
We validate this assumption on three existing metrics: the original multi-reference BLEU Papineni et al. (2002), BLEU* (Freitag et al., 2020) and BERTScore (Zhang et al., 2020). The original BLEU uses a modified form of precision to compare a generated response against multiple reference responses. For BLEU* and BERTScore, the multi-reference score of a response can be computed as:
| (1) |
where is the given metric, is the given reference set.
We examine the assumption by answering the following questions:
-
1.
Will the correlation of the reference-based metric improve when more high-quality responses are added to the reference set?
-
2.
How will the low-quality responses included in the reference set affect the correlation of the reference-based metric?
Before presenting the details of the preliminary experiments, we first describe the data collection used in the experiments and how we estimate the reliability of a metric.
2.1 Data Collection and Metric Evaluation
To evaluate the correlation of reference-based metrics with human judgments, we collect a dataset as follows. We first crawled 5,000 queries from some Chinese social websites and the largest reference set for the obtained queries has 200 responses. Then, we generated 14 responses obtained from several widely used response generation models (described in Appendix A). We asked 5 annotators to assign each generated response with a score ranging from 1 to 5 respectively, and the final score of each response was obtained by averaging the five scores. Table 1 shows the data statistics. See Appendix A for a detailed description of our dataset.
| Raw Dataset | |
| # Training Samples | 4,000 |
| # Validation Samples | 500 |
| # Test Samples | 500 |
| Each Sample | |
| # Model Responses | 14 |
| # Reference Responses | 200 |
To evaluate the performance of a metric, we leverage the Pearson Correlation. Given a sample consisting of a query , 14 generated responses with their human annotated scores and a set of reference responses (), we first score each model response with a certain metric, yielding a sequence of automatic evaluated scores . With the automatic evaluated scores and human annotated scores for the 14 generated responses, we can obtain the reliability score for each sample using the Pearson Correlation:
| (2) |
2.2 Preliminary Experiments
Next, we conduct our preliminary experiments using the 500 samples in the test set and present our empirical observations regarding the two questions in beginning of Section 2. In the experiments in this section, the correlation of a certain metric is obtained by averaging the reliability scores over all 500 samples.
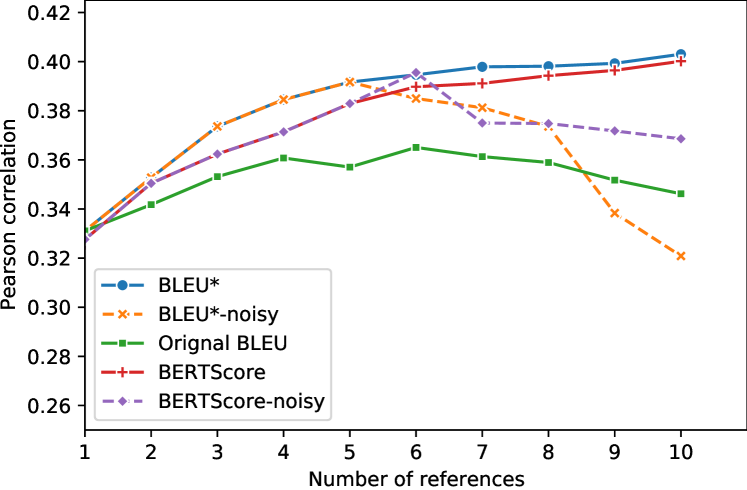
First, we would like to see how it affects the correlation of the metrics when high-quality responses are continuously added to the reference set. To ensure that each added reference response is of high quality, we also have human annotators assign a quality score to each crawled reference response, and then randomly select 10 high-quality reference responses (quality score over 4) for each sample in the test set. We sequentially add the 10 high-quality reference responses to the reference set initialized with an empty set. Each time a new reference response is added to the set, we calculate a reliability score of a certain metric using the updated set. Figure 1 shows the evaluation results of the original BLEU, BLEU* and BERTScore. Noticeably, the correlation of the original BLEU does not improve as the number of high-quality sentences increases. The reason may be that the original BLEU is defined at the corpus-level and the n-gram precisions are sums over all corpus sentences, which means the newly added reference will cause the value to fluctuate. We, however, find that BLEU* and BERTScore are consistent with our assumption that the correlation of the metric improves as the number of high-quality responses in the set increases. Therefore, not all metrics meet our assumption, and we use BLEU* and the BERTScore for our following experiments.
Second, we test how low-quality responses would affect the correlation of the metric by adding noise into the reference set. In the noisy reference set, the first 5 responses in the reference set are added with the same high-quality responses as above, while the later 5 added responses are replaced with negative samples which are responses sampled from other queries. As shown in Figure 1, “BLEU*-noisy” and “BERTScore-noisy” denote the results of BLEU* and BERTScore using the noisy reference sets, respectively. As the number of negative samples in the set increases, the performance of the metrics starts to degrade. This further confirms our assumption that only adding more high-quality responses to the reference set will help the metric.
Based on the above analysis, we can see that for reference-based metrics satisfying our assumption, we can enhance its reliability by augmenting high-quality references to calculate the metric. Next, a key question arises, how can we augment high-quality references? In the following, we propose a reliability prediction model to estimate the reliability of the reference set (Section 3) and provide effective approaches to augment high-quality references with the help of the reliability prediction model (Section 4).
3 The Reliability Prediction Model
In this section, we aim to estimate the reliability of a metric, when we use it to compute a performance score of an output response based on a given gold response set. We formulate this task as a regression problem. Formally, given a query sentence of length , and a reference set with gold responses of the query, our goal is to learn a function that predicts a reliability score that represents how reliable a metric is used to evaluate results of the input query using this reference set. In this work, we consider using Pearson correlation () in Eq. 2 between the human evaluation results and the metric scores from the given as the reliability score of each . We introduce the reliability prediction model in this section, and discuss efficient methods to augment high-quality responses based on the trained prediction model in the next section.
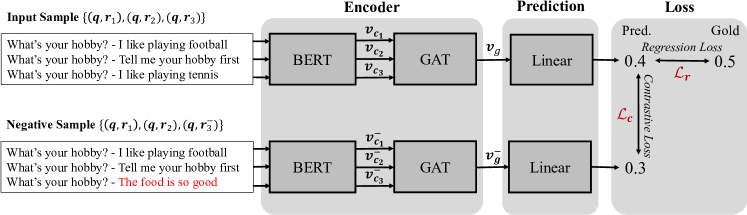
Our learning framework is shown in Figure 2, which contains two parts. We first design a prediction model to predict a reliability score for each . Then, we construct negative samples and use contrastive learning to train the proposed prediction model.
3.1 Model Structure
Input Representation For a query and each response in the reference response set , we first concatenate them into one sequence. Then we can obtain query-response pairs. We leverage BERT (Devlin et al., 2019) that learns contextualized representations of the query-response pairs:
| (3) |
where is the representation for the special token [CLS] in the BERT and we use its contextualized representation for each query-response pair. Then, we get query-response representations.
Graph Encoder: In order to transform the dialogue context features into higher-level features that consider the intrinsic variance between reference responses in the reference set, we represent all query-response pairs in a fully-connected graph and each query-response pair is a node in the graph. Then we adopt a graph attention layer (Velickovic et al., 2018) to obtain a better representation of each query-response pair:
| (4) |
The final representation of the graph is computed using the max-pooling strategy.
Reliability Score Prediction: The reliability score is computed using a single-layer feedforward network coupled with a tanh activation function:
| (5) |
where and are trainable parameters. The model is trained to minimize the squared error between the model prediction and the gold correlation coefficient with L2-regularization:
| (6) |
where is a hyper-parameter and denotes the parameters of the model.
3.2 Data Augmentation
To address the problem of limited data, we adopt the data augmentation method to improve the generalization of our models. Our input sample consists of a query and a set of reference responses . We can expand the training data by using different combinations of reference responses, generating more different reference sets for each query. Since the number of all combinations is huge, we randomly sample some various combinations for each query. Given a set of reference responses of elements (), the set of -combinations are denoted as , where each combination has different elements. In our work, we use and randomly sample 25 different combinations from each set (). We then expand the validation set in the same way.
To evaluate the generalization performance of the model, the test set should be used not only to verify the effectiveness of the model on samples with , but also to test the performance of the model on samples with . Therefore, we use to augment the test set. For each set (), we only randomly sample one combination. Finally, applying data augmentation as described above gives us a total of 400,000/4,000/3,000 augmented training/validation/test samples.
3.3 Contrastive Learning
Optimizing the simple regression objective above with the augmented training samples may not yield a robust performance. To make the model capable to capture the differences between different reference set for the same query, we construct multiple negative samples for each training sample , and use contrastive learning to train the prediction model. Given a training sample () we design three kinds of negative samples ():
-
•
Remove one response from the existing reference set . This is based on the understanding in Section 2 that a set of gold responses generally does not yield a higher correlation than a super set of it. We note that all samples with deteriorated correlation here, are treated as negative samples.
-
•
Randomly select a response of any other query to add to the existing set. This is based on the understanding in Section 2 that a noise response included in a gold reference set should deteriorate the correlation.
-
•
Randomly select a response of any other query to replace a response in the existing set. The intuition is the same as the above one.
The contrastive loss function with negative samples constructed is computed as:
| (7) |
where is a margin. The final loss can be computed as:
| (8) |
4 Augmenting High-quality References
In this section, we describe how we can augment high-quality references based on the current gold reference set for a given query with the help of the proposed reliability prediction model. Suppose a large set of reference candidates can be easily obtained. For example, more conversation data can be assessed to build a retrieval system to search for more references for the given query. We introduce two ways to handle reference candidates with different qualities. If the acquired reference candidates are considered reliable, we can adopt automatic annotation. If we are not certain about the relevance of the reference candidates, human annotators are needed for an interactive annotation.
4.1 Automatic Annotation
We assume the response candidates are all relevant to the given query. However, there may exist uninformative responses, such as the generic responses or those similar to the gold references. We now introduce how to use the predicted scores to automatically select out high-quality responses from the candidate set. Each time a response is randomly picked to tentatively add into the gold reference set, the model will predict a reliability score for the augmented reference set. If the reliability score of the augmented reference set improves, this picked response can be considered as a high-quality one and now confirmed to add to the gold reference set. Otherwise, we remove it from the gold reference set. We continue this process until all response candidates have been picked once, and return the final augmented gold reference set.
4.2 Interactive Annotation
If the response candidates are of uneven relevance to the query, we need to hire annotators to manually check and edit the response candidates. We design an interactive annotation strategy to allow the model to assist annotators. For each selected response candidate, the annotator mainly executes the following three steps:
-
1.
If he/she considers the response candidate is relevant to the given query and the reliability score of the set improves with the current candidate response, he/she can retain this response directly;
-
2.
If he/she considers the response candidate is not relevant enough to the given query but the reliability score of the set shows improvement with the current candidate response, he/she needs to edit this response and check whether the reliability score of the set increases with the edited response;
-
3.
If the reliability score of the set does not improve with the current candidate response, no matter whether the candidate response is relevant or not, he/she still needs to edit this response and check whether the reliability score of the set increases with the edited response;
In both Step2 and Step3, we allow the interactive annotation with a maximum number of attempts. Otherwise, we abandon this response and continue to the next response candidate. This process can help annotators avoid writing responses with unsatisfactory quality.
5 Experiments
5.1 Setup
In our experiments, we use the quality scores obtained by BLEU* and BERTScore to compute the Person correlations with human judgments respectively. The reliability models introduced in Section 3 trained with BLEU and BERTScore are referred as REAM(BLEU*) and REAM(BS) respectively. The augmented dataset mentioned in Section 3.2 is used for the corresponding model training and testing. To show its effectiveness on automatic annotation and interactive annotation, we use the 500 test samples in the raw dataset introduced in Section 2.1. See Appendix B for implementation and training details.
5.2 Results on Reliability Prediction Models
| # Refs | MSE | Pred. | Gold |
| REAM(BLEU*) | |||
| 3 | 0.006 0.005 | 0.333 | 0.340 |
| 5 | 0.006 0.006 | 0.374 | 0.379 |
| 10 | 0.006 0.005 | 0.399 | 0.402 |
| 20 | 0.006 0.005 | 0.412 | 0.409 |
| 30 | 0.007 0.006 | 0.413 | 0.417 |
| 40 | 0.006 0.006 | 0.422 | 0.425 |
| REAM(BS) | |||
| 3 | 0.006 0.006 | 0.356 | 0.355 |
| 5 | 0.006 0.005 | 0.367 | 0.375 |
| 10 | 0.006 0.006 | 0.393 | 0.404 |
| 20 | 0.006 0.005 | 0.397 | 0.408 |
| 30 | 0.006 0.005 | 0.406 | 0.417 |
| 40 | 0.007 0.006 | 0.417 | 0.431 |
In Table 2, we report MSE, the averaged predicted reliability scores and averaged gold reliability scores. Standard deviations are also provided. We can see that the MSE of both prediction models are kept at a low level on different test sets. The difference between the average predicted reliability score and the average gold scores is at most 0.014. Also, the models have good stability and rarely show extreme cases, as shown by their standard deviations of less than 0.01. Our proposed models also have good generalization performance in terms of different sizes of the reference set. The number of references of training samples in the training set is at most 10, but the two models still have a small test error on the test set with more than 10 references, which is comparable to the test set with less than 10 references.
5.3 Results on Automatic Annotation
Once we have a reliable model, the next is to use the model to help us collect high-quality references. When enough candidate responses are available, we can directly use the model to identify which responses are helpful to improve the reliability of the set. The experiment on automatic annotation is conducted with the raw test set introduced in Section 2.1. For each sample in the test set, we initialize the reference set with a randomly sampled crawled reference response, then add the remaining reference responses (as mentioned before, each sample has at most 200 reference responses) to its reference set one by one. Each time a new response is added, the model predicts a reliability score. The augmentation method follows the strategy mentioned in Sec. 4.1. We selected 10 responses for each sample.
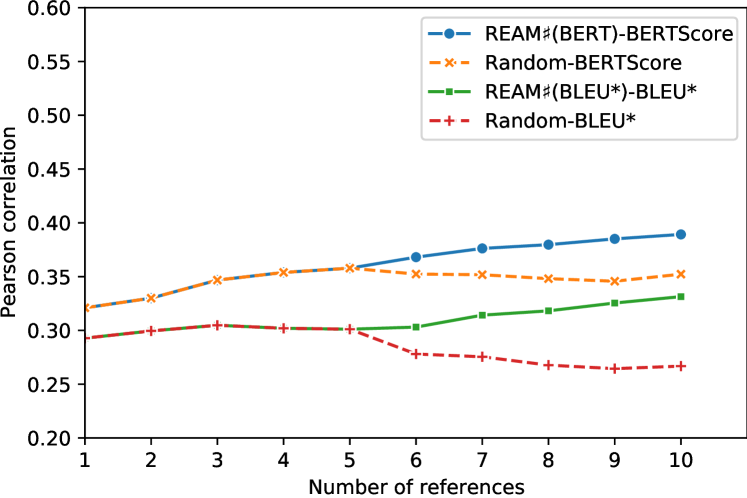
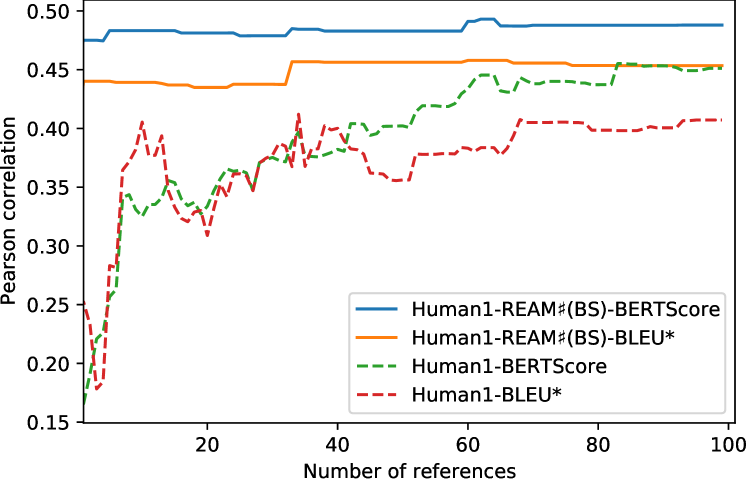
Figure 3 shows the Pearson correlations of BLEU* and BERTScore on multiple reference sets obtained by different strategies. “REAM(BS)-BERTScore” means using the REAM(BS) model to augment the reference set and testing it with BERTScore. Similarly, “REAM(BLEU*)-BLEU*” means using the REAM(BLEU*) model to augment the reference set and testing it with BLEU*. We also use a random strategy for comparison (orange and red), where the first 5 responses are the same as those previously selected using the models, and the last 5 responses are obtained by randomly sampling. As shown in the figure, the reliability of the reference sets constructed using our proposed method tends to increase steadily as more selected responses are added to the set, while the reliability of the reference sets constructed using the random strategy appears to be unstable. We also test the transferability of the model and find that the model trained with one metric also yields reliable performance when tested with other metrics. The results are shown in Appendix E.
The final results are shown in Table 3 which reports Pearson and Kendall correlations of BLEU* and BERTScore calculated using three reference sets. “Raw” denotes the initial reference set containing the first selected reference response. The remaining 9 selected responses for each sample are then used to augment the “Raw” set. “Aug-REAM(BS)” and “Aug-REAM(BLEU*)” are the reference sets augmented using the REAM(BS) and REAM(BLEU*), respectively. “Mix” is the union of the two sets. As can be seen, the performances of the two metrics both improve using the augmented reference set. When combining the two augmented reference sets, both Pearson and Kendall correlations of BERTScore improve, while for BLEU*, the Pearson and the Kendall correlations dropped slightly. This indicates that BERTScore is better at capturing semantics than BLEU* and is able to select the most adequate reference response from multiple augmented sets for evaluation.
5.4 Results on Interactive Annotation
In the following, we perform experiments to augment high-quality references of 30 queries randomly selected in the test set in Section 2.1 using interactive annotation introduced in Section 5.4. For each test query, we first use ElasticSearch 222Elasticsearch is a search engine based on the Lucene library. https://www.elastic.co to retrieve 100 candidate responses from a database with 200 million (query, response) pairs with Jaccard similarity for each query, and display them to each annotator. We recruit six annotators and divide them into two groups. The reliability scores predicted by the REAM(BERT) model will reveal to annotators in the first group (“Human-REAM(BS)”) for interactive annotation but not annotators in the second group (“Human”). Annotators in “Human” perform non-interactive annotations. They are required to rewrite their considered unsuitable responses directly without the predicted scores as a reference. For each round of annotation, we pick one identical candidate response to all annotators.
| Pearson | Kendall | |
| BLEU* | ||
| Raw | 0.246 | 0.165 |
| Aug-REAM(BLEU*) | 0.331 | 0.269 |
| Aug-REAM(BS) | 0.315 | 0.261 |
| Mix | 0.329 | 0.266 |
| BERTScore | ||
| Raw | 0.288 | 0.209 |
| Aug-REAM(BLEU*) | 0.380 | 0.311 |
| Aug-REAM(BS) | 0.389 | 0.318 |
| Mix | 0.393 | 0.319 |
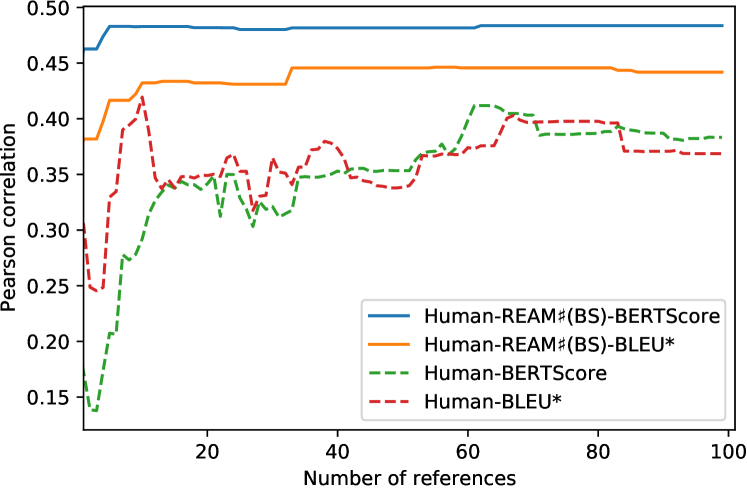
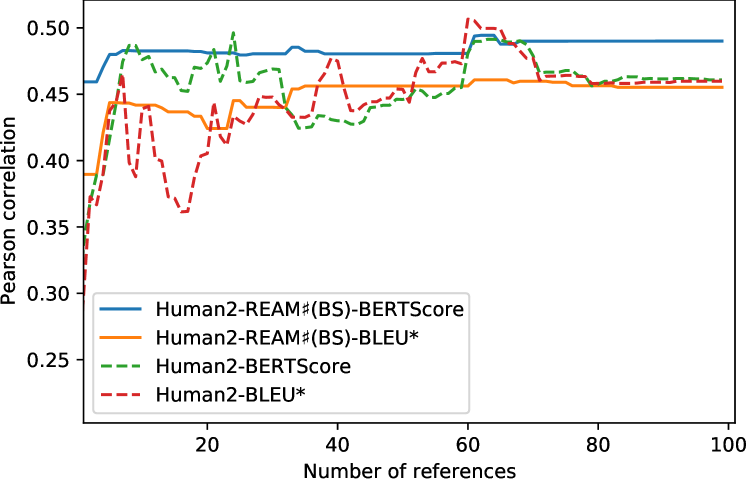
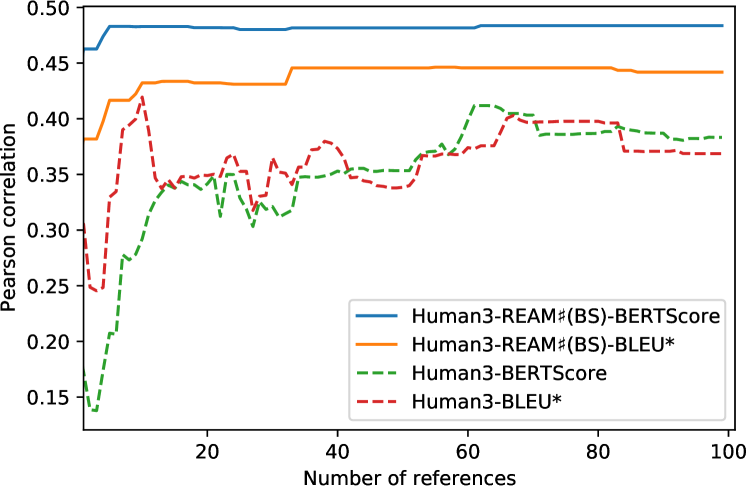
Figure 4 shows the Pearson correlations of human evaluation results and BERTScore with the augmented reference sets after each round of annotation by one annotator in “Human-REAM(BS)” and another annotator in “Human”. See Appendix D for the results of all six annotators. We can see that using the augmented response set from annotators in the first group has already reached a relatively high Pearson correlation with only a few annotation rounds. When the number of responses increases to a certain level, the reliability score of the metric hits a bottleneck and rises more slowly. However, the correlation results using the augmented response set from annotators in the second group are not stable. Though the overall trend is increasing, the final obtained reference set has even worse correlations than a much small augmented set from the first group. This shows that our interactive annotation strategy is effective to help annotators avoid writing responses with unsatisfactory quality.
6 Related Work
Automatic evaluation is crucial to the research of open-domain dialog systems (Li and Jurafsky, 2016; Li et al., 2017; Gao et al., 2019; Venkatesh et al., 2018; Chan et al., 2021; Xiang et al., 2021). Existing metrics can be broadly categorized into reference-based and reference-free metrics (Chen et al., 2021). In this work, we focus on reference-based metrics, which usually measure how similar a generated response is to the reference response.
The most commonly used reference-based metrics for dialog systems were originally proposed for machine translation. They typically count the amount of word-overlap between the generated response and the reference response. BLEU (Papineni et al., 2002) is the most widely used metric in machine translation that calculates the geometric mean of the precision for -gram. Other related word-overlap metrics such as NIST (Lin and Och, 2004), METEOR (Banerjee and Lavie, 2005) and ROUGE (Lin, 2004) also have been used for dialogue evaluation.
Instead of using word-overlap based metrics, embedding-based metrics are adopted to consider the semantic meaning of a word as defined by a distributed representation. They typically compute the similarity between the generated response and reference response using approximated sentence-level representations. The most commonly used word embedding based metrics use a heuristic to combine the vector representation of the individual word in the sentence. For example, Embedding Average (Foltz et al., 1998; Mitchell and Lapata, 2008), Vector Extrema (Forgues and Pineau, 2014), and Greedy Matching (Rus and Lintean, 2012). Zhang et al. (2020) introduce a better embedding-based metric BERTScore that computes token similarity using contextual embeddings that capture the specific use of a word in a sentence.
A few reference-based metrics for dialog systems are learnable functions. ADEM (Lowe et al., 2017) which is based on neural networks is trained to predict a score of a response given its query and a reference response. RUBER (Tao et al., 2018) evaluates responses with a blending of scores from the referenced and unreferenced metrics. RUBER is learnable, but its training does not require human annotation scores.
As discussed from the very beginning of our work, all the above work focus on designing a better metric. However, the reliability of the reference set is also a key to improve the correlation of reference-based metrics, but not investigated in detail in previous work. Therefore, we believe our work can fill this vacancy and provide a new direction to improve reference-based metrics for open-domain dialogue generation.
7 Conclusions and Future Work
In this paper, we first clarify an assumption on existing reference-based metrics that if more high-quality reference responses are added to the reference set, it should have a higher correlation with human judgment. For metrics satisfying this assumption, we present REAM, an enhancement approach to improve their reliability. In our approach, a reliability prediction model is trained to estimate the reliability of the reference set and we explore both automatic and interactive ways to augment high-quality references with the help of the reliability prediction model. Experiments show that our approach can efficiently help augment high-quality references and the correlations of reference-based metrics improve when using the augmented reference sets to evaluate dialog responses. Our work currently focuses on open-domain dialog systems as a starting point. However, the REAM framework can be extended naturally to other open-ended text generation tasks such as story generation and question generation.
8 Ethical Considerations
The dataset used in our work are crawled from several Chinese social media websites, BaiduTieba, Douban, Weibo and Zhihu. We purposefully avoid deanonymization techniques based on exploiting software vulnerabilities and our approach that involves human participation in rewriting responses gives us no access to any personally identifiable information.
References
- Banerjee and Lavie (2005) Satanjeev Banerjee and Alon Lavie. 2005. METEOR: An automatic metric for MT evaluation with improved correlation with human judgments. In Proceedings of the ACL Workshop on Intrinsic and Extrinsic Evaluation Measures for Machine Translation and/or Summarization.
- Chan et al. (2021) Zhangming Chan, Lemao Liu, Juntao Li, Haisong Zhang, Dongyan Zhao, Shuming Shi, and Rui Yan. 2021. Enhancing the open-domain dialogue evaluation in latent space. In Proceedings of the 59th Annual Meeting of the Association for Computational Linguistics: Findings.
- Chen et al. (2021) Wang Chen, Piji Li, and Irwin King. 2021. A training-free and reference-free summarization evaluation metric via centrality-weighted relevance and self-referenced redundancy. In Proceedings of the 59th Annual Meeting of the Association for Computational Linguistics.
- Devlin et al. (2019) Jacob Devlin, Ming-Wei Chang, Kenton Lee, and Kristina Toutanova. 2019. BERT: Pre-training of deep bidirectional transformers for language understanding. In Proceedings of the 2019 Conference of the North American Chapter of the Association for Computational Linguistics: Human Language Technologies.
- Foltz et al. (1998) P. Foltz, W. Kintsch, and T. Landauer. 1998. The measurement of textual coherence with latent semantic analysis. Discourse Processes.
- Forgues and Pineau (2014) Gabriel Forgues and Joelle Pineau. 2014. Bootstrapping dialog systems with word embeddings. In NIPS, modern machine learning and natural language processing workshop.
- Freitag et al. (2020) Markus Freitag, David Grangier, and Isaac Caswell. 2020. BLEU might be guilty but references are not innocent. In Proceedings of the 2020 Conference on Empirical Methods in Natural Language Processing.
- Gao et al. (2019) Jun Gao, Wei Bi, Xiaojiang Liu, Junhui Li, and Shuming Shi. 2019. Generating multiple diverse responses for short-text conversation. In The Thirty-Third AAAI Conference on Artificial Intelligence.
- Gehring et al. (2017) Jonas Gehring, Michael Auli, David Grangier, Denis Yarats, and Yann N. Dauphin. 2017. Convolutional sequence to sequence learning. In Proceedings of the 34th International Conference on Machine Learning.
- Li and Jurafsky (2016) J. Li and Dan Jurafsky. 2016. Mutual information and diverse decoding improve neural machine translation. ArXiv.
- Li et al. (2016a) J. Li, Will Monroe, and Dan Jurafsky. 2016a. A simple, fast diverse decoding algorithm for neural generation. ArXiv.
- Li et al. (2016b) Jiwei Li, Michel Galley, Chris Brockett, Jianfeng Gao, and Bill Dolan. 2016b. A diversity-promoting objective function for neural conversation models. In Proceedings of the 2016 Conference of the North American Chapter of the Association for Computational Linguistics: Human Language Technologies.
- Li et al. (2017) Jiwei Li, Will Monroe, Tianlin Shi, Sébastien Jean, Alan Ritter, and Dan Jurafsky. 2017. Adversarial learning for neural dialogue generation. In Proceedings of the 2017 Conference on Empirical Methods in Natural Language Processing.
- Li et al. (2020a) Xin Li, Piji Li, Wei Bi, Xiaojiang Liu, and Wai Lam. 2020a. Relevance-promoting language model for short-text conversation. In The Thirty-Fourth AAAI Conference on Artificial Intelligence.
- Li et al. (2020b) Yangming Li, Kaisheng Yao, Libo Qin, Wanxiang Che, Xiaolong Li, and Ting Liu. 2020b. Slot-consistent NLG for task-oriented dialogue systems with iterative rectification network. In Proceedings of the 58th Annual Meeting of the Association for Computational Linguistics.
- Lin (2004) Chin-Yew Lin. 2004. ROUGE: A package for automatic evaluation of summaries. In Text Summarization Branches Out.
- Lin and Och (2004) Chin-Yew Lin and Franz Josef Och. 2004. Automatic evaluation of machine translation quality using longest common subsequence and skip-bigram statistics. In Proceedings of the 42nd Annual Meeting of the Association for Computational Linguistics.
- Liu et al. (2016) Chia-Wei Liu, Ryan Lowe, Iulian Serban, Mike Noseworthy, Laurent Charlin, and Joelle Pineau. 2016. How NOT to evaluate your dialogue system: An empirical study of unsupervised evaluation metrics for dialogue response generation. In Proceedings of the 2016 Conference on Empirical Methods in Natural Language Processing.
- Liu et al. (2018) Yahui Liu, Wei Bi, Jun Gao, Xiaojiang Liu, Jian Yao, and Shuming Shi. 2018. Towards less generic responses in neural conversation models: A statistical re-weighting method. In Proceedings of the 2018 Conference on Empirical Methods in Natural Language Processing.
- Lowe et al. (2017) Ryan Lowe, Michael Noseworthy, Iulian Vlad Serban, Nicolas Angelard-Gontier, Yoshua Bengio, and Joelle Pineau. 2017. Towards an automatic Turing test: Learning to evaluate dialogue responses. In Proceedings of the 55th Annual Meeting of the Association for Computational Linguistics.
- Mitchell and Lapata (2008) Jeff Mitchell and Mirella Lapata. 2008. Vector-based models of semantic composition. In Proceedings of ACL-08: HLT.
- Papineni et al. (2002) Kishore Papineni, Salim Roukos, Todd Ward, and Wei-Jing Zhu. 2002. Bleu: a method for automatic evaluation of machine translation. In Proceedings of the 40th Annual Meeting of the Association for Computational Linguistics.
- Radford et al. (2019) A. Radford, Jeffrey Wu, R. Child, David Luan, Dario Amodei, and Ilya Sutskever. 2019. Language models are unsupervised multitask learners. In OpenAI blog.
- Rus and Lintean (2012) Vasile Rus and Mihai Lintean. 2012. A comparison of greedy and optimal assessment of natural language student input using word-to-word similarity metrics. In Proceedings of the Seventh Workshop on Building Educational Applications Using NLP.
- Tao et al. (2018) Chongyang Tao, Lili Mou, Dongyan Zhao, and Rui Yan. 2018. RUBER: an unsupervised method for automatic evaluation of open-domain dialog systems. In Proceedings of the Thirty-Second AAAI Conference on Artificial Intelligence.
- Velickovic et al. (2018) Petar Velickovic, Guillem Cucurull, Arantxa Casanova, Adriana Romero, Pietro Liò, and Yoshua Bengio. 2018. Graph attention networks. In 6th International Conference on Learning Representations.
- Venkatesh et al. (2018) Anu Venkatesh, C. Khatri, A. Ram, Fenfei Guo, R. Gabriel, Ashish Nagar, Rohit Prasad, M. Cheng, Behnam Hedayatnia, A. Metallinou, Rahul Goel, Shaohua Yang, and A. Raju. 2018. On evaluating and comparing open domain dialog systems. arXiv: Computation and Language.
- Xiang et al. (2021) Jiannan Xiang, Yahui Liu, Deng Cai, Huayang Li, Defu Lian, and Lemao Liu. 2021. Assessing dialogue systems with distribution distances. In Proceedings of the 59th Annual Meeting of the Association for Computational Linguistics: Findings.
- Zhang et al. (2020) Tianyi Zhang, Varsha Kishore, Felix Wu, Kilian Q. Weinberger, and Yoav Artzi. 2020. Bertscore: Evaluating text generation with BERT. In 8th International Conference on Learning Representations.
Appendix A Dataset
The dataset used in our work are crawled from several Chinese social media websites, BaiduTieba, Douban, Weibo and Zhihu. We purposefully avoid deanonymization techniques based on exploiting software vulnerabilities and our approach that involves human participation in rewriting responses gives us no access to any personally identifiable information. We crawled 5,000 queries and each query has at most 200 ref-erence responses. Then, we collected 14 machine-generated responses obtained from several widely used responses generation models:
-
•
LSTM-S2S-BS: a LSTM Seq2Seq model that generates responses with beam search.
-
•
LSTM-S2S-Sampling: a LSTM Seq2Seq model that generates responses with top k sampling.
-
•
LSTM-S2S-MMI: a LSTM Seq2Seq model with a Maximum Mutual Information-based decoding strategy.
-
•
Fconv-S2S-BS: a convolutional Seq2Seq model (Gehring et al., 2017) that generates responses with beam search.
-
•
Fconv-S2S-Sampling: a convolutional Seq2Seq model (Gehring et al., 2017) that generates responses with top k sampling.
- •
-
•
Transformer-S2S-BS: a Transformer Seq2Seq model that generates responses with beam search.
-
•
Transformer-S2S-Sampling: a Transformer Seq2Seq model that generates responses with top k sampling.
-
•
Transformer-S2S-DBS: a Transformer Seq2Seq model that generates responses with diverse beam search (Li et al., 2016a).
-
•
GPT2-BS: a GPT2 (Radford et al., 2019) model that generates responses with beam search.
-
•
GPT2-TopK Sampling (k=20): a GPT2 (Radford et al., 2019) model that generates responses with top 20 sampling.
-
•
GPT2-TopK Sampling (k=10): a GPT2 (Radford et al., 2019) model that generates responses with top 10 sampling.
The GPT2 model are trained on a 200 million chinese dataset crawled also from the Chinese social media websites (BaiduTieba, Douban, Weibo and Zhihu). The LSTM-S2S, Fconv-S2S and Transformer-S2S models are trained on a benchmark dataset with 7M query-response pairs proposed by Liu et al. (2018).
Appendix B Implementation and Training Details
We leverage “bert-as-service” (https://github.com/hanxiao/bert-as-service), an open-source system that uses BERT as a sentence encoder and hosts it as a service to map sentences into fixed-length representations. In our work, we use the character-level BERT pre-trained in Chinese. Our reliability prediction model is implemented using “PyTorch Geometric” which is a geometric deep learning extension library for PyTorch. We use one layer. For graph encoding, we employ a one-layer graph attention network with an input size of 768. The input size of the prediction linear layer also is 768. The model is trained using Adam optimizer with a learning rate of 0.0005. The batch size is 128.
For computing BLEU, we use the Python NLTK library. For computing BERTScore, we use the implementation provided by Zhang et al. (2020) at https://github.com/Tiiiger/bert_score.
Appendix C Case Study
Figure 6 shows two examples of using our REAM(BS) model to predict reliability scores for reference sets. Given a query and a reference set consisting of four reference responses, we first predict a reliability score for this set (e.g 0.312 and 0.275). We prepared four different candidate responses for each sample. The sentences with blue text are high-quality and diverse responses. Sentences without color are responses that are similar in meaning to the responses already in the set. Red sentences are responses that are completely irrelevant to the queries. We add each of the four candidate responses to the set and predict the reliability score for the new set. As shown in the figure, when the high-quality responses are added to the set, the model predicts a higher reliability score than the original reliability score. When responses with repeated semantics are added to the set, the model predicts a slightly lower reliability score compared to the original one. When poor quality responses are added to the set, the reliability scores predicted by the model drop sharply. It can be seen that our model can effectively evaluate the impact of responses with different qualities on the reference set.
Appendix D More Results on Interactive Annotation
Figure 5 shows the results of all six annotators. We can see that using the augmented response set from annotators in the first group has already reached a relatively high Pearson correlation with only a few annotation rounds. When the number of responses increases to a certain level, the reliability score of the metric hits a bottleneck and rises more slowly. However, the correlation results using the augmented response set from annotators in the second group are not stable. Though the overall trend is increasing, the final obtained reference set has even worse correlations than a much small augmented set from the first group. This shows that our interactive annotation strategy is effective to help annotators avoid writing responses with unsatisfactory quality.

Appendix E Transferbility
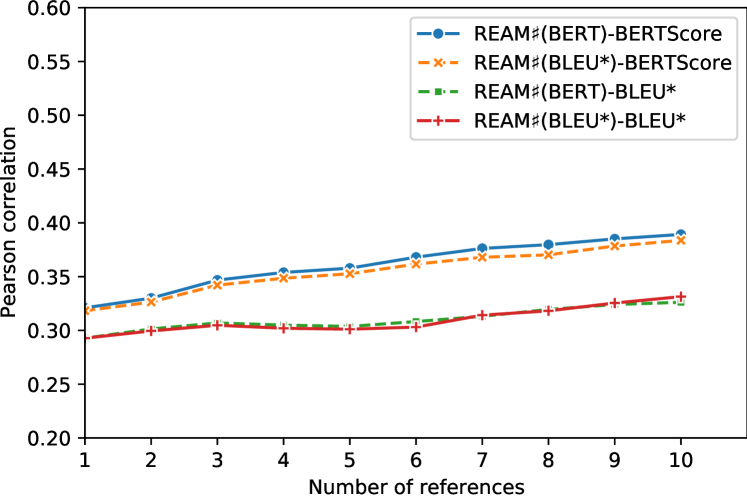
We would like to see if the model trained with one metric also yields reliable performance when tested with other metrics. Figure 7 shows the Pearson correlations of the two models, REAM(BS) and REAM(BLEU*) tested using BLEU* and BERTScore, respectively. From the figure, we can see that whether tested with BLEU* or BERTScore, the difference in performance between REAM(BS) and REAM(BLEU*) is very small. We also notice that the difference in performance tested with BLEU* between the two models is somewhat larger than that tested with BERTScore when the number of references is large. This may be because BLEU* does not utilize the semantic information compared to BERTScore, which leads to some high-quality responses in the reference set being ignored. Therefore, our enhancement approach is more effective as the metric’s ability to capture semantic similarity increases.