Constraint-Based Inference of Heuristics for Foreign Exchange Trade Model Optimization
Abstract
The Foreign Exchange (Forex) is a large decentralized market, on which trading analysis and algorithmic trading are popular. Research efforts have been focusing on proof of efficiency of certain technical indicators. We demonstrate, however, that the values of indicator functions are not reproducible and often reduce the number of trade opportunities, compared to price-action trading.
In this work, we develop two dataset-agnostic Forex trading heuristic templates with high rate of trading signals. In order to determine most optimal parameters for the given heuristic prototypes, we perform a machine learning simulation of 10 years of Forex price data over three low-margin instruments and 6 different OHLC granularities. As a result, we develop a specific and reproducible list of most optimal trade parameters found for each instrument-granularity pair, with 118 pips of average daily profit for the optimized configuration.
Index Terms:
machine learning, Forex, algorithmic trading, simulationI Introduction
The Foreign Exchange, also known as Forex, is a decentralized global market with trillions of dollars of daily turnover [1]. Some unique features of the Forex market make it highly suitable for technical analysis and algorithmic trading [2]. Technical indicator functions are popular heuristics used by Forex traders to identify trading opportunities. Multiple research efforts have been focusing on the proof of efficiency of certain existing indicator functions for fixed trade setups [3, 4, 5, 6, 7, 8, 9]. However, as we demonstrate in Section IV, the values of popular indicators are different for different data sets and brokers. This compromises the accuracy of machine learning of the historical Forex data and impedes the development of concrete recommendation for the traders. Moreover, we also demonstrate that the indicator heuristics reduce the overall count of trade opportunities, and thus reduce the final profit.
In this paper, we develop two dataset-agnostic price-action heuristic templates for trade signals on the Forex Exchange market: candle trend continuation and candle trend reversal. These heuristics are characterized by a very high rate of trading opportunities, compared to popular technical indicators. The ultimate goal of this work is to determine most optimal parameters for the given heuristic templates for each combination of Forex instruments and trade periods given in the input data set. In order to achieve that goal, we develop SmartFX, a machine learning tool which analyzes 10 years of historical Forex price data over three low-margin instruments and 6 different OHLC granularities, delivering a specific and reproducible list of most optimal trade parameters found for each input granularity of each instrument.
I-A Motivation
Although the research and analysis of the Forex market is abound with original approaches, the practical application of these approaches is challenged by the ambiguity of results, unrealistic assumptions, or simply the lack of proper methodology for historical data analysis [10, 11].
Thus, the motivation of this work is to deliver a clear, specific, evidence-supported, realistic, and reproducible practical trading model with concrete parameters that can be applied by all tiers of Forex traders.
II Background
II-A Definitions
Foreign Exchange (Forex)
The Foreign Exchange is a global market in which national currencies and some commodities are exchanged [1].
Forex Instrument (Forex Pair)
Forex Instrument is a pair of equities, which are either currencies (e.g. U.S. Dollar) or commodities (e.g., gold). For example, the pair EUR/USD is a Forex instrument for trading U.S. Dollars for Euros and vice versa. Some examples of Forex instruments are given in Table I. The taxonomy of Forex pairs includes several types, such as major pair or cross pair, but they are all traded in the same manner.
Pip
Pip is a small unit of price movement (change) in the Forex market. The value of one pip is different depending on the instrument. For EUR/USD 1 pip = 0.0001, for USD/JPY and EUR/JPY, 1 pip = 0.01.
| Instrument | Description | Type |
|---|---|---|
| EUR/USD | Euro/U.S. Dollar | major pair |
| USD/JPY | U.S. Dollar/Japanese Yen | major pair |
| EUR/JPY | Euro/Japanese Yen | cross pair |
| GBP/AUD | Pound Sterling/Australian Dollar | cross pair |
| NZD/CAD | New Zealand Dollar/Canadian Dollar | cross pair |
| XAU/USD | Gold/U.S. Dollar | commodity |
| XAG/USD | Silver/U.S. Dollar | commodity |
Long trade
The Forex market allows two trade directions: buying and selling. The buying trade is commonly called a long trade.
Short trade
The Forex market allows to submit a selling trade even if there is no active buying trade; for a trader it may be perceived as betting on a downward price trend or as a reverse trade. Regardless of the trader’s perception, the selling trade is commonly called a short trade.
II-B Spread
Many Forex brokers do not charge any direct per-trade commission. Instead, they establish a difference between the buying price (called the ask price, denoted ) and the selling price (called bid price, denoted ). Then the spread of a broker for an instrument , denoted , is defined as follows111In some literature, the spread is represented as a negative value. We use the absolute value notation to emphasize the simple fact of the difference, regardless of its sign.:
II-C Margin trading
In most days when the market is open, the Forex prices experience only minor fluctuations, which would require traders to make very large deposits in order to gain a feasible profit. In order to make price movement more influential, most Forex brokers allow for margin trading, in which the broker lends the client an amount of money , called the margin, which is times greater than the actual deposit , thus:
The value , usually denoted , e.g., 1:50, is called the leverage. Most Forex brokers in the United States offer the 1:50 leverage.
II-D OHLC Candlestick Data
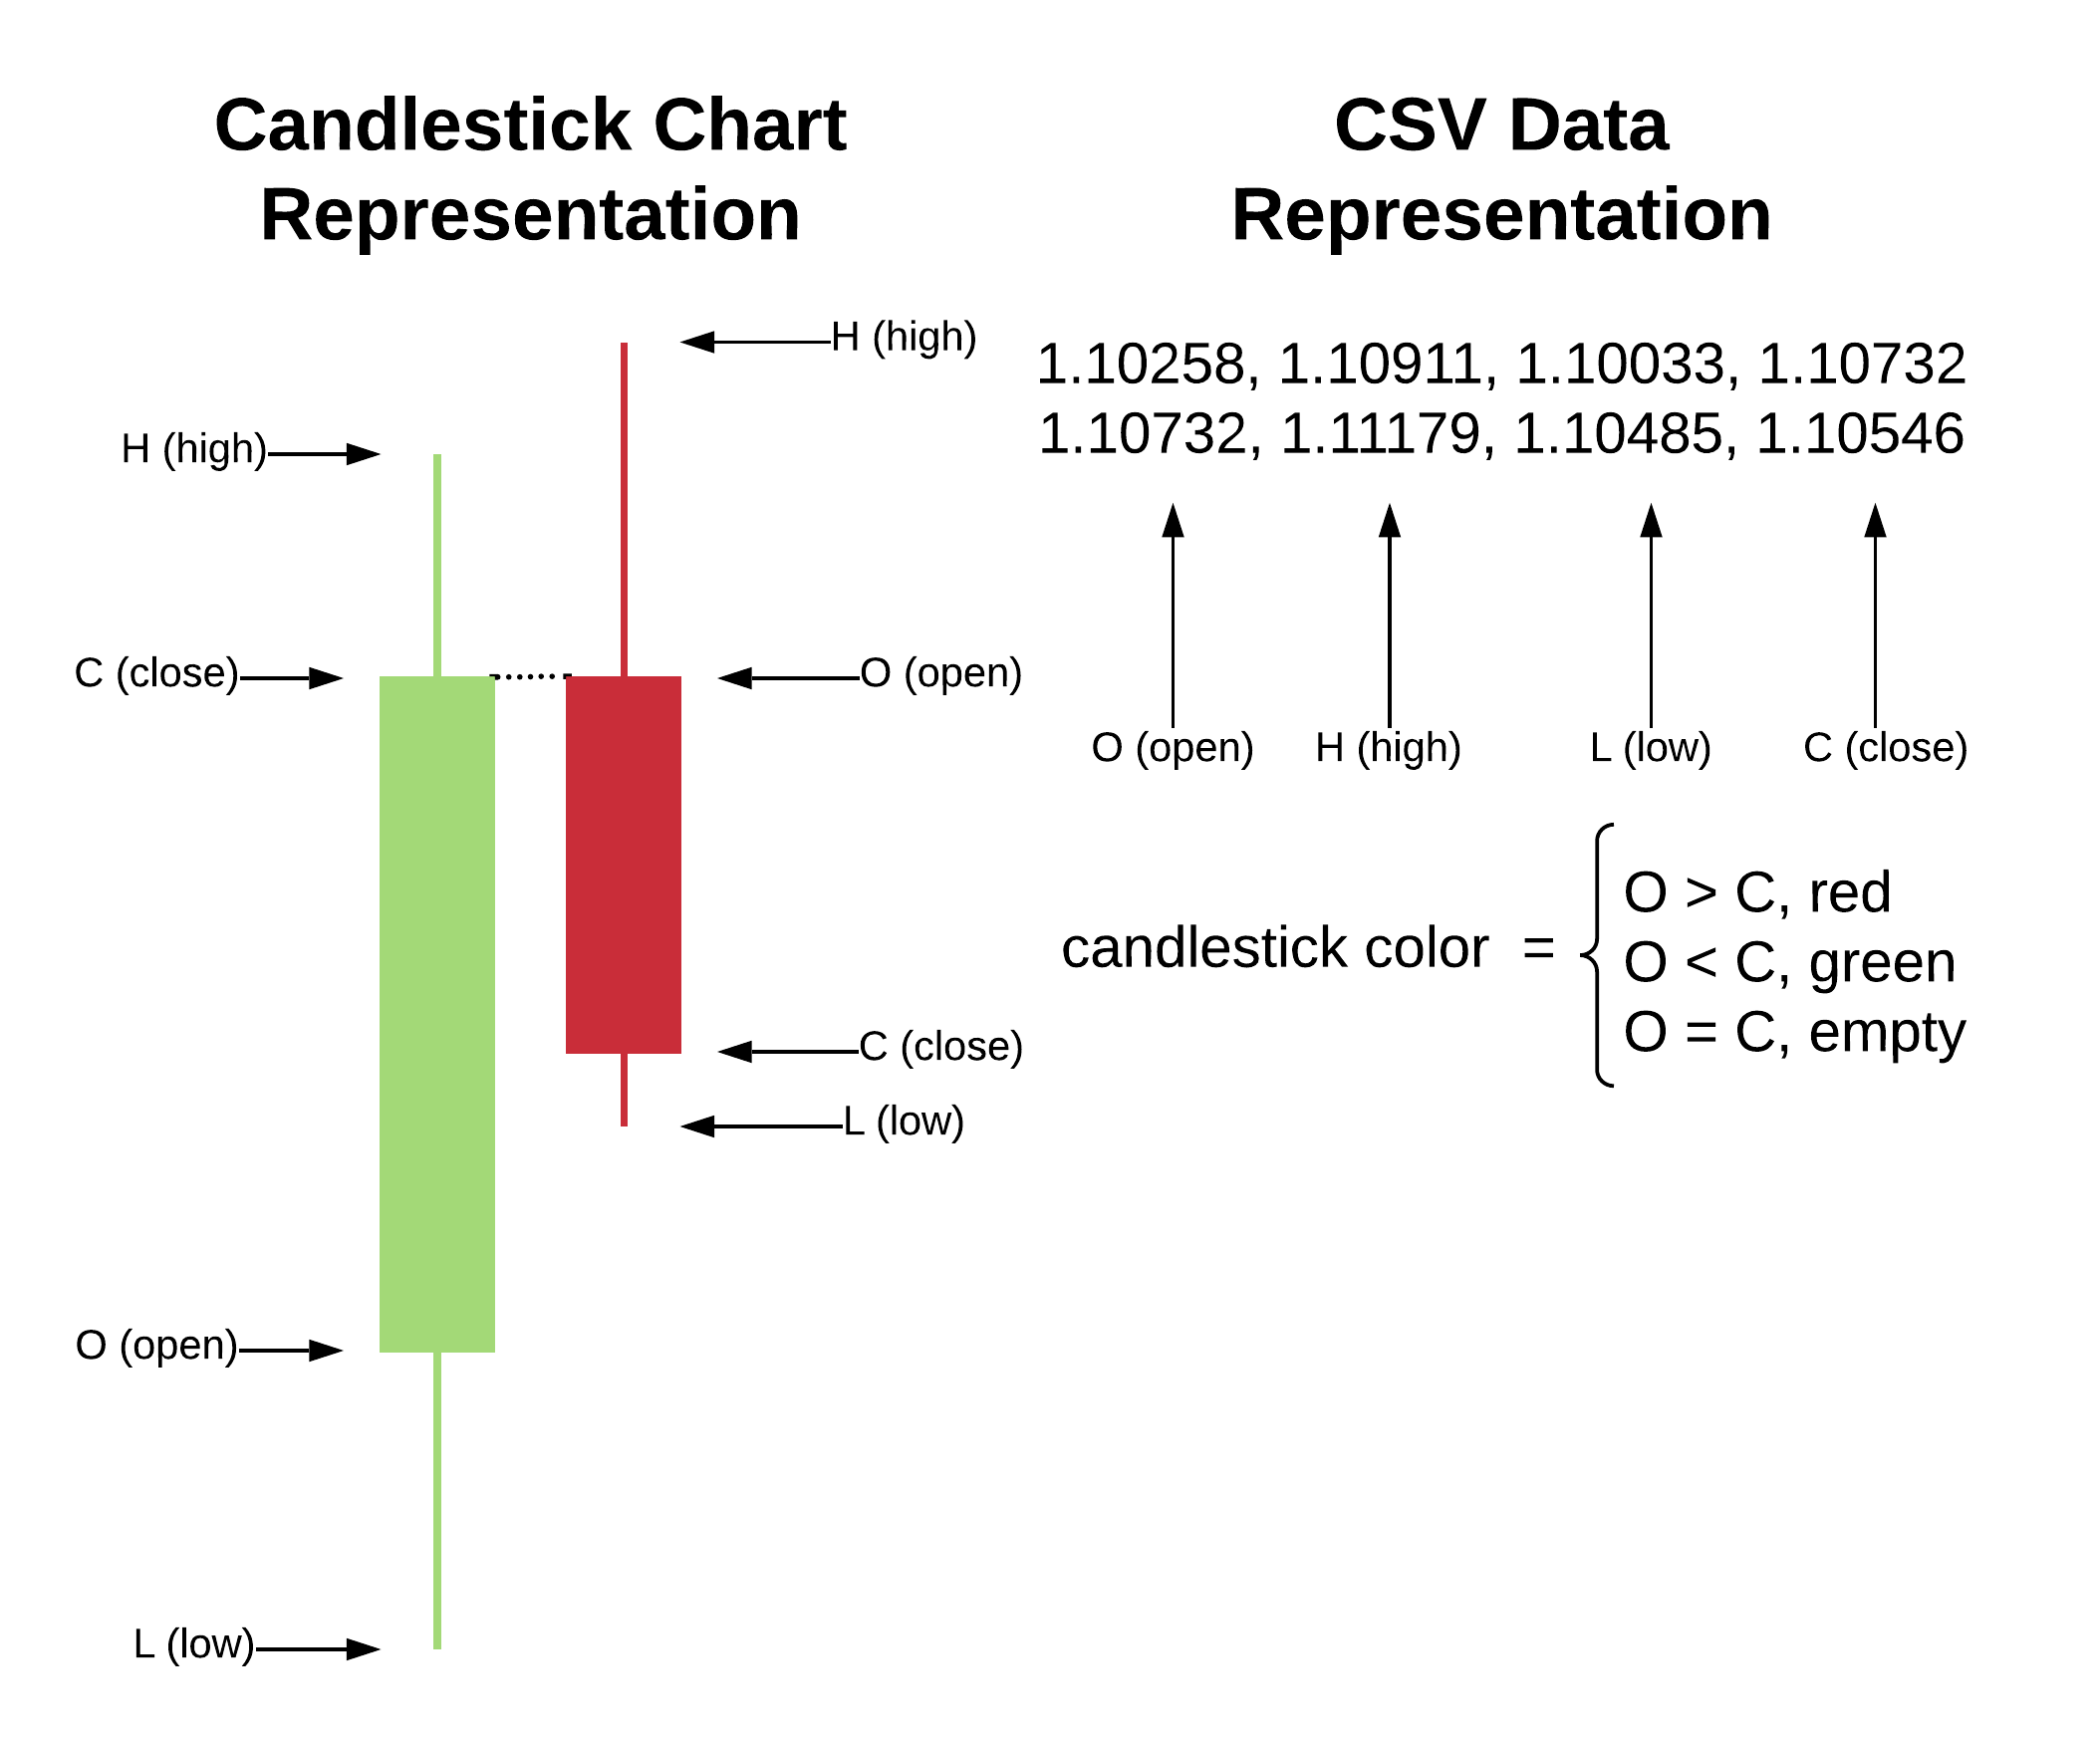
The raw Forex price data is usually provided by a broker in the form of a series of ticks. Each instrument has its own stream of ticks, and each tick includes a timestamp, bid price, ask price, and an optional trade volume data. Depending on the broker and its API, the period between ticks can vary between 50 ms to several seconds. The tick data is necessary for trading, but in most cases it is overwhelmingly excessive for a technical analysis. Thus, a more analysis-friendly cmopressed form, called OHLC candlestick data, is commonly used in most markets, including Forex.
OHLC (Open, High, Low, Close) data is a set of points, called OHLC candles, OHLC candlesticks, or OHLC ticks, summarizing the price movement during a fixed period of time using four parameters: 1) price at the beginning of the period (O); 2) maximum price during the period (H); 3) minimum price during the period (L); and 4) the price at the end of the period (C). Figure 1 demonstrates the chart and CSV representations of OHLC data. The period of time that one candle spans in a data set is called the OHLC granularity. Common OHLC granularities for the Forex market are: M1 (1 minute), M2 (2 minutes), M5 (5 minutes), M10 (10 minutes), M15 (15 minutes), M30 (30 minutes), H1 (1 hour), H2 (2 hours), H4 (4 hours), H8 (8 hours), H12 (12 hours), D1 (one day), W1 (one week), and MN (one month).
II-E Forex Analysis
The goal of a the Forex analysis is to predict the future movement of the price and identify trading opportunities. There are two major types of the market analysis: a) the fundamental analysis and b) the technical analysis. The fundamental analysis uses economic, political, and other news data to predict the future behavior of the market. The technical analysis uses present and past movement of the market price to infer the future move of the price, regardless of any outside (fundamental) events. Many traders also use various combinations of the fundamental and technical analyses. The technical analysis may be based on heuristic functions called technical indicators, or it can be based solely on the past and present values of the price. The latter case is called the price-action. SmartFX focuses on the pure price-action technical analysis only.
III Related Work
III-A Research
Automated Forex exchange trading is a popular topic among peer-reviewed studies [12, 4, 3, 13, 14, 15]. In the last two decades, many studies have been conducted on different aspects of foreign exchange technical indicators [16, 4, 3, 13, 14, 15]. Many patents have been filed for automatic Forex trading systems [17, 18, 19, 20, 21]. Also, the Artificial Intelligence and Machine Learning has been used for price prediction of the Foreign Exchange market [22, 23, 24, 25, 3, 26, 27].
However, the number of combinations of possible settings, as well as the abundance of pre-existing constraints for Forex automated trading is virtually infinite. As the number of constraints is growing, the necessity to employ the methods of Artificial Intelligence and Machine Learning becomes an urgent necessity because the space and time complexity of a brute-force trial exceeds storage and computational abilities of existing computers. To the best of my knowledge, none of the existing studies delivers a complete set of trading parameters for automated or semi-automated Forex trading with low equity and other parameters representing a non-institutional trader.
III-B Trading Heuristics
Most popular heuristics for technical analysis are technical indicators [7]. For example, one of the largest Forex brokers in the United States, GAIN Capital Group LLC [28], provides 75 classes of technical indicators as part of its Web Trading Platform 222https://webtrader.forex.com/workspaces/default.
III-C Retrospective Simulation
The retrospective simulation of Forex trading is a software-based processing of historical Forex price data, using a given trade model and a set of heuristics. There is a number of software trade simulators available on the market, such as MetaTrader333https://www.metatrader4.com/en, NinjaTrader444https://ninjatrader.com/Simulate, Forex Tester555https://forextester.com/, Soft4Fx666https://soft4fx.com/, fxSimulator777https://fxsimulator.com/, and others. All these tools allow to test a given strategy, automatically or manually, using a historical data. However, to the best of my knowledge, none of these tools is capable of calculating the most optimal strategy, which is the main goal of SmartFX.
III-D Other Works
There are multiple books written on the topic of Forex trading optimization. The ”forex trading” search result at the Book Department of Amazon web store returns more than 6,000 results888https://www.amazon.com/s?k=forex+trading. The same search request on a popular platform for online video courses, Udemy, returns 3,934 results999https://www.udemy.com/courses/search/?src=ukw&q=forex%20trading.
IV Pre-Evaluation
IV-A Inconsistency of Technical Indicators
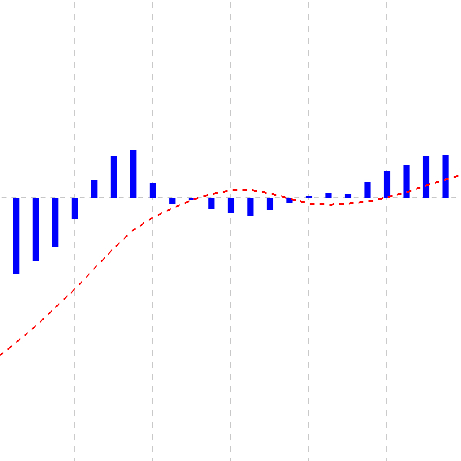
Moving Average Convergence/Divergence (MACD) is one of the most popular technical indicators among Forex traders [3]. However, different data sets and different trading tools reveal significant differences between the actual values of popular technical indicators, and this is easily demonstrable by comparing the charts of MACD for the same instrument with the same OHLC granularity within the same time frame, with time zone differences properly synchronized.
For this experiment, we observe four charts of the MACD technical indicator, produced by different trade tools with the same parameters (fast MA: 12, slow MA: 26, length: 9) generated for 24 OHLC H1 candlesticks representing the Forex price during November 28, 2019 EST, accounting for the differences in time zones101010Two out of four data sets used the GMT time zone, which was shifted to match the EST time zone.. As we can see in Figure 2, there is a significant differences between the MACD indicators with the same parameters over the same time period. One reason for such a discrepancy may be the fact that November 28, 2019 was the Thanksgiving Day in the United States, during which the trading activity is very low, whereas in most other countries it was just a regular business day, resulting in Forex activity difference in brokers from different regions (which has some effect upon the price). Regardless of the reason, the experiment demonstrated that there was at least one day, during which MACD showed significantly different results for different brokers.
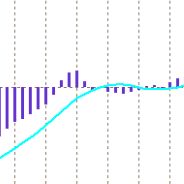
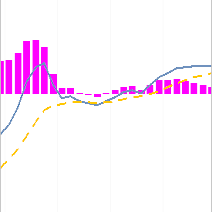
(a) Forex.com/MT4 (b) Dukascopy Demo/JForex
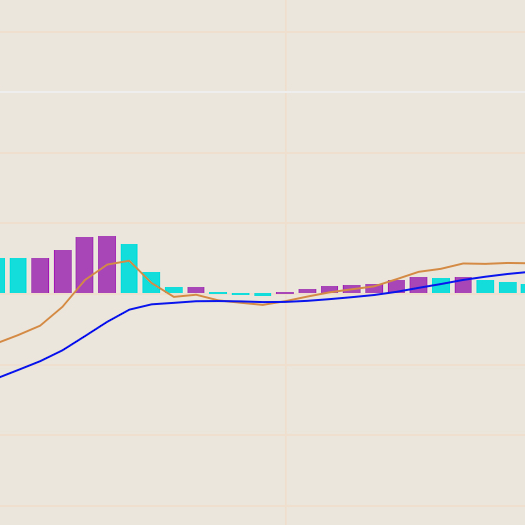
(c) Oanda/iOS (d) Metaquotes Demo/MT5 iOS
IV-B Trade Opportunities Rate Reduction
In this work, we propose a price-action trade model, in which every OHLC candle, upon its closure time, delivers a new trade signal. For example, for the H1 OHLC granularity, the number of trading signals per day is 24. In other words, in SmartFX the signal period is constant and equal to the granularity :
When the trade signals come from traditional technical indicators, the trade signal period is variable, and presumably many times larger than . In order to demonstrate this, we conducted a short experiment, in which we counted the number of possible configurations for MACD and RSI technical indicators that can be treated as signals over one month of historical Forex data (November 2019, EUR/USD) with OHLC granularity H1. Table II shows the results of this experiment.
| Heuristic | Heuristic Parameters |
|
|||
|---|---|---|---|---|---|
| MACD |
|
55 | |||
| RSI | Length: 14 | 64 | |||
| SmartFX | N/A | 480 |
Let us show that on average the technical indicators produce less trade signals than SmartFX. Suppose that there is a set of parameters for a traditional technical indicator , which is twice as more successful than SmartFX (with the same take-profit/stop-loss settings), and which also produces twice as more trade signals than RSI-14. Then, if the average proportion of successful trades for SmartFX is , then the number of successful trades per month for SmartFX will be as follows:
Whereas the number of successful trades for the hypothetical indicator will be as follows:
As it is seen from the experiment, even with unrealistically optimistic assumptions, . And therefore it is fair to conclude that even if the traditional technical indicators have higher rate of successful signals, the decreased overall number of trading opportunities yields a lower overall profit compared to per-candle price action.
V SmartFX Design
Figure 3 demonstrates the basic design of SmartFX. The market data, which is described in detail in Section VII, is being pre-processed to facilitate the performance of the simulation. Specifically, the market data is being saved twice in two different data structures: hash table and serial list. This allows to reduce the processing time because the latter is the system’s performance bottleneck.
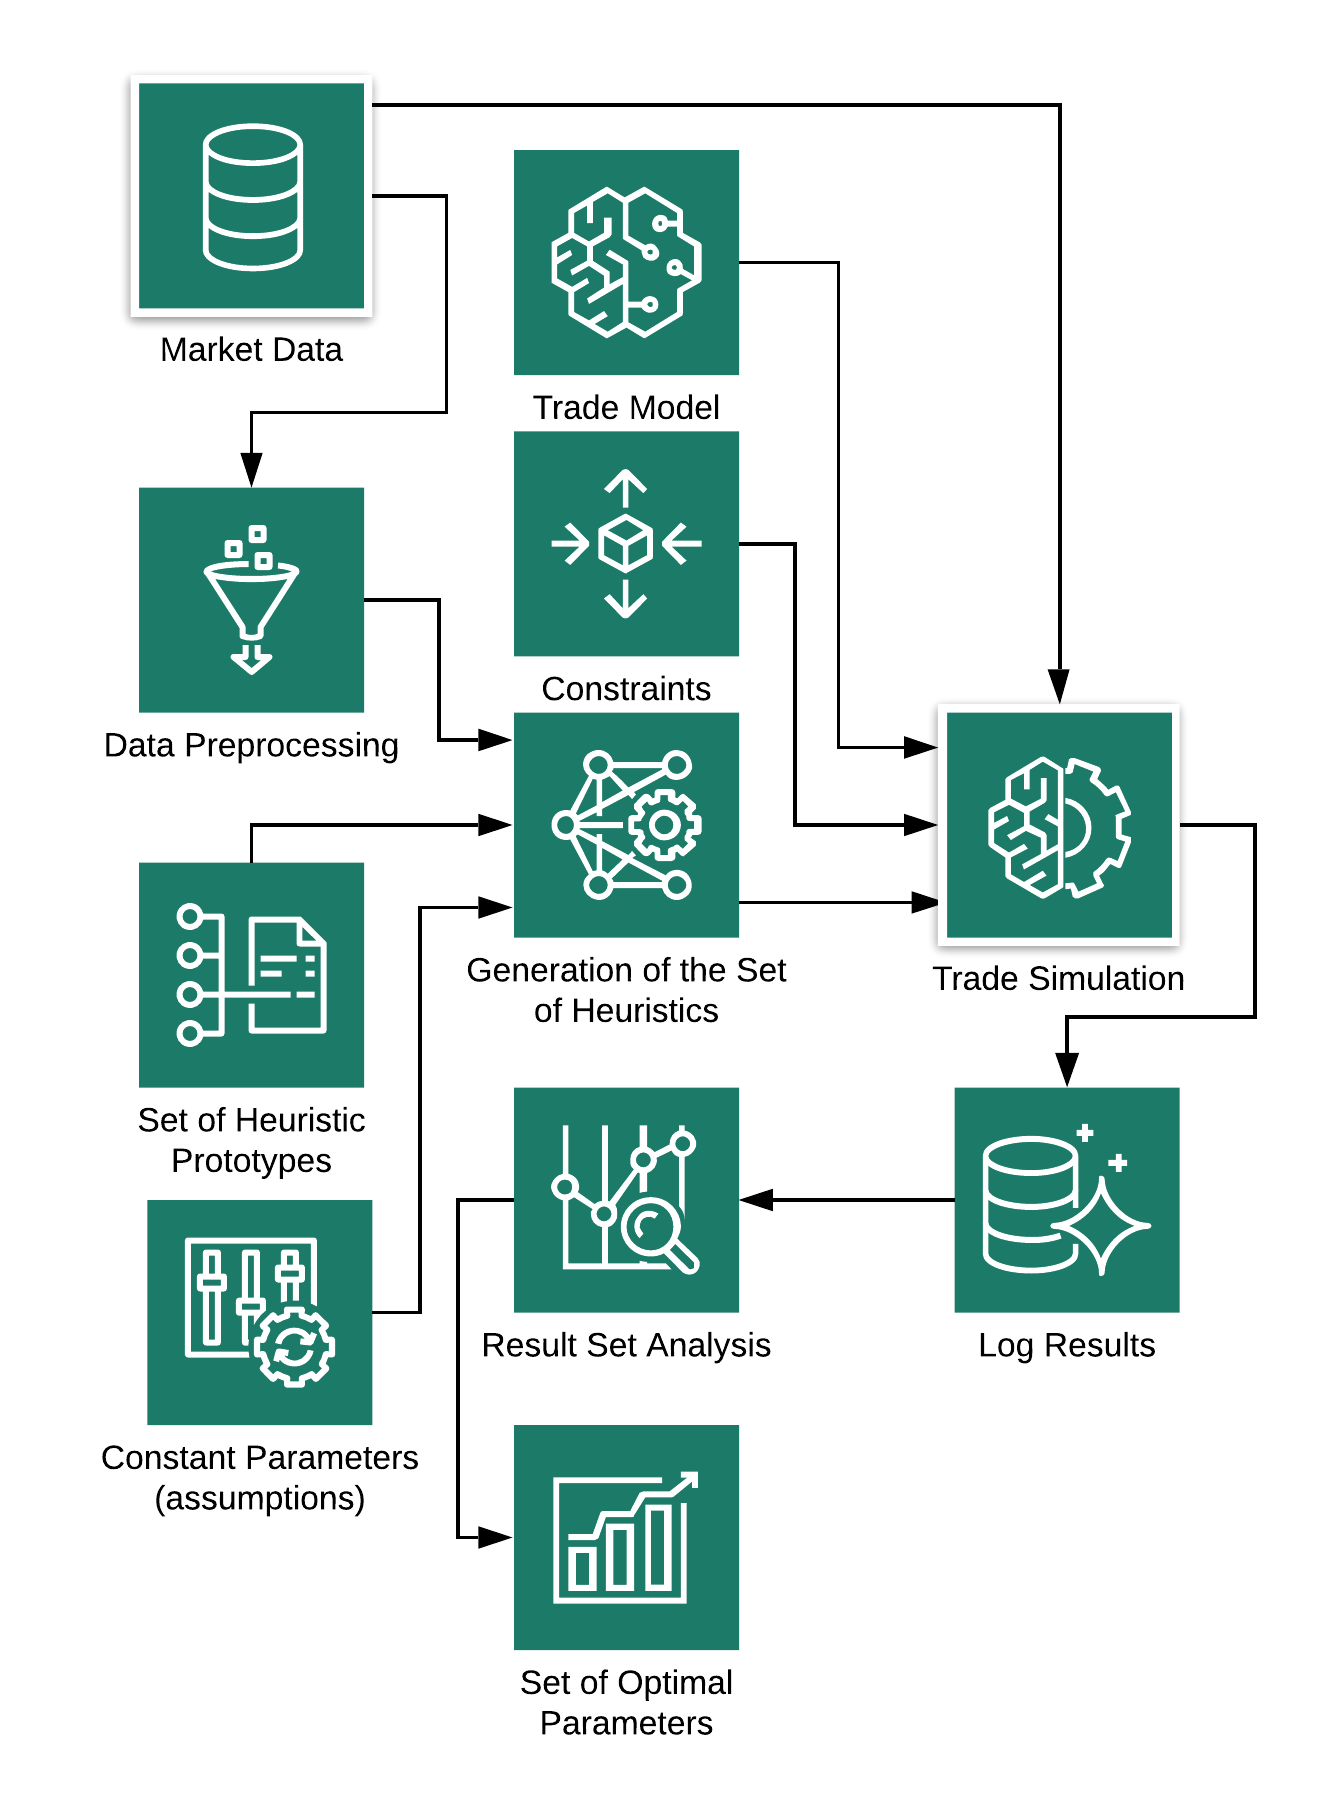
The pre-processed market data goes to the generator of the set of heuristics, along with the set of heuristic prototypes and constant parameters (or assumptions). The two heuristic prototypes are presented in Algorithm 1 and Algorithm 2. The constant parameters include: maximum total loss allowed in pips, maximum take profit, maximum stop loss, take profit and stop loss steps, and the broker’s spread.
The fist heuristic prototype, called the trend continuation heuristic, denoted as , simply signals a long trade at the end of a “green” candle period, and it signals the short trade otherwise. The second heuristic prototype, called the trend reversal heuristic, denoted as , signals a short trade at the end of a “green” candle period, and it signals a long trade otherwise. It is important to note that in order to avoid risks, only one trade at a time can be placed in SmartFX model.
When the set of heuristics is generated, they go to the trade simulation algorithm along with the trade model (which represents the rules of the Forex market) and the set of constraints (which represents the parameters of a Forex trader). The trade model, constraints, and the set of heuristics are the same for each subset of the market data. The subsets of market data are formed by combining all the given instruments with all the given OHLC granularities. Each subset of data can be independently processed by the trade simulation algorithm, thus this algorithm can be run in a multi-threaded environment.
Each simulation thread maintains its own log of results, which is analyzed to determine the set of optimal parameters. Then the sets of all optimal parameters for each subset of the market data are processed manually in a spreadsheet software.
VI SmartFX Implementation
SmartFX is a multi-threaded open-source tool written in Java, totalling 859 lines of code. The value of spread is fixed and set to 2.0 pips. The software performs data preprocessing and generation of heuristics in a linear fashion. However, the most computation-consuming part, the trade simulation learning, is performed in a dedicated thread for each subset of the market data.
The range of the values of the stop loss (SL) parameter is set to [3,50]. The same range is used for the take profit (TP) parameter, accounting for 2,209 distinct tuples. We stochastically determined that the largest ranges are not likely to yield any combinations with better efficiency. Moreover, higher values of TP reduce the number of trades, whereas larger value of SL increases the risk of unexpected large loss of profit.
VII Data Set
We use 18 subsets of historical Forex data from the Dukascopy Swiss Banking Group data set111111https://www.dukascopy.com/swiss/english/marketwatch/historical/. The subsets are tuples , where is a Forex instrument, and is a granularity, such that:
Each subset is stored in a comma-separated value (CSV) data file. Each CSV entry includes the OHLC candlestick data. The entries also include the trade volume data, but this parameter is ignored by SmartFX.
SmartFX records the following parameters for each of the 36 runs (18 subsets of market data processed with each of the two heuristic prototypes) during the learning simulation: a) total profit in pips; b) total loss in pips; c) heuristic used; d) take profit (TP) policy simulated; e) stop loss (SL) policy simulated; f) number of long trades; g) number of short trades; h) Forex instrument; and i) granularity of OHLC data.
VIII Evaluation
VIII-A Setup and Run
We used a Dell PowerEdge T640 server with two Intel Xeon Gold 5218 processors and 200 GB of RAM, running Ubuntu 18.04.03 LTS. The SmartFX tool was executed in two separate processes, each running 18 threads (36 threads total). The first process was resposible for the heuristic , and the second process was responsible for the heuristic . The choice to run the tool in two multi-threaded processes was determined by implementation convenience, and was not intended to achieve any performance improvement. The length of the entire cycle for all data subsets took about two hours.
VIII-B Results
The raw results of SmartFX execution are recorded in the Appendices, and below are the most essential summaries and explanations.
VIII-B1 Worst Performers
Table III presents the four worst 10-year balances. It is important to note that these cases are worst compared to other cases, but they are best cases locally. For example, the first row indicates that the best combination of take profit and stop loss values for the EUR/JPY instrument for OHLC H2 granularity and trade continuation heuristic could maximize the ending balance only to the value of -75,380 pips. As we can see, all the four worst performers use the trend continuation heuristic prototype. The performance of the two heuristic prototypes is discussed later in this section.
| Instrument | Period | Heuristic | 10-year Balance (pips) |
|---|---|---|---|
| EUR/JPY | H2 | -75,380 | |
| EUR/JPY | H4 | -41,338 | |
| EUR/USD | H4 | -39,953 | |
| EUR/USD | H2 | -29,397 |
VIII-B2 Best Performers
The best four performers, shown in Table IV, all use the trend reversal heuristic prototype. Also, the best four performance have finer OHLC granularities than the four worst performing cases. As we can see from the table, the SmartFX model can deliver on average up to 118 pips of profit. The performance of the two heuristics is discussed in later in this section.
| Instrument | Period | Heuristic |
|
|
||||
|---|---|---|---|---|---|---|---|---|
| EUR/JPY | H1 | h2 | 432,192 | 118.31 | ||||
| EUR/USD | H1 | h2 | 348,611 | 95.43 | ||||
| EUR/JPY | H2 | h2 | 302,022 | 82.68 | ||||
| USD/JPY | H1 | h2 | 293,121 | 80.24 |
VIII-B3 Number of Trades
Table V summarizes the number of trades statistics among the top 4 performers discussed before in this section. We are interested in the number of trades only for top performers because they are the ones to be used in real trades. However, the information about the number of trades for the remaining cases is available in Appendix -C.
| Average among the top four performers | Value | |
|---|---|---|
| Number of trades over 10 years | 48,078 | 12,641 |
| Average number of trades per day | 13.16 | — |
VIII-B4 Heuristics Performance
The best possible performance of the two heuristics is summarized in Table VI. As we can see, the performance of the trend reversal heuristic is much better than of the trend continuation one. Also, we observe smaller average number of trades for the trend continuation heuristic. It is also worth mentioning that, as it is seen in Table VIII, among all the 21 cases with positive final balances, only three are produced by the trend continuation heuristic, and all these cases are among bottom five performers with positive balances.
|
|
|
|||||||
|---|---|---|---|---|---|---|---|---|---|
| -10,574 | 15,101 | 13,997 | |||||||
| 186,869 | 19,007 | 18,399 |
VIII-B5 Optimal TP/SL Settings
Table VII is the culmination of this research, delivering the set of optimal trading settings that allows to achieve the best profit results.
| Instrument | Period |
|
|
||||
|---|---|---|---|---|---|---|---|
| EUR/JPY | H1 | 3 | 14 | ||||
| EUR/USD | H1 | 3 | 11 | ||||
| EUR/JPY | H2 | 3 | 20 | ||||
| USD/JPY | H1 | 3 | 9 | ||||
| EUR/USD | H2 | 3 | 16 | ||||
| EUR/JPY | H4 | 3 | 28 | ||||
| USD/JPY | H2 | 3 | 13 |
IX Discussion
SmartFX is purposefully designed to be broker-agnostic, which allows to develop trading setups that are universally applicable to diverse trading environments. However, this decision comes at a cost of the necessity to specify a fixed spread value, whereas many Forex brokers use floating spread policy. As a result, the user of SmartFX must specify the spread that is large enough. Although the static spread value does not compromise the quality of the result produced by SmartFX, the parameter must be chosen carefully in order to avoid overly optimistic scenarios.
X Conclusion
Market trading optimization is a popular application of Artificial Intelligence (AI), delivering endless opportunities for research and profound insights. The Forex market is often being chosen as a target environment because it allows unlimited spread-based day trading without additional fees, long market hours, and easy entrance requirements. In this research, we demonstrated that popular technical indicators may be ambiguous and less optimal for automated trading. We developed SmartFX, an automated constraint-based machine learning tool that determines optimal parameters for given heuristic prototypes.
We evaluated 10 years worth of market data for 3 popular Forex instruments using two simple price-action heuristic prototypes, along with 6 different OHLC granularities of the input data. The results clearly demonstrated that the trade reversal price-action heuristic is significantly more profitable than the trade continuation, and capable of delivering up to 118 pips of profit per day on average. We determined exact trading parameters for the optimal trade, and thus achieved the goal of this research: to deliver practically working, specific and evidence-based optimal trade parameters for price-action Forex trading. We make SmartFX available under an open source license for everyone to use, evaluate, and build upon.
References
- [1] D. Hudson, “Foreign exchange market,” Encyclopædia Britannica, 2017, accessed: 2019-12-07.
- [2] G. F. Thompson, “Time, trading and algorithms in financial sector security,” New Political Economy, vol. 22, no. 1, pp. 1–11, 2017.
- [3] S. H. M. Yazdi and Z. H. Lashkari, “Technical analysis of forex by macd indicator,” International Journal of Humanities and Management Sciences (IJHMS), vol. 1, no. 2, pp. 159–165, 2013.
- [4] Z. Liu and D. Xiao, “An automated trading system with multi-indicator fusion based on d-s evidence theory in forex market,” in 2009 Sixth International Conference on Fuzzy Systems and Knowledge Discovery, vol. 3, Aug 2009, pp. 239–243.
- [5] R. Krishnan and S. S. Menon, “Impact of currency pairs, time frames and technical indicators on trading profit in forex spot market.” International journal of Business insights & Transformation, vol. 2, no. 2, 2009.
- [6] Y. L. Yong, D. C. Ngo, and Y. Lee, “Technical indicators for forex forecasting: a preliminary study,” in International Conference in Swarm Intelligence. Springer, 2015, pp. 87–97.
- [7] M. Ozturk, I. H. Toroslu, and G. Fidan, “Heuristic based trading system on forex data using technical indicator rules,” Applied Soft Computing, vol. 43, pp. 170–186, 2016.
- [8] S. H. M. Yazdi and Z. H. LASHKARI, “Technical analysis of forex by parabolic sar indicator,” in International Islamic Accounting and Finance Conference, 2012.
- [9] H. Ni and H. Yin, “Exchange rate prediction using hybrid neural networks and trading indicators,” Neurocomputing, vol. 72, no. 13-15, pp. 2815–2823, 2009.
- [10] P. Rosenstreich, Forex Revolution: An Insider’s Guide to the Real World of Foreign Exchange Trading. FT Press, 2005.
- [11] T. S. Guides, “Personality strengths and weaknesses in forex trading,” 2017.
- [12] R. F. de Brito and A. L. Oliveira, “Comparative study of forex trading systems built with svr+ ghsom and genetic algorithms optimization of technical indicators,” in 2012 IEEE 24th International Conference on Tools with Artificial Intelligence, vol. 1. IEEE, 2012, pp. 351–358.
- [13] T. Ploysuwan and R. Chaisricharoen, “Gaussian process kernel crossover for automated forex trading system,” in 2017 14th International Conference on Electrical Engineering/Electronics, Computer, Telecommunications and Information Technology (ECTI-CON), June 2017, pp. 802–805.
- [14] G. Wilson and W. Banzhaf, “Interday foreign exchange trading using linear genetic programming,” in Proceedings of the 12th annual conference on Genetic and evolutionary computation. ACM, 2010, pp. 1139–1146.
- [15] R. M. C. Pinto and J. C. M. Silva, “Strategic methods for automated trading in forex,” in 2012 12th International Conference on Intelligent Systems Design and Applications (ISDA). IEEE, 2012, pp. 34–39.
- [16] D. Vezeris, I. Karkanis, and T. Kyrgos, “Adturtle: An advanced turtle trading system,” Journal of Risk and Financial Management, vol. 12, no. 2, p. 96, 2019.
- [17] J. E. Schoen, “Automated trading system,” Jan. 4 2011, uS Patent 7,865,421.
- [18] J. Chait, “Foreign exchange trading platform,” Feb. 22 2007, uS Patent App. 11/451,731.
- [19] A. Peterson, L. Miller, I. Eaglesfield, S. Hubble, M. LeGelebart, T. Sablic, R. Sagurton, E. Theodorou, W. Wah, A. Zhou et al., “Foreign exchange trading interface,” Mar. 17 2005, uS Patent App. 10/884,111.
- [20] D. Ogg, W. Lamartin, and M. Smith, “Automated system for routing orders for foreign exchange transactions,” Nov. 3 2005, uS Patent App. 10/834,812.
- [21] J. Owens and C. Awtry, “Automated trading system and software for financial markets,” Dec. 22 2005, uS Patent App. 11/156,428.
- [22] A. Abraham and M. U. Chowdhury, “An intelligent forex monitoring system,” in 2001 International Conferences on Info-Tech and Info-Net. Proceedings (Cat. No.01EX479), vol. 3, Oct 2001, pp. 523–528 vol.3.
- [23] A. Abraham and M. U. Chowdhury, “An intelligent forex monitoring system,” in 2001 International Conferences on Info-Tech and Info-Net. Proceedings (Cat. No. 01EX479), vol. 3. IEEE, 2001, pp. 523–528.
- [24] P. Czekalski, M. Niezabitowski, and R. Styblinski, “Ann for forex forecasting and trading,” in 2015 20th International Conference on Control Systems and Computer Science. IEEE, 2015, pp. 322–328.
- [25] Y. Lee, L. C. O. Tiong, and D. C. L. Ngo, “Hidden markov models for forex trends prediction,” in 2014 International Conference on Information Science & Applications (ICISA). IEEE, 2014, pp. 1–4.
- [26] R. P. Barbosa and O. Belo, “Multi-agent forex trading system,” in Agent and multi-agent technology for internet and enterprise systems. Springer, 2010, pp. 91–118.
- [27] N. Shahbazi, M. Memarzadeh, and J. Gryz, “Forex market prediction using narx neural network with bagging,” in MATEC Web of Conferences, vol. 68. EDP Sciences, 2016, p. 19001.
- [28] I. Macerinskiene and A. Balciunas, “The evidence of social responsibility in foreign exchange brokers’ activities,” Procedia-Social and Behavioral Sciences, vol. 213, pp. 552–556, 2015.
-A Resulting Balances
Table VIII shows the full list of ending balances for each of the learning simulation cases. The column Reverse represents the heuristic: if it is , is used, otherwise, is used. Depending on the instrument, the multiplier for determining the number of pips in the third column is either or .
| Instrument | Balance | Balance in Pips | Reversal |
|---|---|---|---|
| EURJPY-H1 | 4321.923 | 432192.3 | TRUE |
| EURUSD-H1 | 34.86112 | 348611.2 | TRUE |
| EURJPY-H2 | 3020.2202 | 302022.02 | TRUE |
| USDJPY-H1 | 2941.217 | 294121.7 | TRUE |
| EURUSD-H2 | 23.923656 | 239236.56 | TRUE |
| EURJPY-H4 | 2191.7815 | 219178.15 | TRUE |
| USDJPY-H2 | 1984.1091 | 198410.91 | TRUE |
| EURUSD-H4 | 17.544798 | 175447.98 | TRUE |
| EURJPY-H8 | 1635.9933 | 163599.33 | TRUE |
| EURJPY-H12 | 1460.575 | 146057.5 | TRUE |
| USDJPY-H4 | 1441.6462 | 144164.62 | TRUE |
| EURUSD-H8 | 12.996401 | 129964.01 | TRUE |
| EURUSD-H12 | 12.005339 | 120053.39 | TRUE |
| USDJPY-H8 | 1074.1615 | 107416.15 | TRUE |
| EURJPY-D1 | 963.3696 | 96336.96 | TRUE |
| USDJPY-H12 | 924.0237 | 92402.37 | TRUE |
| USDJPY-H1 | 872.2552 | 87225.52 | FALSE |
| EURUSD-D1 | 8.5002575 | 85002.575 | TRUE |
| USDJPY-D1 | 694.33014 | 69433.014 | TRUE |
| EURUSD-H1 | 5.1108055 | 51108.055 | FALSE |
| USDJPY-H2 | 183.90222 | 18390.222 | FALSE |
| EURJPY-H1 | -14.003174 | -1400.3174 | FALSE |
| EURJPY-D1 | -78.99794 | -7899.794 | FALSE |
| EURUSD-D1 | -0.8153805 | -8153.805 | FALSE |
| USDJPY-D1 | -81.747986 | -8174.7986 | FALSE |
| EURJPY-H12 | -148.27484 | -14827.484 | FALSE |
| EURUSD-H12 | -1.4840896 | -14840.896 | FALSE |
| USDJPY-H12 | -150.52483 | -15052.483 | FALSE |
| EURUSD-H8 | -2.1492684 | -21492.684 | FALSE |
| EURJPY-H8 | -215.3318 | -21533.18 | FALSE |
| USDJPY-H8 | -218.21217 | -21821.217 | FALSE |
| USDJPY-H4 | -257.88776 | -25788.776 | FALSE |
| EURUSD-H2 | -2.9397478 | -29397.478 | FALSE |
| EURUSD-H4 | -3.9952888 | -39952.888 | FALSE |
| EURJPY-H4 | -413.3832 | -41338.32 | FALSE |
| EURJPY-H2 | -753.8009 | -75380.09 | FALSE |
-B Stop Loss and Take Profit Configurations
Table IX contains the most optimal take profit and stop loss parameters for all simulation cases that ended up with positive balances. Recording the cases with negative balances was not necessary because, by all means, these cases cannot be defined as successful, and therefore the values of most optimal take profit and stop loss parameters are never practically useful.
| Simulation | SL | TP | Reverse |
|---|---|---|---|
| EURJPY-H1 | 0.1400 | 0.0300 | TRUE |
| EURUSD-H1 | 0.0011 | 0.0003 | TRUE |
| EURJPY-H2 | 0.2000 | 0.0300 | TRUE |
| USDJPY-H1 | 0.0900 | 0.0300 | TRUE |
| EURUSD-H2 | 0.0016 | 0.0003 | TRUE |
| EURJPY-H4 | 0.2800 | 0.0300 | TRUE |
| USDJPY-H2 | 0.1300 | 0.0300 | TRUE |
| EURUSD-H4 | 0.0024 | 0.0003 | TRUE |
| EURJPY-H8 | 0.4500 | 0.0300 | TRUE |
| EURJPY-H12 | 0.4800 | 0.0300 | TRUE |
| USDJPY-H4 | 0.1800 | 0.0300 | TRUE |
| EURUSD-H8 | 0.0038 | 0.0003 | TRUE |
| EURUSD-H12 | 0.0047 | 0.0003 | TRUE |
| USDJPY-H8 | 0.2700 | 0.0300 | TRUE |
| EURJPY-D1 | 0.5000 | 0.0300 | TRUE |
| USDJPY-H12 | 0.3500 | 0.0300 | TRUE |
| USDJPY-H1 | 0.0300 | 0.5000 | FALSE |
| EURUSD-D1 | 0.0050 | 0.0003 | TRUE |
| USDJPY-D1 | 0.5000 | 0.0300 | TRUE |
| EURUSD-H1 | 0.0004 | 0.0050 | FALSE |
| USDJPY-H2 | 0.0600 | 0.5000 | FALSE |
-C Number of Trades
Table X contains total number of trades for ten years, and also a calculated value of an average number of trades expected per one day, which is simply the number in the second column divided by An important note about the days when the market is closed: normally, during these days there are no trades, so, depending on what the result is used for, the number in the second column may be instead divided by .
| Simulation | Number of Trades | Average Trades per Day |
|---|---|---|
| EURJPY-H1 | 56078 | 15.35 |
| EURUSD-H1 | 53299 | 14.59 |
| EURJPY-H2 | 29205 | 7.99 |
| USDJPY-H1 | 53729 | 14.71 |
| EURUSD-H2 | 27823 | 7.62 |
| EURJPY-H4 | 15318 | 4.19 |
| USDJPY-H2 | 28013 | 7.67 |
| EURUSD-H4 | 14670 | 4.02 |
| EURJPY-H8 | 7977 | 2.18 |
| EURJPY-H12 | 5594 | 1.53 |
| USDJPY-H4 | 14838 | 4.06 |
| EURUSD-H8 | 7821 | 2.14 |
| EURUSD-H12 | 5515 | 1.51 |
| USDJPY-H8 | 7786 | 2.13 |
| EURJPY-D1 | 3062 | 0.84 |
| USDJPY-H12 | 5425 | 1.49 |
| USDJPY-H1 | 48709 | 13.33 |
| EURUSD-D1 | 3007 | 0.82 |
| USDJPY-D1 | 2967 | 0.81 |
| EURUSD-H1 | 43709 | 11.97 |
| USDJPY-H2 | 18504 | 5.07 |
| EURJPY-H1 | 37402 | 10.24 |
| EURJPY-D1 | 3123 | 0.85 |
| EURUSD-D1 | 3126 | 0.86 |
| USDJPY-D1 | 3118 | 0.85 |
| EURJPY-H12 | 5714 | 1.56 |
| EURUSD-H12 | 5723 | 1.57 |
| USDJPY-H12 | 5711 | 1.56 |
| EURUSD-H8 | 8314 | 2.28 |
| EURJPY-H8 | 8314 | 2.28 |
| USDJPY-H8 | 8300 | 2.27 |
| USDJPY-H4 | 9440 | 2.58 |
| EURUSD-H2 | 13397 | 3.67 |
| EURUSD-H4 | 16087 | 4.40 |
| EURJPY-H4 | 16096 | 4.41 |
| EURJPY-H2 | 17044 | 4.67 |