Online Hate: Behavioural Dynamics and Relationship with Misinformation
Abstract
Online debates are often characterised by extreme polarisation and heated discussions among users. The presence of hate speech online is becoming increasingly problematic, making necessary the development of appropriate countermeasures. In this work, we perform hate speech detection on a corpus of more than one million comments on YouTube videos through a machine learning model fine-tuned on a large set of hand-annotated data. Our analysis shows that there is no evidence of the presence of “serial haters”, intended as active users posting exclusively hateful comments. Moreover, coherently with the echo chamber hypothesis, we find that users skewed towards one of the two categories of video channels (questionable, reliable) are more prone to use inappropriate, violent, or hateful language within their opponents community. Interestingly, users loyal to reliable sources use on average a more toxic language than their counterpart. Finally, we find that the overall toxicity of the discussion increases with its length, measured both in terms of number of comments and time. Our results show that, coherently with Godwin’s law, online debates tend to degenerate towards increasingly toxic exchanges of views.
1 Introduction
Public debates on social media platforms are often heated and polarised [1, 2, 3]. Back in the 90s, Mike Godwin coined a theorem, today known as Godwin’s law, stating that “As an online discussion grows longer, the probability of a comparison involving Nazis or Hitler approaches to one”. More recently, with the advent of social media, an increasing number of people is reporting exposure to online hate speech [4], leading institutions and online platforms to investigate possible solutions and countermeasures [5]. To prevent and counter the spread of hate speech online, for example, the European Commission agreed with Facebook, Microsoft, Twitter, YouTube, Instagram, Snapchat, Dailymotion, Jeuxvideo.com, and TikTok a “Code of conduct on countering illegal hate speech online”111https://ec.europa.eu/newsroom/just/document.cfm?doc_id=42985. In addition to fuelling the toxicity of the online debate, hate speech may have severe offline consequences. Some researchers hypothesised a causal link between online hate and offline violence [6, 7, 8]. Furthermore, there is empirical evidence that online hate may induce fear of offline repercussions [9]. However, the detection and contrast of hate speech is complicated. There are still ambiguities in the very definition of hate speech, with academic and relevant stakeholders providing their own interpretation [4], including social media companies such as Facebook222https://www.facebook.com/communitystandards/introduction, Twitter333https://help.twitter.com/en/rules-and-policies/violent-groups, and YouTube444https://support.google.com/youtube/answer/2801939?hl=en&ref_topic=9282436.
Here we define hate speech as episodes in which a speaker/user threatens, indulges, desires, or calls for physical violence against a target (e.g., minorities) or calls, denies or glorifies war crimes and crimes against humanity. In other words, the notion of hate speech that we employ involves calls for violence against a target, in agreement with the literature and the regulators [4]. Furthermore, we look at inappropriate (e.g. profanity) and offensive language (e.g. dehumanisation, offensive remarks), which is not illegal, but deteriorates public discourse and can lead to a more radicalised society.
In this work, we analyse a corpus of more than one million comments on Italian YouTube videos related to COVID-19 to unveil the dynamics and trends of online hate. First, we manually annotate a large corpus of YouTube comments for hate speech and fine-tune a hate speech deep learning model to accurately detect it. Then, we apply the model to the entire corpus, aiming to characterise the behaviour of users producing hate, and shed light on the (possible) relationship between the consumption of misinformation and usage of hate and toxic language.
This work advances the current literature at different levels. There is a large body of literature about community-level hate speech [10, 11, 12]. However, less is known about the behavioural features of users using hate speech on mainstream social media platforms, with few recent exceptions for Twitter [13, 14] and Gab [12]. Furthermore, to our knowledge, the relationship between online hate and misinformation is yet to be explored. In this paper, we study hate speech with respect to a controversial and heated topic, i.e., Covid-19, which has been already analysed in terms of sinophobic attitudes [15]. We relax the assumption behind many community-based studies, for which every post produced within an online community hosting haters is hate [11, 16].
Instead, to cope with a classification task that involves more than one million comments, we annotate a high-quality dataset of more than 70,000 YouTube comments, which is used for training a deep learning model. The model is standard in the state-of-the-art and builds on a wide strand of literature using machine learning [17, 18, 19] and deep learning [20, 21, 22] for automatic classification of text and hate speech detection. Moreover, we distinguish YouTube channels into two categories: questionable, i.e., channels likely to disseminate misinformation, and reliable. This categorisation is in line with previous studies on the spreading of misinformation [23, 24, 25], and builds on a list of misinformation sources provided by the Italian Communications Regulatory Authority (AGCOM).
Our results show that hate speech on YouTube is slightly more present than on other social media platforms [26, 14] and that there are no significant differences between the proportions of hate speech detected in comments on videos from questionable and reliable channels. We also note that hate speech does not show specific temporal patterns, even on questionable channels. Interestingly, we do not find evidence of “serial haters”, intended as active users posting exclusively hateful comments. Still, we note that users skewed towards one of the two categories of video channels (questionable, reliable) are more prone to use toxic language –i.e. inappropriate, violent, or hateful– within their opponents community. Interestingly, users skewed towards reliable content use on average a more toxic language than their counterpart. Finally, we find that the overall toxicity of the discussion increases with its length measured both in terms of the number of comments and time. In other words, online debates tend to degenerate towards increasingly toxic exchanges of views, in line with Godwin’s law.
2 Methods
2.1 Data Collection
We collected about 1.3M comments posted by more than 345,000 users on 30,000 videos from 7,000 channels on YouTube. Using the official YouTube Data API, we performed a keyword search for videos that matched a list of keywords, i.e., {coronavirus, nCov, corona virus, corona-virus, covid, SARS-CoV}. An in-depth search was then performed by crawling the network of related videos as provided by the YouTube algorithm. Then, we filtered the videos that matched our set of keywords in the title or description from the gathered collection. Finally, we collected the comments received by these videos. The title and the description of each video, as well as the comments, are in Italian according to the Google’s cld3 language detection service. The set of videos covers the time window that goes from 01/12/2019 to 21/04/2020, while the set of comments ranges in the time window that goes from 15/01/2020 to 15/06/2020.
We assigned a binary label to each YouTube channel to distinguish between two categories: questionable and reliable. A questionable YouTube channel is a channel producing unverified and false content or directly associated to a news outlet that failed multiple fact checks performed by independent fact checking agencies. The list of YouTube channels labelled as questionable was provided by the Italian Communications Regulatory Authority (AGCOM). The remainder of the channels were labelled as reliable. Table 1 shows a breakdown of the dataset.
| Channels | Videos | Comments | ||
| Category | Reliable | 7,140 | 29,975 | 1,170,461 |
| 99.7 % | 98.5 % | 91.8 % | ||
| Questionable | 17 | 464 | 103,475 | |
| 0.3 % | 1.5 % | 8.2 % | ||
| Total | 7,157 | 30,436 | 1,273,930 | |
| 100 % | 100 % | 100 % |
2.2 Hate Speech Model
Our aim is to create two high-quality manually annotated datasets for training and evaluating a deep learning hate speech model. We then apply the model to all the collected data and study the relationship between the hate speech phenomenon and misinformation.
Deep learning models based on Transformer architecture outperform other approaches to automated hate speech detection, as resulted from recent shared tasks in the SemEval-2019 evaluation campaign: HatEval [21] and OffensEval [27], as well as OffensEval 2020 [22]. The central reference for hate speech detection for Italian is the report on the EVALITA 2018 hate speech detection task [28]. Furthermore, in [29] authors modelled the hate speech task using the Italian pre-trained language model AlBERTo achieving state-of-the-art results on Facebook and Twitter datasets. We trained a new hate speech detection model for Italian following the state-of-the-art approach [29] on our four-class hate speech detection task (see Sections 2.2.1 and 2.2.2 for detailed information).
2.2.1 Data Selection and Annotation
The comments to be annotated were sampled from the Italian YouTube comments on videos about the COVID-19 pandemic in the period from January 2020 to May 2020. Two sets were annotated: a hate-speech-rich training set with 59,870 comments and an unbiased evaluation set with 10,536 comments.
To get a training set that is rich with hate speech, we annotated all the comments with a (basic) hate speech classifier (machine learning model) that assigns a score between -3 (hateful) and +3 (normal). The basic classifier was trained on a publicly available dataset of Italian hate speech against immigrants [30]. Even though this basic model is not very accurate, its performance is better than random and we used its result for selecting the training data to be annotated and later used for training our machine learning model. For a realistic evaluation scenario, threads (i.e. all the comments on a video) were kept intact during the annotation procedure, yet individual comments were annotated.
The threads (with comments) to be annotated for the training set were selected according to the following criteria: thread length (the number of comments in a thread between ten and five hundred), and hatefulness (at least 5% of hateful comments according to our basic classifier). The application of these criteria resulted in 1,168 threads (VideoIds) and 59,870 comments. The evaluation set was selected from May 2020 data as a random (unbiased) sample of 10,543 comments grouped into 151 threads (videos).
Our annotation schema is adapted from OLID [31] and FRENK [32]. We differentiate between the following hate speech types:
-
•
Appropriate;
-
•
Inappropriate (the comment contains terms that are obscene, vulgar; but the text is not directed at any person specifically);
-
•
Offensive (the comment includes offensive generalisation, contempt, dehumanisation, indirect offensive remarks);
-
•
Violent (the comment’s author threatens, indulges, desires or calls for (physical) violence against a target; it also includes calling for, denying or glorifying war crimes and crimes against humanity).
The data was split among eight contracted annotators. Each comment was annotated twice by two different annotators. The splitting procedure was optimised to get approximately equal overlap (in the number of comments) between each pair of annotators for each dataset. The annotators were given clear annotation guidelines, a training session and a test on a small set to evaluate their understanding of the task and their commitment before starting the annotation procedure. Furthermore, the annotation progress was closely monitored in terms of annotator agreement to ensure high data quality.
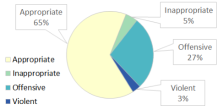
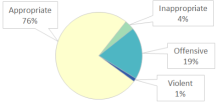
The annotation results for the training and evaluation sets are summarised in Figure 1. The annotator agreement in terms of Krippendorf alpha and accuracy (i.e. percentage of agreement) on both the training and the evaluation sets is presented in Table 2. The agreement results indicate that the annotation task is difficult and ambiguous, as the annotators agree on the label of about 80% of the cases. Since we have an uneven class distribution, is a better measure of agreement as it accounts for the agreement by chance. Our agreement scores in terms of are comparable to those of high-quality datasets, like [33].
| Dataset | Date | Size | ||
|---|---|---|---|---|
| Train | Jan.-Apr. 2020 | 119,670 | 0.586 | 0.774 |
| Evaluation | May 2020 | 21,072 | 0.555 | 0.818 |
2.2.2 Classification
A state-of-the-art neural model based on Transformer language models was trained to distinguish between the four hate speech labels. We use a language model based on the BERT architecture [34] which consists of 12 stacked Transformer blocks with 12 attention heads each. We attach a linear layer with a softmax activation function at the output of these layers to serve as the classification layer. As input to the classifier, we take the representation of the special [CLS] token from the last layer of the language model. The whole model is jointly trained on the downstream task of four-class hate speech detection. We used AlBERTo [35], a BERT-based language model pre-trained on a collection of Tweets in the Italian language. According to previous work[34], fine-tuning of the neural models was performed end-to-end. We used the Adam optimizer with the learning rate of and learning rate warmup over the first 10% of the training instances. We used weight decay set to 0.01 for regularization. The model was trained for 3 epochs with batch size 32. We performed the training of the models using the HuggingFace Transformers library [36].
The tuning of our models was performed by cross validation on the training set and the final evaluation was performed on the separate out-of-sample evaluation set. In our setup, each data instance (comment) is labelled twice, possibly with inconsistent labels. To avoid data leakage between training and testing splits in cross validation, we use 8-fold cross validation where in each fold we use all comments annotated by one annotator as a test set. We report the performance of the trained models using the same measures as we used for annotator agreement: Krippendorff’s Alpha-reliability (), accuracy (), and add score on both the training and the evaluation datasets. The validation results are reported in Table 3.
| overall | appropriate | inappropriate | offensive | violent | ||
|---|---|---|---|---|---|---|
| Model | ||||||
| Model train. | 0.59 | 0.79 | 0.87 | 0.54 | 0.64 | 0.52 |
| Model eval. | 0.55 | 0.84 | 0.91 | 0.59 | 0.58 | 0.39 |
| An. agree. train. | 0.59 | 0.77 | 0.86 | 0.52 | 0.63 | 0.63 |
| An. agree. eval. | 0.56 | 0.82 | 0.90 | 0.53 | 0.57 | 0.55 |
The performance of our model is comparable to the annotator agreement in terms of Krippendorf Alpha and Accuracy, proving our model’s high-quality. The model achieves the annotator agreement both on the training dataset in the cross validation setting as well as on the evaluation dataset which shows its ability to generalise well on the evaluation set. We observe similar results in terms of F1 scores for individual classes. The only noticeable drop in performance compared to the annotators is the performance on the minority (violent) class. We attribute this drop to the very low amount of data available for the violent class compared to the other classes, however the performance is still reasonable. We therefore apply our hate speech detection model to the set of 1.3M comments and report the findings.
3 Results and Discussion
3.1 Relationship between hate speech and misinformation
We start our analysis examining the distribution of the different hate speech types on both reliable and questionable YouTube channels. Figure 2 shows the cumulative distribution of comments, total and per type, by channel. The x-axis shows the YouTube channels ranked by their total number of comments, while the y-axis shows the total number of comments in the dataset (both quantities are reported as proportions). We observe that the distribution of comments is Pareto-like; indeed, the first 10% of channels (dotted vertical line) covers about 90% of the total number of comments. Such a 10 to 90 percent relationship is even stronger when comments are analysed according to their types; indeed, the heterogeneity of the distribution decreases going from violent to appropriate comments. It is also worth noting that, as indicated by the secondary y-axis of Figure 2, the first 10% of channels with most comments also contain about 50% of all the questionable channels in our list, thus indicating a relatively high popularity of these channels. In addition, questionable channels are about 0.25% of the total number of channels that received at least one comment and, despite being such a minority, they cover 8% of the total number of comments (with the following partitioning: 8% appropriate; 7% inappropriate; 9% offensive; 9% violent) and the 1.3% of the total number of videos, thus highlighting a disproportion between their activity and popularity.
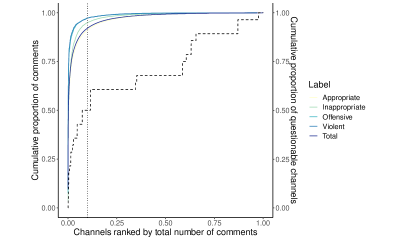
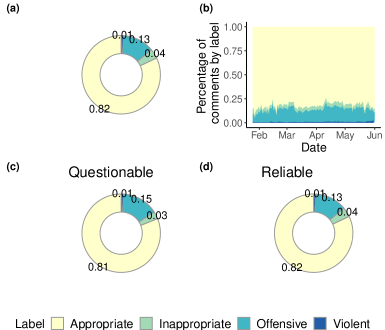
Figure 3 shows the proportion of comments by label and channel types, and their trend over time. In panel (a) we display the overall proportion of comment types, noting that the majority of comments is appropriate, followed by offensive, inappropriate, and violent types, all relatively stable over time (see panel (b)). It is worth remarking that, despite the proportion of hate speech found in the dataset is consistent with –although slightly higher than– previous studies [26, 14], the presence of even a limited number of hateful comments is in direct conflict with the platform’s policy against hate speech. Moreover, we do not observe relevant differences between questionable (panel (c)) and reliable (panel (d)) channels, providing a first piece of evidence in favour of a moderate (if not absent) relationship between online hate and misinformation.
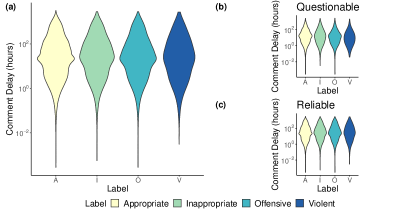
Now we aim at understanding whether hateful comments display a typical (technically, the average) time of appearance. This kind of information can indeed be crucial for the implementation of timely moderation efforts. More specifically, our goal is to discover whether 1) different hate speech types have typical delays and 2) any difference holds between comments on videos disseminated by questionable and reliable channels. To this aim, we define the comment delay as the time elapsed between the posting time of the video and that of the comment (in hours). Figure 4 displays the comment delays for the four types of hate speech and for questionable and reliable channels. Looking at panel (a) of Figure 4, we first note that all comments share approximately the same delay regardless of their type. Indeed, the distributions of the comment delay are roughly log-normal with a long average delay ranging from 120 hours in the case of appropriate comments to 128 hours in the case of violent comments (the comment delay is reduced by when removing observations in the right tail of the distribution as shown in Table 4 of SI). For what concerns comments on videos published by questionable and reliable channels, we do not find strong differences between typical delays of hate speech types within the two domains. In the case of questionable channels, we find that comment delays range from 66 to 42 hours, while for reliable channels they range from 125 to 136 hours (as reported in SI). To summarise, we find a discrepancy in users’ responsiveness to the two types of content, with comments on questionable videos having a much lower typical delay than those on reliable videos. In addition, comments typical delays differ between reliable and questionable channels. In particular, on questionable channels toxic comments appear first and faster than appropriate ones, following decreasing levels of toxicity (violent offensive inappropriate). In other words, violent comments on questionable content display the shortest typical delay, followed by offensive, inappropriate, and appropriate comments. Conversely, on reliable channels the shortest typical delay is observed for appropriate comments, followed by violent, inappropriate, and offensive comments (for details refer to SI).
3.2 Users’ behaviour and misinformation
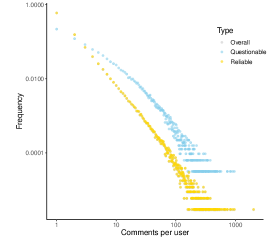
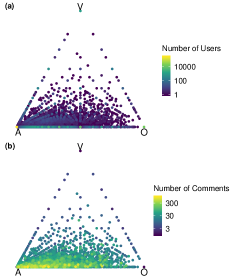
In line with other social media platforms [37, 23], users activity on YouTube follows a heavy tailed distribution, i.e., the majority of users post few comments, while a small minority is hyperactive (see SI for details). Now we want to investigate whether a systematic tendency towards offences and hate can be observed for some (category of) users. In Figure 5, each vertex of the square represents one of the four hate speech types (appropriate - A; inappropriate - I; offensive - O; violent - V). Each dot is a user whose position in the square depends on the fraction of his/her comments for each category. As an example, a user posting only appropriate comments will be located exactly on the vertex A (i.e., in (0,0)), while a user that splits his/her activity evenly between appropriate and inappropriate comments will be located in the middle of the edge connecting the vertices A and I. Similarly, a user posting only violent comments will be located exactly on the vertex V (i.e., in (1,0). More formally, to shrink the 4-dimensional space deriving by the four labels that fully characterise the activity of each user, we associate a user the following coordinates in a 2-dimensional space:
| (1) |
| (2) |
where , , , are the proportions, respectively, of appropriate, inappropriate, offensive, and violent comments posted by user over his/her total activity .
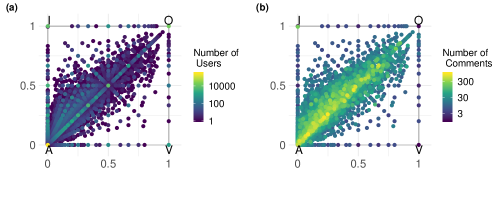
Although most of the users leave only or mostly appropriate comments, there are also several users ranging across categories (i.e., located away from the vertices of the square in Figure 5). Interestingly, there is no evidence of “serial haters”, i.e., active users exclusively using hateful language. Indeed, while there are users posting only or mostly violent comments (see Figure 5 a), their overall activity is very low and below five comments (see Figure 5 b). A similar situation is observed for offenders, i.e., active users posting only offending comments. Although we cannot exclude that moderation efforts put in place by YouTube (if any) might partially impact these results, the absence of serial haters and offenders highlights that hate speech is rarely only an issue of specific categories of users. Rather, it seems that regular users are occasionally triggered by external factors.
To rule out possible confounding factors (note that users located in the centre of the square could display a balanced activity between different pairs of comment categories) we repeated the analysis excluding the category I (i.e, inappropriate). The results are provided in SI and confirm what we observe in Figure 5.
We now aim at unveiling the relationship between users behaviour in terms of commenting patterns and their activity with respect to questionable and reliable channels. Since misinformation is often associated with the diffusion of polarising content which plays on one’s fear and could fuel anger, frustration and hate [38, 39, 40], our intent is to understand whether users more loyal to questionable content are also more prone to use a toxic language in their comments. Thus, we define the leaning of a user as the fraction of his/her activity spent in commenting videos posted by questionable channels, i.e.,
| (3) |
where is the number of comments on videos from questionable channels posted by the user and is the activity of user . Similarly, for each user we compute the fraction of non-appropriate comments as:
| (4) |
where is the fraction of appropriate comments posted by user .
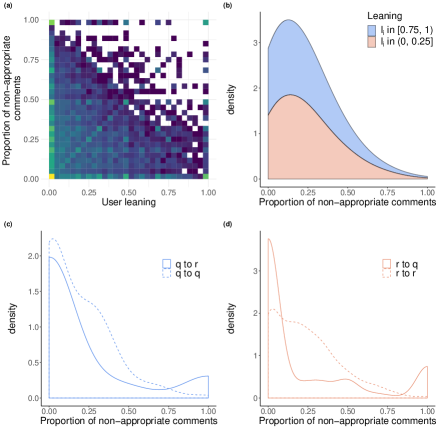
In Figure 6 (a), we compare users’ leaning against the fraction of non-appropriate comments . As expected, we may observe two peaks (of different magnitude) in correspondence of extreme values of leaning ( and ), represented by the brighter squares in the plot. In addition, the joint distribution becomes sparser in correspondence of higher values of users’ leaning and fraction of non-appropriate comments ( and ), indicating that a relevant share of users are placed at the two extremes of the distribution (thus being somewhat polarised) and that users producing mostly non-appropriate comments are way less present.
In Figure 6 (b), we display the proportion of non-appropriate comments posted by users displaying leaning at the two tails of the distribution (i.e., users displaying a remarkable tendency to comment questionable videos and users with a remarkable tendency to comment reliable videos ). We find that users skewed towards reliable channels post, on average, a higher proportion of non-appropriate comments () than users skewed towards questionable channels (). In other words, users who tend to comment on reliable videos are also more prone to use a non-appropriate/toxic language. Further statistics on the two distributions are reported in SI.
Panel (c) of Figure 6 provides a comparison between the distributions of non-appropriate comments posted by users skewed towards questionable channels ( in the legend) on videos published by either questionable or reliable channels. Panel (d) of Figure 6 provides a similar representation for users skewed towards reliable channels ( in the legend). We may note a strong difference in users behaviour: quite unimodal when they comment videos on the same side of the leaning; bimodal when they comment videos on the opposite side of leaning. Therefore, users tend to avoid using a toxic language when they comment videos in accordance with their leaning and to separate into roughly two classes (non-toxic, toxic) when they comment videos in contrast with their preferences. This finding resonates with evidence of online polarisation and with the presence of peculiar characters of the internet such as trolls and social justice warriors.
3.3 Toxicity Level of Online Debates
Finally, we aim at investigating whether online debates degenerate (i.e., increase their average toxicity) when the discussion gets longer, both in terms of number of comments and time. Indeed, we are interested in analysing how commenting dynamics change over time and whether online hate follows similar dynamics to those observed for users’ sentiment [24]. Moreover, we want to understand whether the toxicity of comments tends to follow certain dynamics empirically observed on the internet such as Godwin’s law. To this purpose, we test whether toxic comments tend to appear more frequently at later stages of the debate.
To compute the toxicity level of a debate around a certain video, we assign each hate speech type (A,I,O,V) a toxicity value as follows:
-
•
Appropriate: = 0
-
•
Inappropriate: = 1
-
•
Offensive: = 2
-
•
Violent: = 3
Then, we define the toxicity level of a discussion of comments as the average of the toxicity values over all the comments of the discussion:
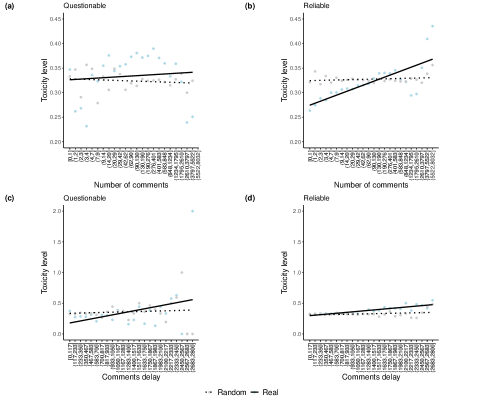
To understand how the toxicity level changes with respect to the number of comments and to comment delay (i.e., the time elapsed between the posting time of the video and that of the comment), we employ linear regression models. Figure 7 shows that a positive relationship between the two variables (i.e., average toxicity is an increasing function of the number of comments and comment delay) exists, and that such a relationship cannot be reproduced by linear models obtained with randomised comment labels (regression outcomes are reported in SI).
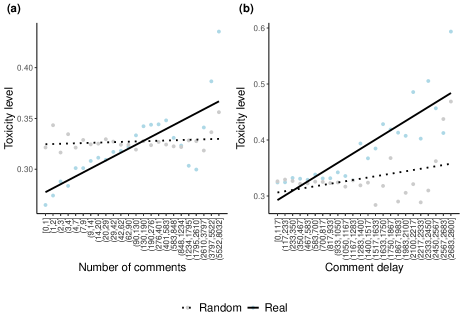
We apply a similar approach to distinguish between comments on videos from questionable and reliable channels (as shown in SI). Overall, similarly to the general case, we find stronger positive effects in real data than in randomised models although such effects are significant only in the case of comments under videos posted by reliable channels.
4 Conclusions
The aim of this work is two-fold: i) to investigate the behavioural dynamics of online hate speech and ii) to shed light on the possible relationship with misinformation exposure and consumption. We apply a hate speech deep learning model to a large corpus of more than one millions comments on Italian YouTube videos. Our analysis provides a series of important results which can support the development of appropriate solutions to prevent and counter the spread of hate speech online. First, there is no evidence of a strict relationship between the usage of a toxic language (including hate speech) and being involved within the misinformation community on YouTube. Second, we do not observe the presence of “serial” haters, instead it seems that the phenomenon of hate speech involves regular users who are occasionally triggered to use toxic language. Third, users polarisation and hate speech seem to be intertwined, indeed users are more prone to use inappropriate, violent, or hateful language within their opponents community (i.e., out of their echo chamber). Finally, we find a positive correlation between the overall toxicity of the discussion and its length, measured both in terms of number of comments and time.
Our results are in line with recent studies about (the increasing) polarisation of online debates and segregation of users [41]. Furthermore, they somewhat confirm the intuition behind some empirically grounded laws such as Godwin’s law which can be interpreted, by extension, as a statement regarding the increasing toxicity of online debates. A potential limitation of this work is represented by the relentless effort of YouTube in moderating hate on the platform. This could have prevented us from having complete information about the actual presence of hate speech in public discussions. Future efforts should extend our work to other languages beyond Italian, social media platforms, and topics. For instance, studying hate speech on online political discourse over time could provide important insights on debated phenomena such as affective polarisation[42]. Moreover, further research on possible triggers in the language and content of videos is desirable.
Acknowledgements
The authors acknowledge financial support from the Slovenian Research Agency (research core funding no. P2-103), and the European Union’s Rights, Equality and Citizenship Programme under Grant Agreement no. 875263. The authors wish to thank Arnaldo Santoro for his support with the categorisation of misinformation sources.
References
- [1] Lada A Adamic and Natalie Glance. The political blogosphere and the 2004 us election: divided they blog. In Proceedings of the 3rd international workshop on Link discovery, pages 36–43, 2005.
- [2] Seth Flaxman, Sharad Goel, and Justin M Rao. Filter bubbles, echo chambers, and online news consumption. Public opinion quarterly, 80(S1):298–320, 2016.
- [3] Kevin Coe, Kate Kenski, and Stephen A Rains. Online and uncivil? patterns and determinants of incivility in newspaper website comments. Journal of Communication, 64(4):658–679, 2014.
- [4] Alexandra A Siegel. Online hate speech. Social Media and Democracy, page 56, 2019.
- [5] Iginio Gagliardone, Danit Gal, Thiago Alves, and Gabriela Martinez. Countering online hate speech. Unesco Publishing, 2015.
- [6] Clay Calvert. Hate speech and its harms: A communication theory perspective. Journal of Communication, 47(1):4–19, 1997.
- [7] Jason Chan, Anindya Ghose, and Robert Seamans. The internet and racial hate crime: Offline spillovers from online access. Mis Quarterly, 40(2):381–403, 2016.
- [8] Karsten Müller and Carlo Schwarz. Fanning the flames of hate: Social media and hate crime. Journal of the European Economic Association, 2018.
- [9] Imran Awan and Irene Zempi. We fear for our lives: Offline and online experiences of anti-muslim hostility. 2015.
- [10] Srijan Kumar, William L Hamilton, Jure Leskovec, and Dan Jurafsky. Community interaction and conflict on the web. In Proceedings of the 2018 world wide web conference, pages 933–943, 2018.
- [11] Nicola F Johnson, R Leahy, N Johnson Restrepo, Nicolas Velasquez, Ming Zheng, P Manrique, P Devkota, and Stefan Wuchty. Hidden resilience and adaptive dynamics of the global online hate ecology. Nature, 573(7773):261–265, 2019.
- [12] Binny Mathew, Anurag Illendula, Punyajoy Saha, Soumya Sarkar, Pawan Goyal, and Animesh Mukherjee. Hate begets hate: A temporal study of hate speech. Proceedings of the ACM on Human-Computer Interaction, 4(CSCW2):1–24, 2020.
- [13] Manoel Ribeiro, Pedro Calais, Yuri Santos, Virgílio Almeida, and Wagner Meira Jr. Characterizing and detecting hateful users on twitter. In Proceedings of the International AAAI Conference on Web and Social Media, volume 12, 2018.
- [14] Alexandra A Siegel, Evgenii Nikitin, Pablo Barberá, Joanna Sterling, Bethany Pullen, Richard Bonneau, Jonathan Nagler, Joshua A Tucker, et al. Trumping hate on twitter? online hate speech in the 2016 us election campaign and its aftermath. Quarterly Journal of Political Science, 16(1):71–104, 2021.
- [15] Leonard Schild, Chen Ling, Jeremy Blackburn, Gianluca Stringhini, Yang Zhang, and Savvas Zannettou. ” go eat a bat, chang!”: An early look on the emergence of sinophobic behavior on web communities in the face of covid-19. arXiv preprint arXiv:2004.04046, 2020.
- [16] Eshwar Chandrasekharan, Mattia Samory, Anirudh Srinivasan, and Eric Gilbert. The bag of communities: Identifying abusive behavior online with preexisting internet data. In Proceedings of the 2017 CHI Conference on Human Factors in Computing Systems, pages 3175–3187, 2017.
- [17] Pete Burnap and Matthew L Williams. Us and them: identifying cyber hate on twitter across multiple protected characteristics. EPJ Data science, 5:1–15, 2016.
- [18] Fabio Del Vigna12, Andrea Cimino23, Felice Dell’Orletta, Marinella Petrocchi, and Maurizio Tesconi. Hate me, hate me not: Hate speech detection on facebook. In Proceedings of the First Italian Conference on Cybersecurity (ITASEC17), pages 86–95, 2017.
- [19] Thomas Davidson, Dana Warmsley, Michael Macy, and Ingmar Weber. Automated hate speech detection and the problem of offensive language. In Proceedings of the International AAAI Conference on Web and Social Media, volume 11, 2017.
- [20] Pinkesh Badjatiya, Shashank Gupta, Manish Gupta, and Vasudeva Varma. Deep learning for hate speech detection in tweets. In Proceedings of the 26th international conference on World Wide Web companion, pages 759–760, 2017.
- [21] Valerio Basile, Cristina Bosco, Elisabetta Fersini, Nozza Debora, Viviana Patti, Francisco Manuel Rangel Pardo, Paolo Rosso, Manuela Sanguinetti, et al. Semeval-2019 task 5: Multilingual detection of hate speech against immigrants and women in twitter. In 13th International Workshop on Semantic Evaluation, pages 54–63. Association for Computational Linguistics, 2019.
- [22] Marcos Zampieri, Preslav Nakov, Sara Rosenthal, Pepa Atanasova, Georgi Karadzhov, Hamdy Mubarak, Leon Derczynski, Zeses Pitenis, and Çağrı Çöltekin. Semeval-2020 task 12: Multilingual offensive language identification in social media (offenseval 2020). arXiv preprint arXiv:2006.07235, 2020.
- [23] Matteo Cinelli, Walter Quattrociocchi, Alessandro Galeazzi, Carlo Michele Valensise, Emanuele Brugnoli, Ana Lucia Schmidt, Paola Zola, Fabiana Zollo, and Antonio Scala. The covid-19 social media infodemic. Scientific Reports, 10(1):1–10, 2020.
- [24] Fabiana Zollo, Petra Kralj Novak, Michela Del Vicario, Alessandro Bessi, Igor Mozetič, Antonio Scala, Guido Caldarelli, and Walter Quattrociocchi. Emotional dynamics in the age of misinformation. PLOS ONE, 10(9):1–22, 09 2015.
- [25] Fabiana Zollo, Alessandro Bessi, Michela Del Vicario, Antonio Scala, Guido Caldarelli, Louis Shekhtman, Shlomo Havlin, and Walter Quattrociocchi. Debunking in a world of tribes. PloS one, 12(7):e0181821, 2017.
- [26] Iginio Gagliardone, Matti Pohjonen, Zenebe Beyene, Abdissa Zerai, Gerawork Aynekulu, Mesfin Bekalu, Jonathan Bright, Mulatu Moges, Michael Seifu, Nicole Stremlau, et al. Mechachal: Online debates and elections in ethiopia-from hate speech to engagement in social media. Available at SSRN 2831369, 2016.
- [27] Marcos Zampieri, Shervin Malmasi, Preslav Nakov, Sara Rosenthal, Noura Farra, and Ritesh Kumar. SemEval-2019 task 6: Identifying and categorizing offensive language in social media (OffensEval). In Proceedings of the 13th International Workshop on Semantic Evaluation, pages 75–86, Minneapolis, Minnesota, USA, June 2019. Association for Computational Linguistics.
- [28] Cristina Bosco, Dell’Orletta Felice, Fabio Poletto, Manuela Sanguinetti, and Tesconi Maurizio. Overview of the evalita 2018 hate speech detection task. In EVALITA 2018-Sixth Evaluation Campaign of Natural Language Processing and Speech Tools for Italian, volume 2263, pages 1–9. CEUR, 2018.
- [29] Marco Polignano, Pierpaolo Basile, Marco De Gemmis, and Giovanni Semeraro. Hate speech detection through alberto italian language understanding model. In NL4AI@ AI* IA, 2019.
- [30] Manuela Sanguinetti, Fabio Poletto, Cristina Bosco, Viviana Patti, and Marco Stranisci. An Italian Twitter corpus of hate speech against immigrants. In Proceedings of the Eleventh International Conference on Language Resources and Evaluation (LREC 2018), 2018.
- [31] Marcos Zampieri, Shervin Malmasi, Preslav Nakov, Sara Rosenthal, Noura Farra, and Ritesh Kumar. Predicting the Type and Target of Offensive Posts in Social Media. In Proceedings of NAACL, 2019.
- [32] Nikola Ljubešić, Darja Fišer, and Tomaž Erjavec. The FRENK datasets of socially unacceptable discourse in slovene and english, 2019.
- [33] I. Mozetič, M. Grčar, and J. Smailović. Multilingual Twitter sentiment classification: The role of human annotators. PLoS ONE, 11(5):e0155036, 2016.
- [34] Jacob Devlin, Ming-Wei Chang, Kenton Lee, and Kristina Toutanova. BERT: Pre-training of deep bidirectional transformers for language understanding. arXiv preprint arXiv:1810.04805, 2018.
- [35] Marco Polignano, Pierpaolo Basile, Marco De Gemmis, Giovanni Semeraro, and Valerio Basile. ALBERTO: Italian BERT language understanding model for NLP challenging tasks based on tweets. In 6th Italian Conference on Computational Linguistics, CLiC-it 2019, volume 2481, pages 1–6. CEUR, 2019.
- [36] Thomas Wolf, Lysandre Debut, Victor Sanh, Julien Chaumond, Clement Delangue, Anthony Moi, Pierric Cistac, Tim Rault, Rémi Louf, Morgan Funtowicz, Joe Davison, Sam Shleifer, Patrick von Platen, Clara Ma, Yacine Jernite, Julien Plu, Canwen Xu, Teven Le Scao, Sylvain Gugger, Mariama Drame, Quentin Lhoest, and Alexander M. Rush. HuggingFace’s Transformers: State-of-the-art Natural Language Processing. ArXiv, abs/1910.03771, 2019.
- [37] Michela Del Vicario, Alessandro Bessi, Fabiana Zollo, Fabio Petroni, Antonio Scala, Guido Caldarelli, H Eugene Stanley, and Walter Quattrociocchi. The spreading of misinformation online. Proceedings of the National Academy of Sciences, 113(3):554–559, 2016.
- [38] Michela Del Vicario, Walter Quattrociocchi, Antonio Scala, and Fabiana Zollo. Polarization and fake news: Early warning of potential misinformation targets. ACM Transactions on the Web (TWEB), 13(2):1–22, 2019.
- [39] Mathias Osmundsen, Alexander Bor, Peter Bjerregaard Vahlstrup, Anja Bechmann, and Michael Bang Petersen. Partisan polarization is the primary psychological motivation behind political fake news sharing on twitter. American Political Science Review, pages 1–17, 2020.
- [40] Andrew Guess, Jonathan Nagler, and Joshua Tucker. Less than you think: Prevalence and predictors of fake news dissemination on facebook. Science advances, 5(1):eaau4586, 2019.
- [41] Matteo Cinelli, Gianmarco De Francisci Morales, Alessandro Galeazzi, Walter Quattrociocchi, and Michele Starnini. The echo chamber effect on social media. Proceedings of the National Academy of Sciences, 118(9), 2021.
- [42] James N Druckman, Samara Klar, Yanna Krupnikov, Matthew Levendusky, and John Barry Ryan. Affective polarization, local contexts and public opinion in america. Nature human behaviour, 5(1):28–38, 2021.
Supplementary Information
| Appropriate | 120 | 259 | 3.85 | 35.4 |
|---|---|---|---|---|
| Inappropriate | 128 | 269 | 3.77 | 39.7 |
| Offensive | 128 | 278 | 3.84 | 36.8 |
| Violent | 127 | 272 | 3.87 | 38.2 |
| Questionable | Reliable | Questionable | Reliable | |
|---|---|---|---|---|
| Appropriate | 65.9 | 124.6 | 7.4 | 6.7 |
| Inappropriate | 65.5 | 132.2 | 7.3 | 7.1 |
| Offensive | 53.3 | 135.0 | 9.1 | 6.9 |
| Violent | 41.7 | 135.9 | 7.8 | 7.4 |
| 0.23 | 0.19 | 0.94 | |
| 0.17 | 0.20 | 1.29 |
| Model 1 | Model 2 | Model 3 | Model 4 | |
| Number of comments | Number of comments | Comment delay | Comment delay | |
| (Real) | (Random) | (Real) | (Random) | |
| (Intercept) | ||||
| x | ||||
| R2 | ||||
| Adj. R2 | ||||
| ; ; | ||||
| Model 1 | Model 2 | Model 3 | Model 4 | |
| Questionable | Questionable | Reliable | Reliable | |
| (Real) | (Random) | (Real) | (Random) | |
| (Intercept) | ||||
| x | ||||
| R2 | ||||
| Adj. R2 | ||||
| Num. obs. | ||||
| ; ; | ||||
| Model 1 | Model 2 | Model 3 | Model 4 | |
| Questionable | Questionable | Reliable | Reliable | |
| (Real) | (Random) | (Real) | (Random) | |
| (Intercept) | ||||
| x | ||||
| R2 | ||||
| Adj. R2 | ||||
| Num. obs. | ||||
| ; ; | ||||